Setting up Dashboards for SI Statistics - Getting Started Guide
This section explains how WSO2 Streaming Integrator servers can be configured to publish data to Prometheus and display WSO2 Streaming Integrator (WSO2 SI) statistics in Grafana dashboards.
Before you begin:
- Download and install Prometheus. For instructions, see the Prometheus Getting Started Guide.
- Download Grafana from Grafana Labs.
Step 1 - Configure the Servers
Follow the instructions below to configure a Grafana dashboard:
Step 1.1 - Configure the Prometheus reporter
Configure the Prometheus reporter in the Streaming Integrator in order to enable statistics for the Prometheus reporter as follows:
- Open the
<SI_HOME>/conf/server/deployment.yamlfile. -
Set the
enabledparameter in thewso2.metricssection totrue, and update the other parameters in the section as shown below. You also need to add themetrics.prometheus:as shown.wso2.metrics: # Enable Metrics enabled: true reporting: console: - # The name for the Console Reporter name: Console # Enable Console Reporter enabled: false # Polling Period in seconds. # This is the period for polling metrics from the metric registry and printing in the console pollingPeriod: 2 metrics.prometheus: reporting: prometheus: - name: prometheus enabled: true serverURL: "http://localhost:9005" -
Enable statistics for the Prometheus reporter at the Siddhi application level.
To enable a Siddhi application to publish its statistics to Grafana, you need to specify Prometheus as the statistics reporter via the
@App:statisticsannotation by setting thereporterparameter as shown in the example below.@App:name('TestMetrics') @App:statistics(reporter = 'prometheus') define stream TestStream (message string);For the dashboards to display statistics, at least one Siddhi application with the above configuration needs to be deployed in the Streaming Integrator Server.
Step 1.2 - Start the Streaming Integrator server
-
Navigate to the
<SI_HOME>/bindirectory. -
Issue the appropriate command based on your operating system to start the Streaming runtime.
- For Windows:
server.bat --run - For Linux/MacOS:
./server.sh
- For Windows:
Step 1.3 - Start the Prometheus server
-
Open the
<PROMETHEUS_HOME>/prometheus.ymlfile and add the following configuration in thescrape_configs:section.scrape_configs: - job_name: 'prometheus' static_configs: - targets: ['localhost:9005'] -
Navigate to the
directory and start the Prometheus server. ./prometheus
Step 1.4 - Start and configure the Grafana server
Follow the instructions below to start and configure the Grafana server:
-
Start Grafana
Info
The procedure to start Grafana depends on your operating system and the installation process. e.g., If your operating system is Mac OS and you have installed Grafana via Homebrew, you start Grafana by issuing the
brew services start grafanacommand. -
Access Grafana via
http://localhost:3000/. -
In the Data Sources section, click Add your first data source. In the Add data source page that appears, click Select for Prometheus.
-
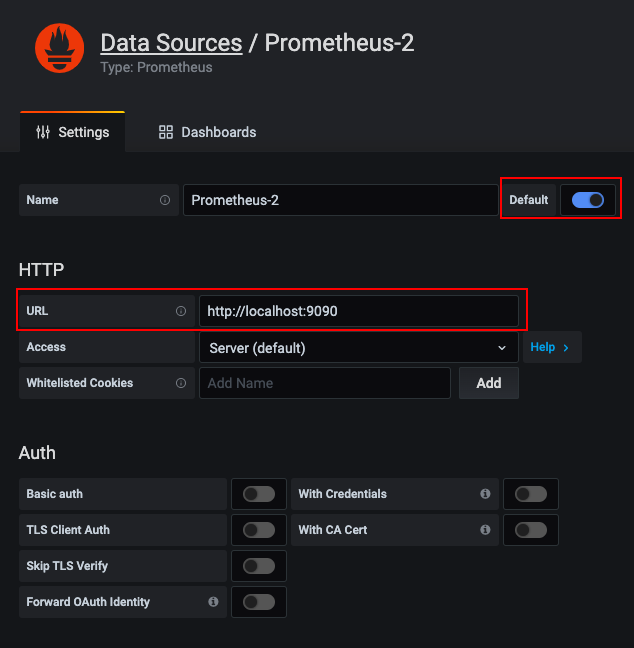
In the Add data source page Settings tab, update the configurations for Prometheus as follows:
-
Click Default to make Prometheus the default data source.
-
Under HTTP, enter
http://localhost:9090as the URL. -
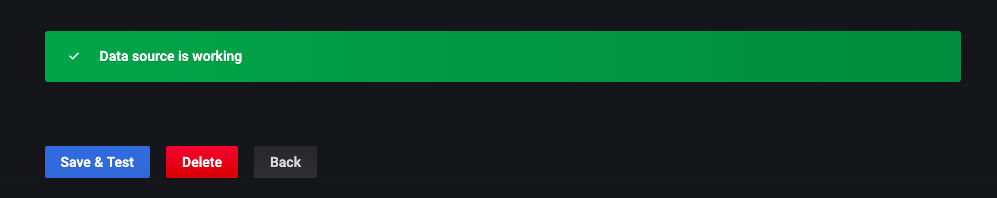
Click Save & Test.
If the data source is successfully configured, it is indicated via a message.
-
Step 1.5 - Load dashboards into Grafana
WSO2 Streaming Integrator offers pre-built dashboards for monitoring streaming data flows and server statistics. Follow the instructions below to import the Grafana dashboards:
-
Download the required JSON file based on the statistics you need to view from here.
Statistics Type Directory General Statistics general-statistics EFL Flow Statistics cdc-statistics file-statistics http-statistics kafka-statistics overview-statistics rdbms-statistics -
Start Grafana and access it via
http://localhost:3000/. -
Import a new dashboard.
-
Click on the plus icon (+) in the side panel.
- Then click Import.
- In the Import page, click Upload .json file.
- Then browse and select the
.jsonfile of the preconfigured dashboard that you downloaded in step 1.5 - (1.). - If required, change the unique identifier displayed in the Unique Identifier (uid).
- Click Import.
Note
Optionally, you can organize the dashboards in folders and delete the dashboards if required.
Step 2 - View dashboards
Follow the instructions below to view a dashboard:
-
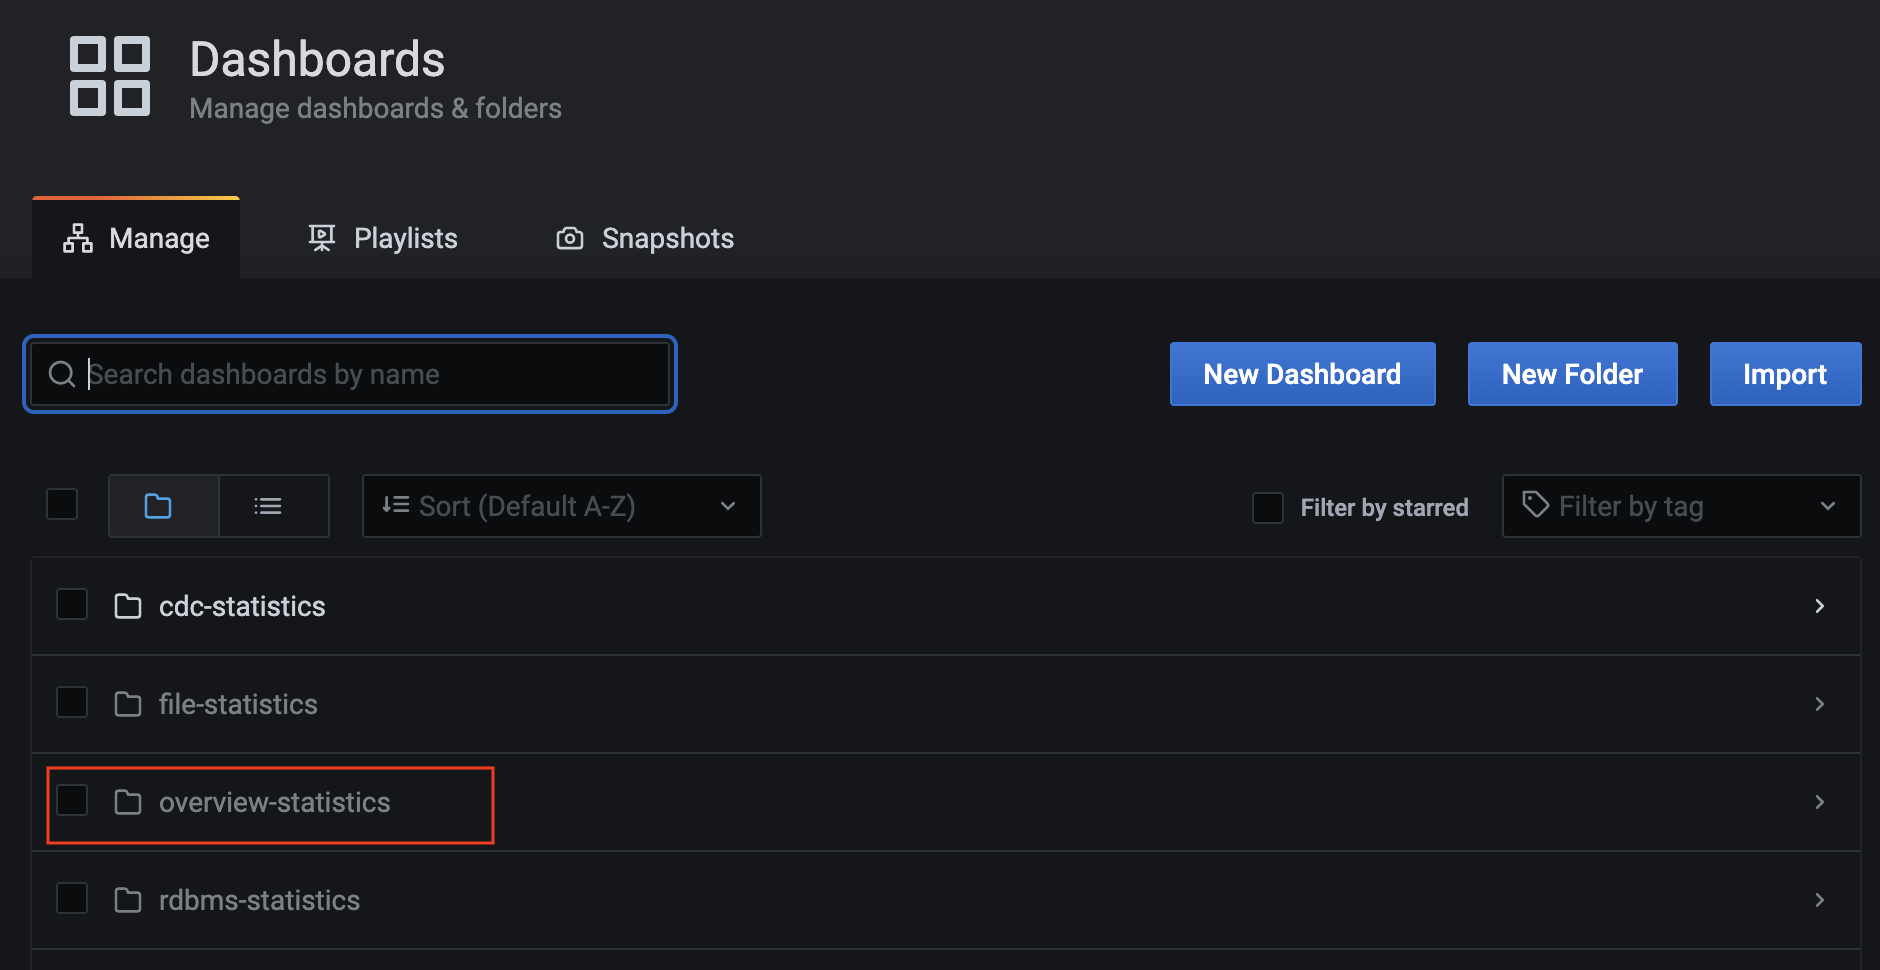
In the left pane, click on the Dashboards icon, and then click Manage to open the Dashboards page.
-
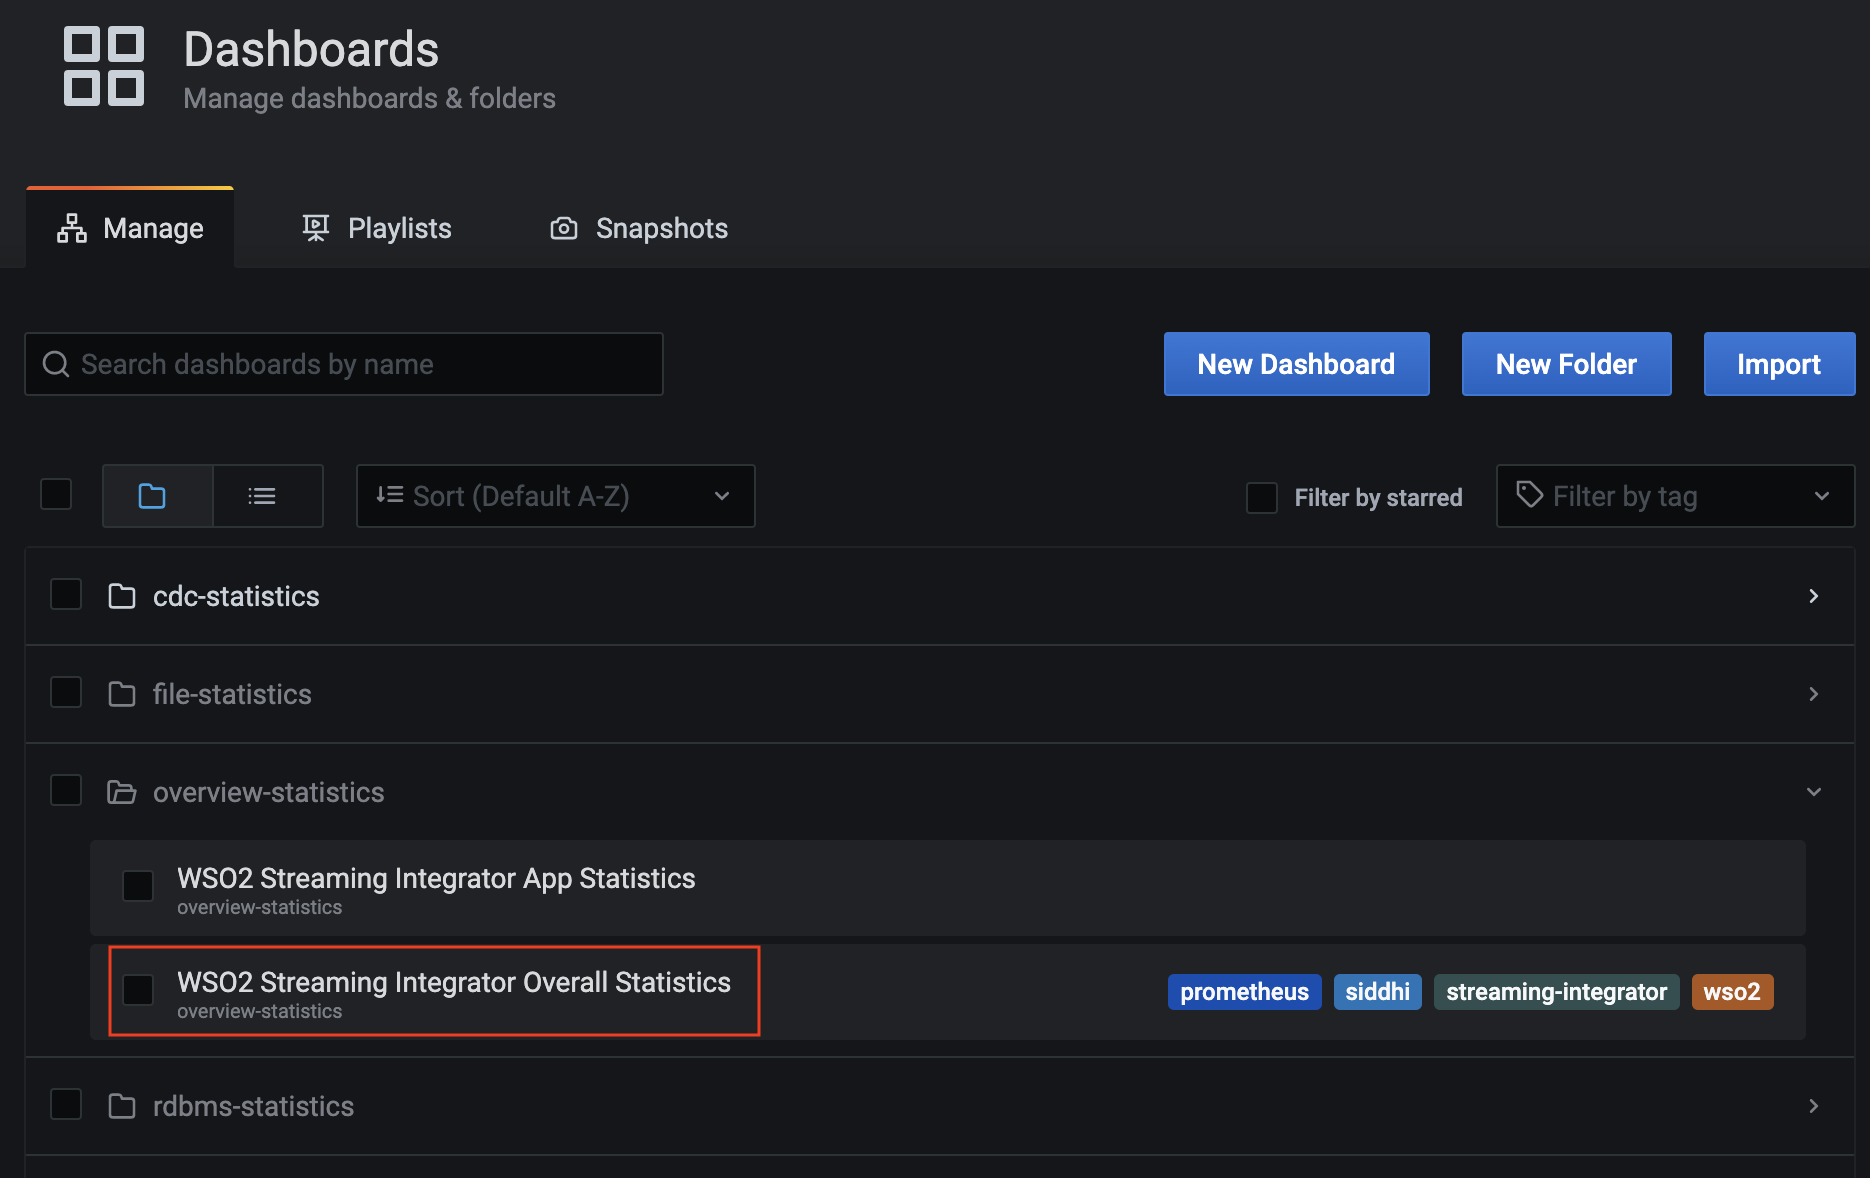
To expand the folder that contains the dashboard you want to view, click on it.
-
Click on the specific dashboard that you want to view.
-
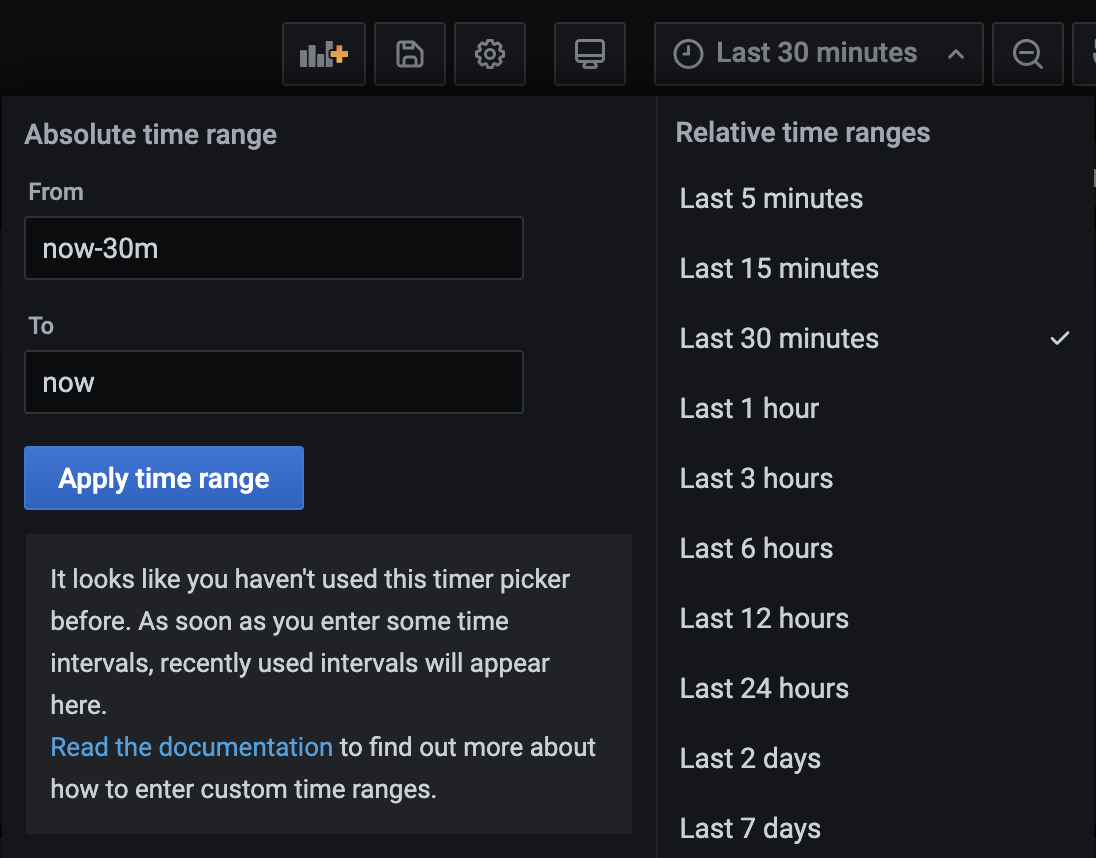
Once the dashboard opens, click on the bar shown below to expand it and specify the time range for which you want to view statistics.
Once you expand the time range bar, you can select the required time interval or specify a custom time interval.