Access the MI Analytics Portal
Let's use MI Analytics to view and monitor statistics and message tracing.
You can monitor the following statistics and more through the MI Analytics Portal:
- Request Count
- Overall TPS
- Overall Message Count
- Top Proxy Services by Request Count
- Top APIs by Request Count
- Top Endpoints by Request Count
- Top Inbound Endpoints by Request Count
- Top Sequences by Request Count
Tip
Monitoring the usage of the integration runtime using statistical information is very important for understanding the overall health of a system that runs in production. Statistical data helps to do proper capacity planning, to keep the runtimes in a healthy state, and for debugging and troubleshooting problems. When it comes to troubleshooting, the ability to trace messages that pass through the mediation flows of the Micro Integrator is very useful.
Before you begin
-
Set up the MI Analytics deployment.
-
Note the following server directory in your deployment.
<MI_ANALYTICS_HOME>This is the root folder of your MI Analytics installation.
Step 1 - Start the servers
Let's start the servers in the given order.
Step 1.1 - Start the Analytics Server
Note
Be sure to start the Analytics server before starting the Micro Integrator.
- Open a terminal and navigate to the
<MI_ANALYTICS_HOME>/bindirectory. -
Start the Analytics server by executing the following command:
sh server.shserver.bat
Step 1.2 - Start the Micro Integrator
Once you have started the Analytics Server, you can start the Micro Integrator.
Step 1.3 - Start the Analytics Portal
- Open a terminal and navigate to the
<MI_ANALYTICS_HOME>/bindirectory. -
Start the Analytics Portal's runtime by executing the following command:
sh portal.shportal.bat
In a new browser window or tab, open the Analytics Portal using the following URL: https://localhost:9645/analytics-dashboard.
Use admin for both the username and password.
Step 2 - Publish statistics to the Portal
Let's test this solution by running the service chaining tutorial. When the artifacts deployed in the Micro Integrator are invoked, the statistics will be available in the portal.
Follow the steps given below.
Step 1: Deploy integration artifacts
If you have already started the Micro Integrator server, let's deploy the artifacts. Let's use the integration artifacts from the service chaining tutorial.
- Download the CAR file.
- Copy the CAR file to the
<MI_HOME>/repository/deployment/server/carbonapps/directory.
Step 2: Start the backend
Let's start the hospital service that serves as the backend to the service chaining use case:
- Download the JAR file of the back-end service from here.
- Open a terminal, navigate to the location where your saved the back-end service.
- Execute the following command to start the service:
java -jar Hospital-Service-JDK11-2.0.0.jar
Step 3: Sending messages
Let's send 8 requests to the Micro Integrator to invoke the integration artifacts:
Tip
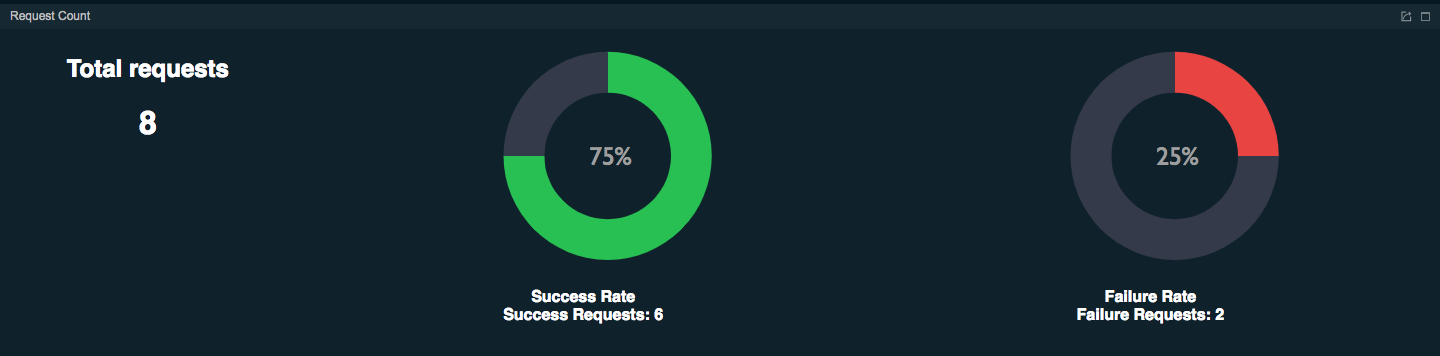
For the purpose of demonstrating how successful messages and message failures are illustrated in the portal, let's send 2 of the requests while the back-end service is not running. This should generate a success rate of 75%.
-
Create a JSON file called
request.jsonwith the following request payload.{ "name": "John Doe", "dob": "1940-03-19", "ssn": "234-23-525", "address": "California", "phone": "8770586755", "email": "[email protected]", "doctor": "thomas collins", "hospital": "grand oak community hospital", "cardNo": "7844481124110331", "appointment_date": "2025-04-02" } -
Open a command line terminal and execute the following command (six times) from the location where you save the
request.jsonfile:
If the messages are sent successfully, you will receive the following response for each request.curl -v -X POST --data @request.json http://localhost:8290/healthcare/categories/surgery/reserve --header "Content-Type:application/json"{ "appointmentNo": 1, "doctorName": "thomas collins", "patient": "John Doe", "actualFee": 7000.0, "discount": 20, "discounted": 5600.0, "paymentID": "e1a72a33-31f2-46dc-ae7d-a14a486efc00", "status": "Settled" } -
Now, shut down the back-end service and send two more requests.
Step 3 - View the Analytics Portal
Info
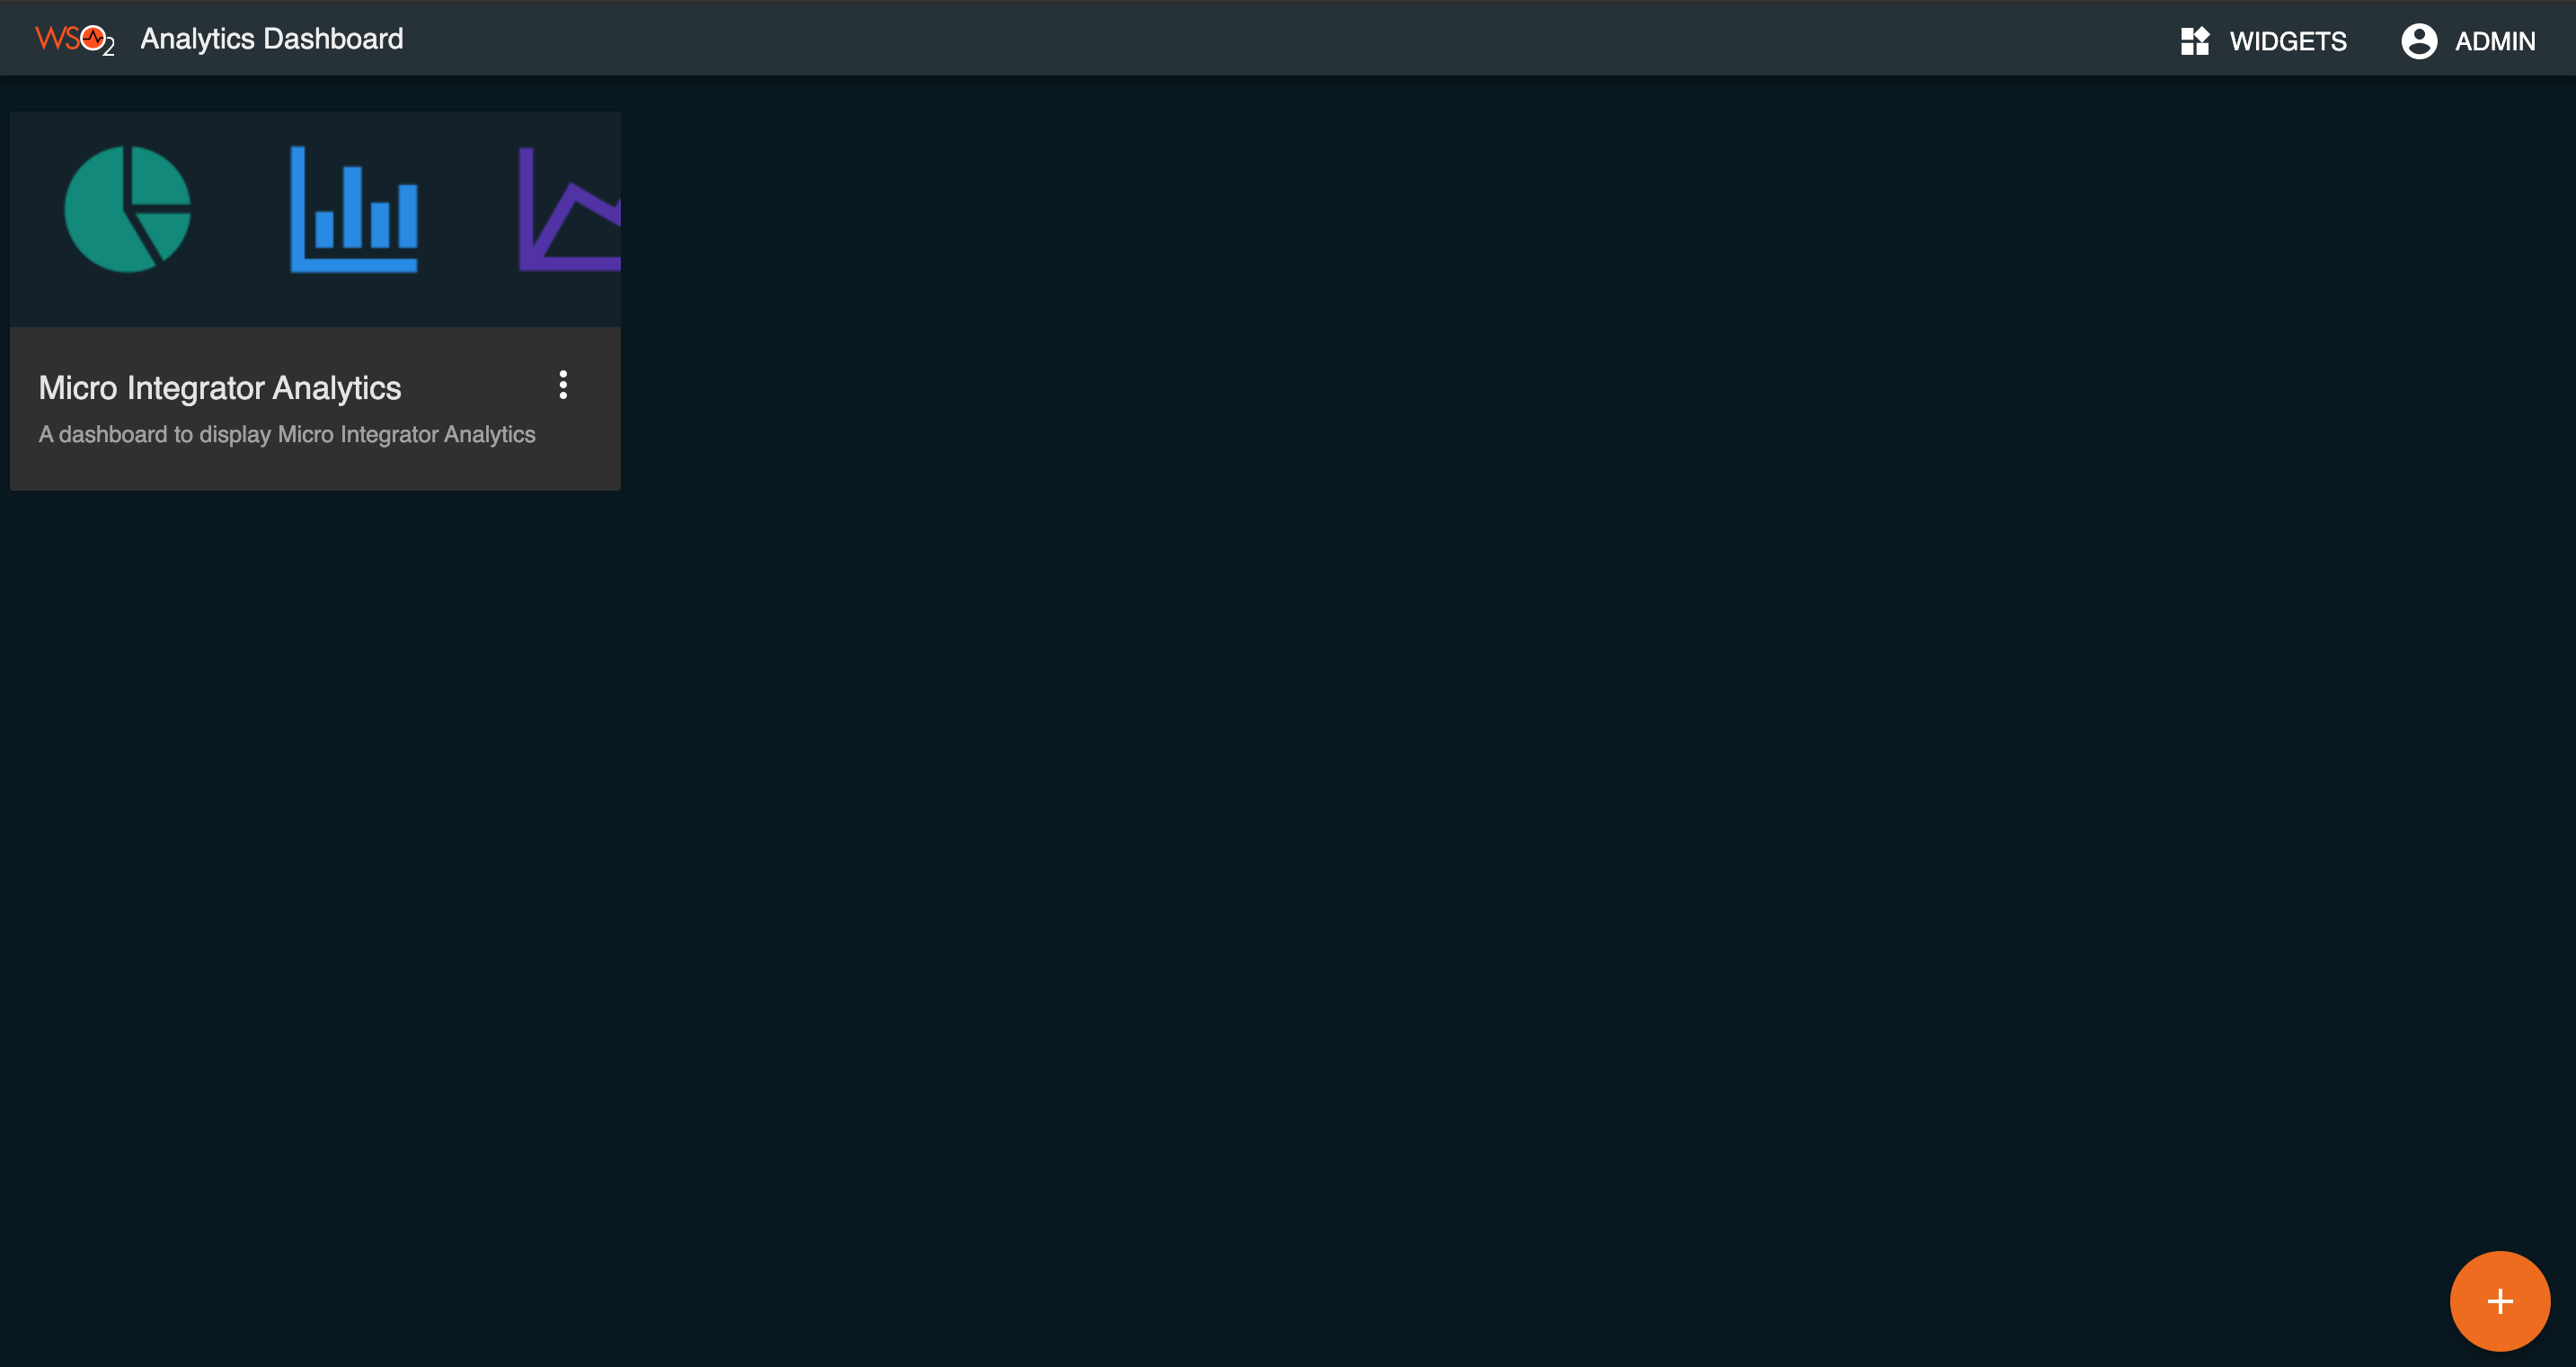
- The Analytics Portal has been renamed to Micro Integrator Analytics as it contains MI related analytics.
- You need to get the latest product updates for your product to view these changes in the current version of WSO2 API-M. This change is available as a product update in Integrator Analytics 7.1.0 from June 18, 2021 onwards.
Note
You can deploy updates in a production environment only if you have a valid subscription with WSO2. Read more about WSO2 Updates.
Once you have signed in to the Analytics Portal server, click the Micro Integrator Analytics icon shown below to open the portal.
Statistics overview
View the statistics overview for all the integration artifacts that have published statistics:
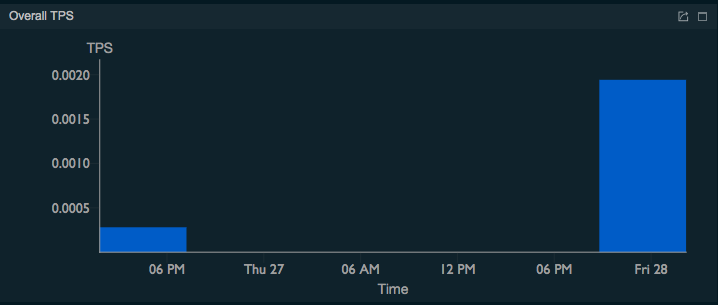
Transactions per second
The number of transactions handled by the Micro Integrator per second is mapped on a graph as follows.
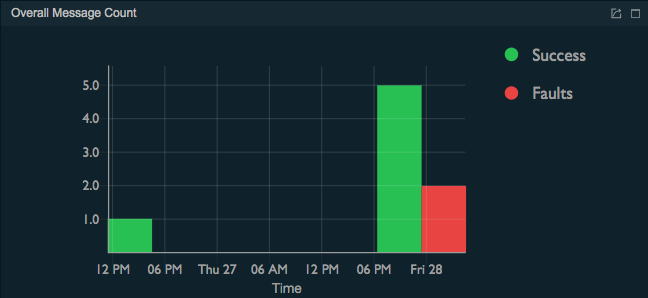
Overall message count
The success rate and the failure rate of the messages received by the Micro Integrator during the last hour are mapped in a graph as follows.
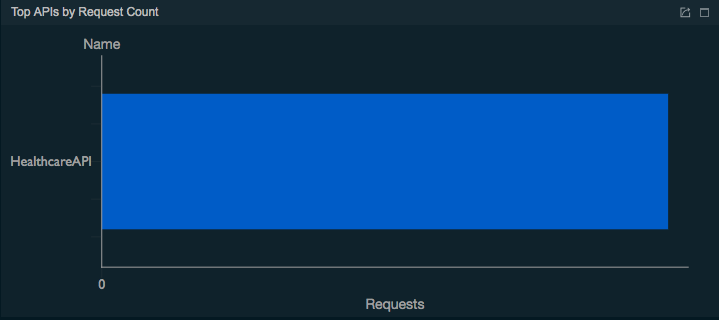
Top APIs by request
The HealthcareAPI REST API is displayed under TOP APIS BY REQUEST COUNT as follows.
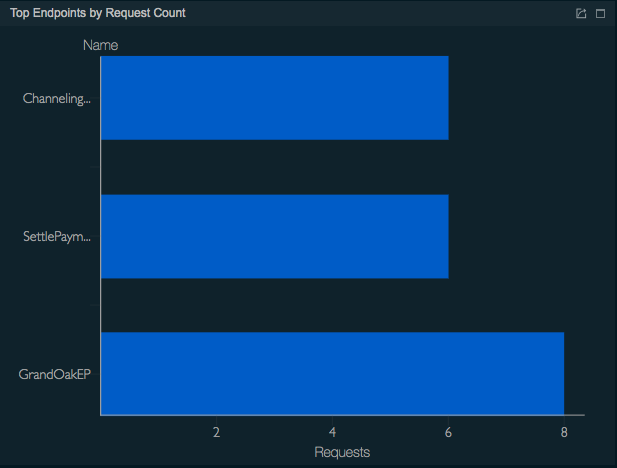
Endpoints by request
The three endpoints used for the message mediation are displayed under Top Endpoints by Request Count as shown below.
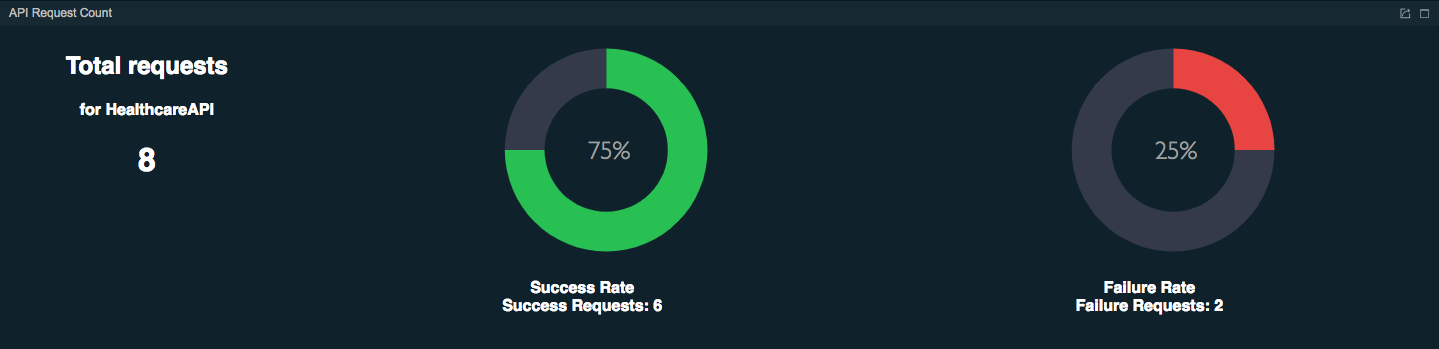
Per API requests
In the Top APIS BY Request COUNT gadget, click HealthcareAPI to open the OVERVIEW/API/HealthcareAPI page. The following is displayed.
- The API Request Count gadget shows the total number of
requests handled by the
StockQuoteAPIREST API during the last hour:
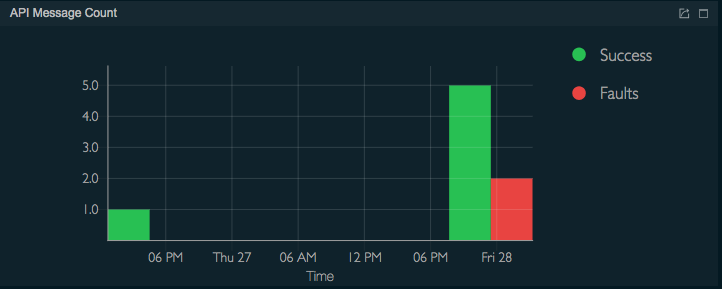
- The API Message Count gadget maps the number of
successful messages as well as failed messages at different
times within the last hour in a graph as shown below.
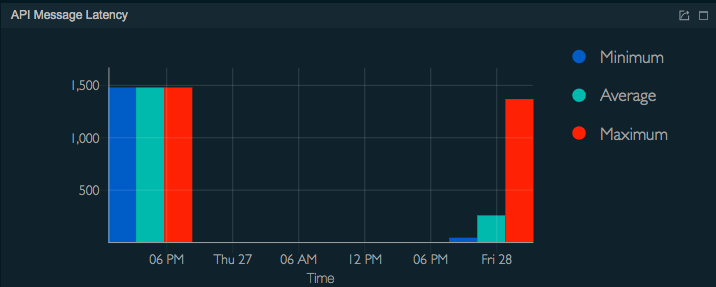
- The API Message Latency gadget shows the speed with
which the messages are processed by mapping the amount of time
taken per message at different times within the last hour as
shown below.
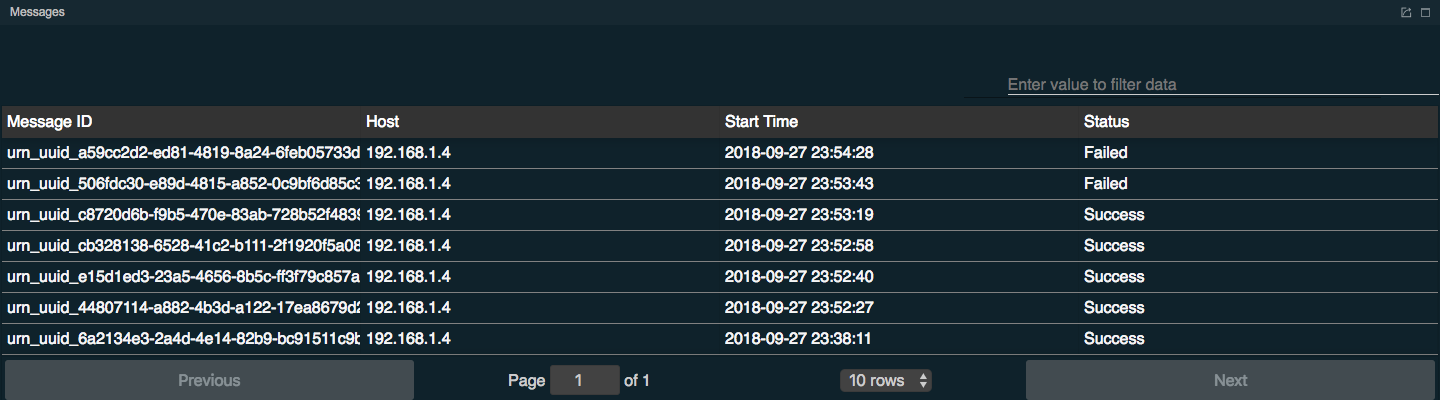
- The Messages gadget lists all the messages handled by
the
StockQuoteAPIREST API during the last hour with the following property details as follows.
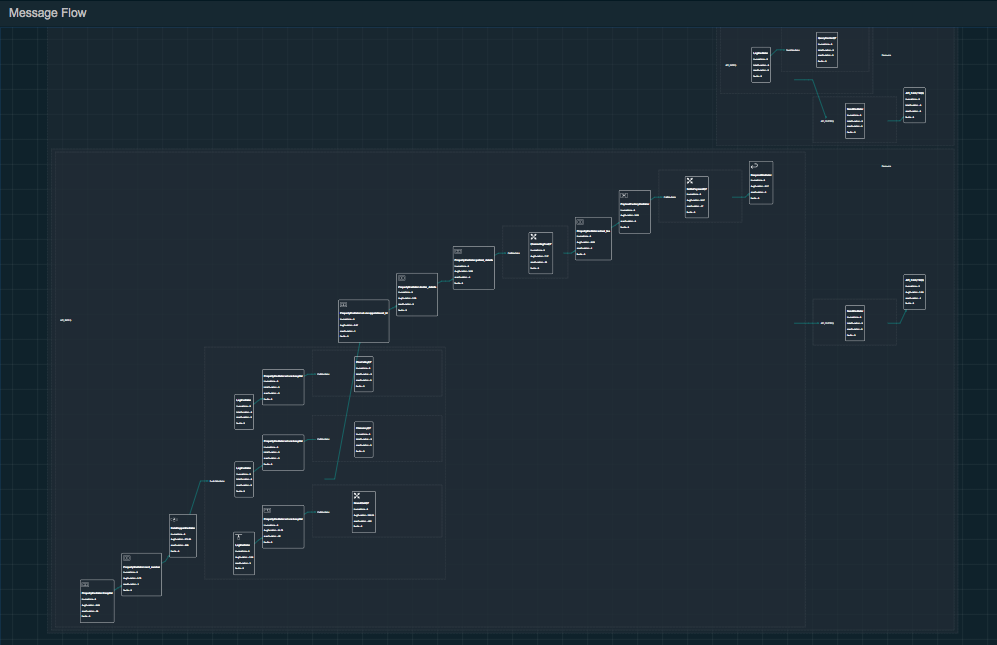
- The Message Flow gadget illustrates the order in which the
messages handled by the
StockQuoteAPIREST API within the last hour passed through all the mediation sequences, mediators and endpoints that were included in the message flow as shown below.
Per endpoint requests
In the Top Endpoints by Request Count gadget, click one of the endpoints to view similar statistics per endpoint.
ChannelingFeeEPSettlePaymentEPGrandOaksEP
You can also navigate to any of the artifacts by using the top-left menu as shown below. For example, to view the statistics of a specific endpoint, click Endpoint and search for the required endpoint.

Message tracing
When you go to the Analytics Portal the message details will be logged as follows:
