Monitoring MI Artifacts and Logs
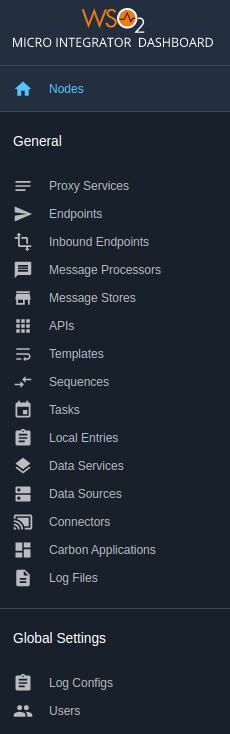
The Micro Integrator (MI) dashboard monitors the MI instances in a deployment. This can be a single MI instance or multiple MI instances in a group (cluster). It provides a graphical view of the integration artifacts that are deployed in the MI instances. You can also perform various management and administration tasks using the dashboard.
The dashboard communicates with the management APIs of each Micro Integrator instance in the group (cluster) to get and manipulate data.
Capabilities of the MI dashboard
You can use the dashboard to perform the following administration tasks related to your Micro Integrator deployment:
-
View the MI servers in the deployment
View basic information of each server node.
-
View integration artifacts deployed in a group
View details of the artifacts deployed in a cluster or group of Micro Integrator instances.
-
Identify the MI servers where a specified artifact is deployed
View the MI server instances where each artifact is deployed.
-
Update deployed artifacts
Note
When you update an artifact, only the specified MI instance will be updated. Cluster-wide updates are not available with the dashboard.
You can activate/deactivate the following artifacts from the dashboard: Proxy Services, Endpoints, and Message Processors.
You can enable/disable tracing for the following artifacts: Proxy Services, Endpoints, APIs Sequences and Inbound Endpoints.
-
View logs
You can view the log files generated for each Micro Integrator instance of the cluster/group.
-
View, update, and add loggers
This page can be accessed by users with admin rights only. You can view log configurations of each instance and update the log level. You can update the log levels on a single node or apply the change to the entire cluster/group as well. Furthermore, you can add new loggers, which will be applied to the entire cluster/group.
-
Manage users
This page can be accessed by users with admin rights only. You can view details of users stored in the external user store. You can also add new users to the specified cluster/group.
Using the MI Dashboard
Follow the steps given below to get started with the Micro Integrator Dashboard.
Step 1 - Download the MI Dashboard
Download the binary distribution of the product, and then follow the instructions to start the Micro Integrator and the dashboard.
Step 2 - Configure the MI servers
Follow the steps given below to configure the MI servers to publish data to the dashboard.
Recommended deployment
Deploy the dashboard in the same network as the MI nodes, so that it can reach each node directly on the node's own IP address. Use the management_hostname and management_port overrides described below only when placing the dashboard in the same network is not possible.
-
To connect the MI servers with the dashboard, add the following configuration to the
deployment.tomlfile (stored in the<MI_HOME>/conf/folder) of each server instance.[dashboard_config] dashboard_url = "https://{hostname/ip}:{port}/dashboard/api/" heartbeat_interval = 5 group_id = "mi_dev" node_id = "dev_node_2"How the MI node advertises its management API
Communication between the two servers happens in both directions:
- The MI node pushes a heartbeat to the dashboard at
dashboard_url. - The dashboard calls back into the MI node's management API to read artifact data and to perform management operations.
For the second direction to work, each MI node has to tell the dashboard how to reach it. It does this by including its own management API URL (
mgtApiUrl) in every heartbeat.At startup, MI derives this URL from the IP address of the server's default network interface and the internal HTTPS API port:
https://<NODE_IP>:9164/management/This works only when the dashboard can open a connection to that IP address directly. If the dashboard runs outside the MI deployment — in a different network, a different Kubernetes cluster, or outside the cluster entirely — the node IP is not routable from the dashboard. In this case, the node still appears in the dashboard UI, because heartbeats flow in the other direction and continue to succeed, but every attempt to load artifact data or run an operation on the node fails.
When the dashboard cannot reach the node IP directly, override the advertised address using
management_hostnameandmanagement_port:[dashboard_config] dashboard_url = "https://{hostname/ip}:{port}/dashboard/api/" management_hostname = "<MI_MANAGEMENT_HOSTNAME>" management_port = <MI_MANAGEMENT_PORT>MI then advertises
https://<MI_MANAGEMENT_HOSTNAME>:<MI_MANAGEMENT_PORT>/management/instead of the IP-based URL.If you omit
management_port, MI advertiseshttps://<MI_MANAGEMENT_HOSTNAME>/management/with no port. Use this form when the node is exposed through an Ingress or a reverse proxy that listens on the default HTTPS port (443).Reaching MI through a load balancer or a Kubernetes Service
The dashboard addresses MI nodes individually: when you select a node in the UI, the request goes to the
mgtApiUrlthat node reported. Ifmanagement_hostnamepoints to a load balancer, a Kubernetes Service, or an Ingress that fronts more than one MI replica, that assumption breaks — the load balancer decides which replica actually serves each request, and it may not be the node you selected.As a result, the following are not reliable in such a deployment:
- Node-scoped read operations. Log files, log configurations, deployed artifact lists, and server details are returned by whichever replica happened to receive the request, so the dashboard UI may attribute them to the wrong node.
- Write and state-changing operations. Activating/deactivating proxy services, endpoints, and message processors; enabling/disabling tracing; updating log levels; adding loggers; and adding or removing users are applied only to the replica that received the request. They do not apply to the node you selected, and they are not propagated across the group.
- Consistency across retries. Repeating the same operation can land on a different replica each time, so the state shown in the UI may not match the state on any single node.
If you need accurate per-node monitoring and management, expose each MI node under its own address — for example, a distinct hostname or port per node, a per-pod Ingress rule, or the stable pod DNS names of a StatefulSet fronted by a headless Service — and set
management_hostname/management_porton each node to its own address.dashboard_url Required. This is the URL to access dashboard server. Replace the hostname/IP and port (default - 9743) with relevant values from your environment. heartbeat_interval Optional. The time interval (in seconds) between two heartbeats sent from the Micro Integrator to the dashboard server. By default, the heartbeat_interval is set to 5.group_id Optional. In a clustered deployment, the group ID should be the same in all Micro Integrator Instances. The dashboard displays information from one group at a time. By default, the group_id is set to default.node_id Optional. By default, in a clustered deployment, the relevant node_idis used as this configuration. For more information about the cluster node ID, see the instructions on configuring an MI cluster. In a non-clustered deployment, a random UUID is used if thenode_idis not set for this configuration.management_hostname Required only if the dashboard cannot reach this node directly on its own IP address (for example, when the dashboard is deployed outside the MI deployment, or when MI runs in Kubernetes behind an Ingress/Service). Hostname dedicated to this specific Micro Integrator node's management endpoint. When this is not set, MI advertises https://<NODE_IP>:9164/management/, where<NODE_IP>is the IP address of the node's default network interface — see the explanation above.management_port Optional. Port of the Micro Integrator management endpoint, set alongside management_hostname. If omitted, the advertised URL carries no port (https://<management_hostname>/management/), which suits an Ingress or reverse proxy on the default HTTPS port. - The MI node pushes a heartbeat to the dashboard at
-
Optionally, configure the Micro Integrator user store.
Tip
Note the following about your user store configurations.
- The user credentials for signing in to the dashboard should be stored in your user store. This can be the default file-based user store or an external LDAP/RDBMS user store.
- User management is possible only if you have an RDBMS or LDAP user store for your Micro Integrator.
- If you have an external RDBMS user store, be sure that the RDBMS driver is correctly added to the
<MI_HOME>/libfolder. You will not be able to sign in without the driver.
-
Regardless of the user who logs in, the dashboard uses the user configured in its
deployment.tomlto fetch the data to the dashboard server. Then the dashboard renders these data in the UI according to logged-in user. Hence, configure the super admin user credentials in the user store as mentioned below in thedeployment.tomlfile (stored in the<MI-DASHBOARD_HOME>/conf/folder).[mi_user_store] username = "admin" password = "admin"
Step 3 - Start the MI Dashboard
Follow the steps given below.
- Open a terminal and navigate to the
<MI-DASHBOARD_HOME>/binfolder. -
Execute one of the commands given below.
./dashboard.shdashboard.bat
Step 4 - Start the MI servers
Follow the steps given below.
- Open a terminal and navigate to the
<MI_HOME>/binfolder. -
Execute one of the commands given below.
./micro-integrator.shmicro-integrator.bat
Step 5 - Sign in to the Dashboard
Once you have set up and started the dashboard, you can access the dashboard URL.
Before you begin
Be sure to have at least one Micro Integrator server connected to the dashboard before attempting to sign in to it. This can be verified by checking the presence of the following log.
New node <node_id> in group : <group_id> is registered. Inserting heartbeat information-
Copy the following dashboard URL to your browser:
https://localhost:9743/login -
Enter the following details to sign in.
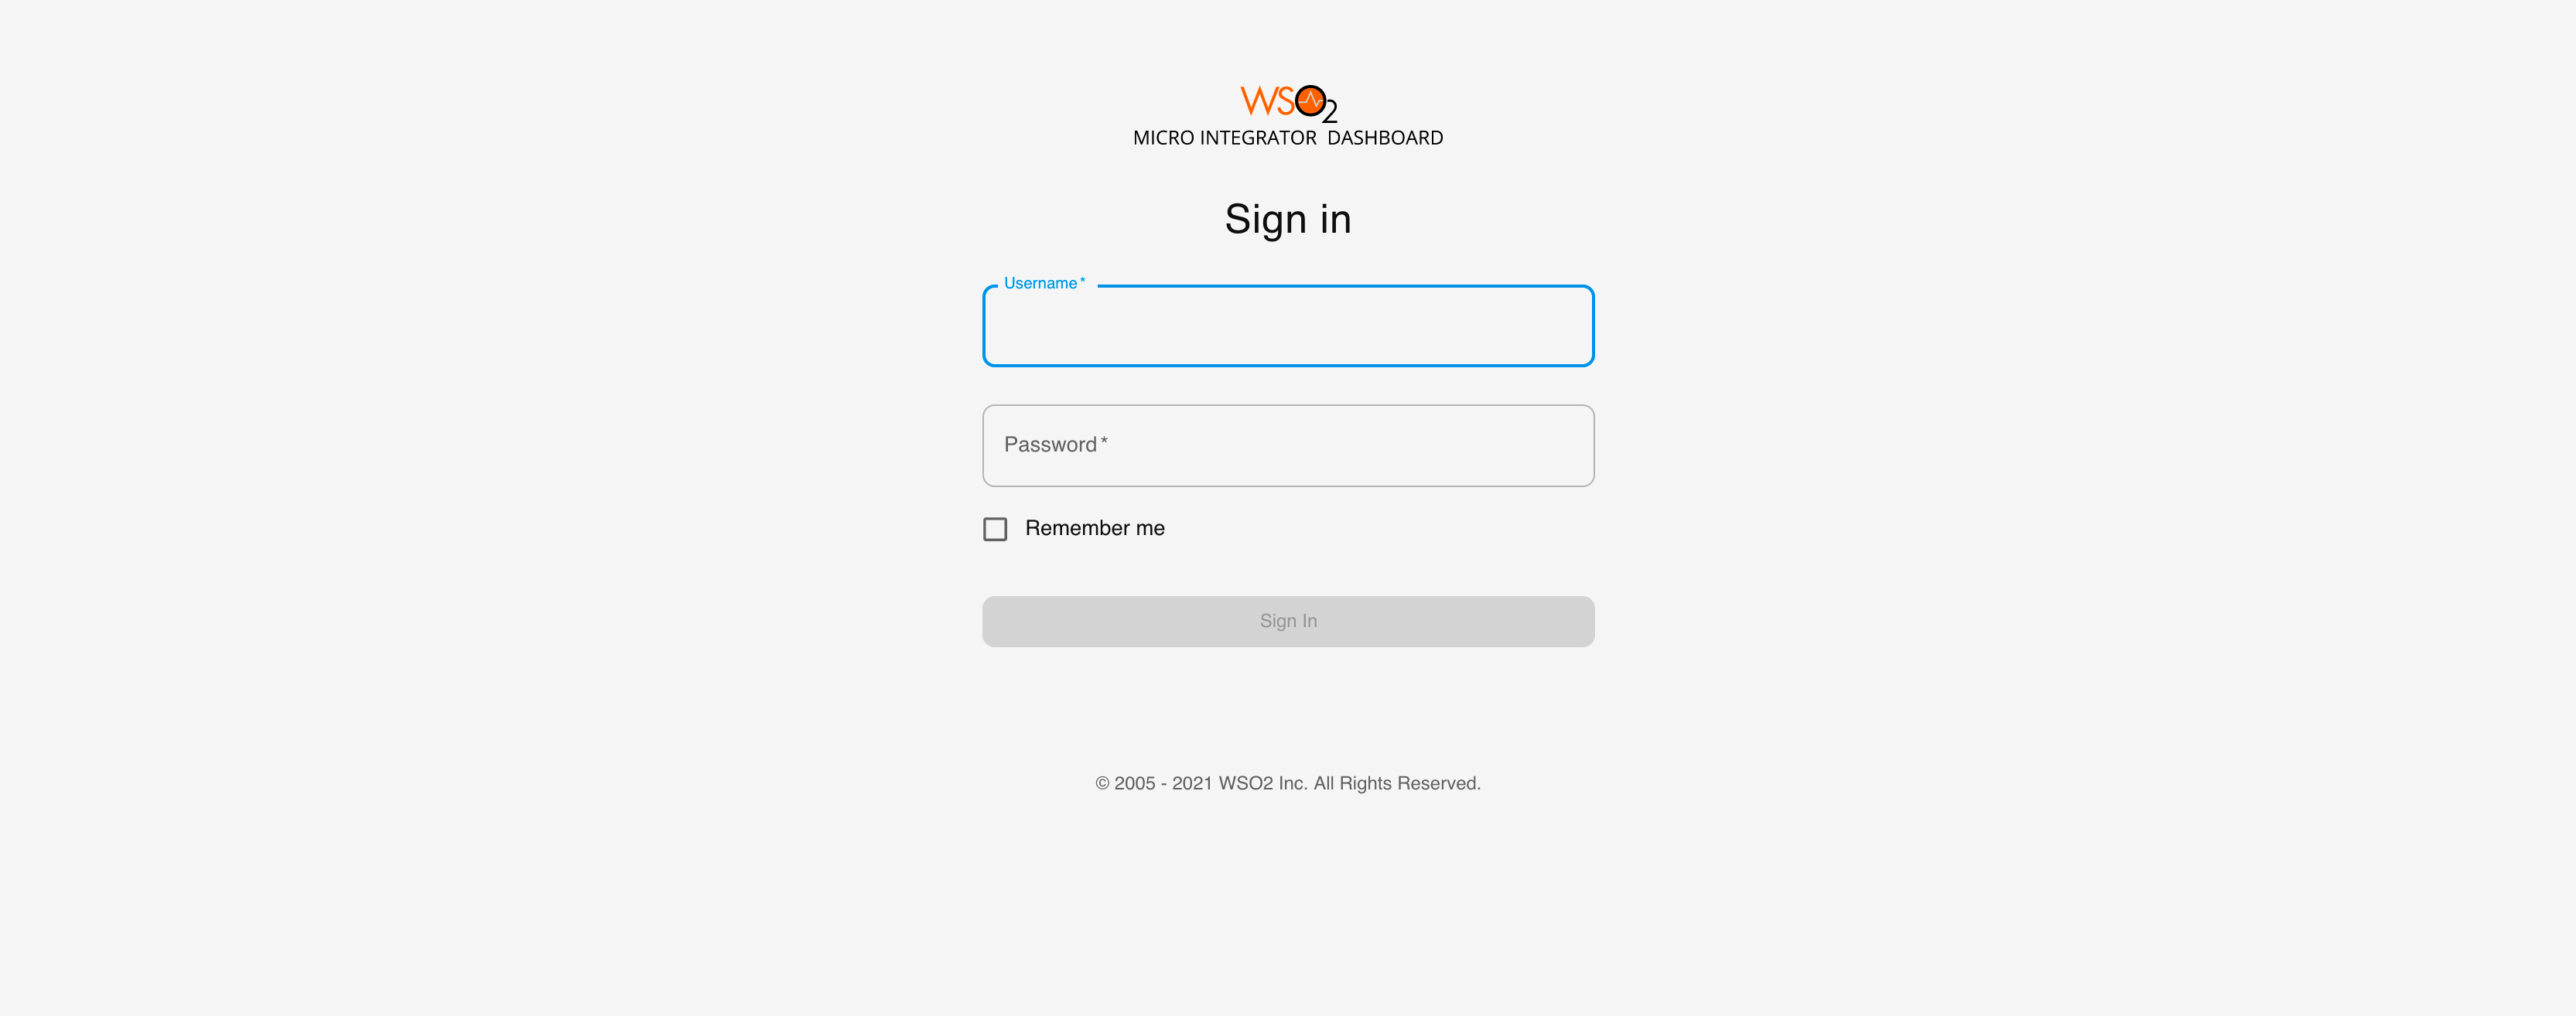
Username The user name to sign in. Note: This should be a valid username that is saved in the Micro Integrator server's user store. By default, the 'admin' user name is configured in the default user store. See configuring user stores for information. Password The password of the user name. By default, 'admin' is the user name and password. -
Click Sign In.
You are redirected to the home page of the Micro Integrator dashboard.
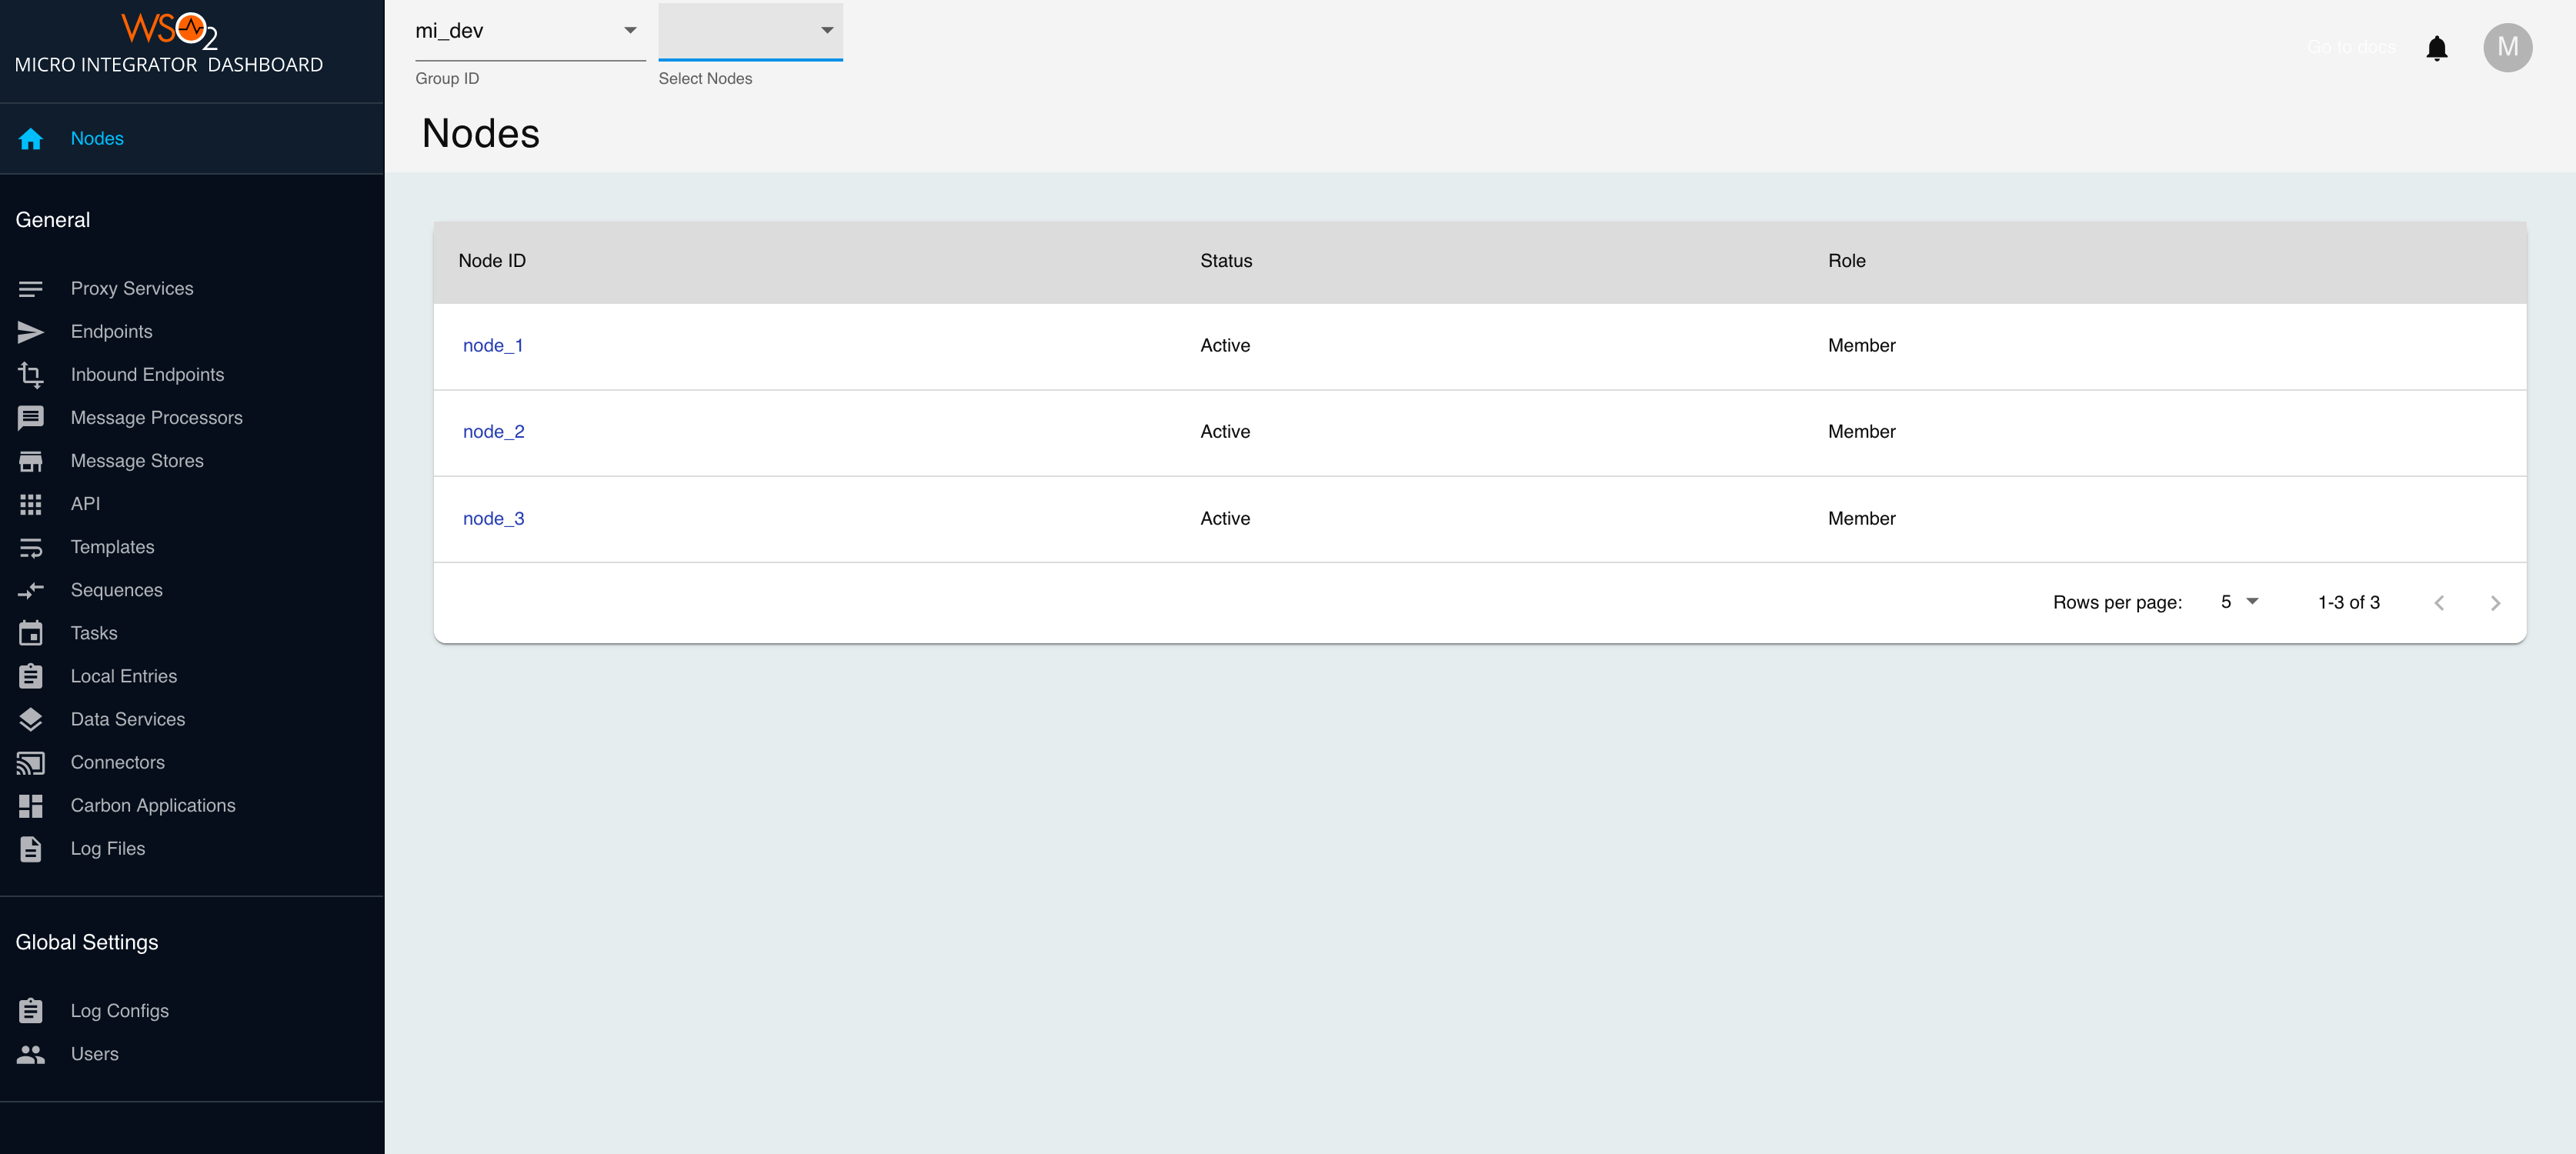
Step 6 - Monitor MI artifacts and logs
Follow the steps given below.
-
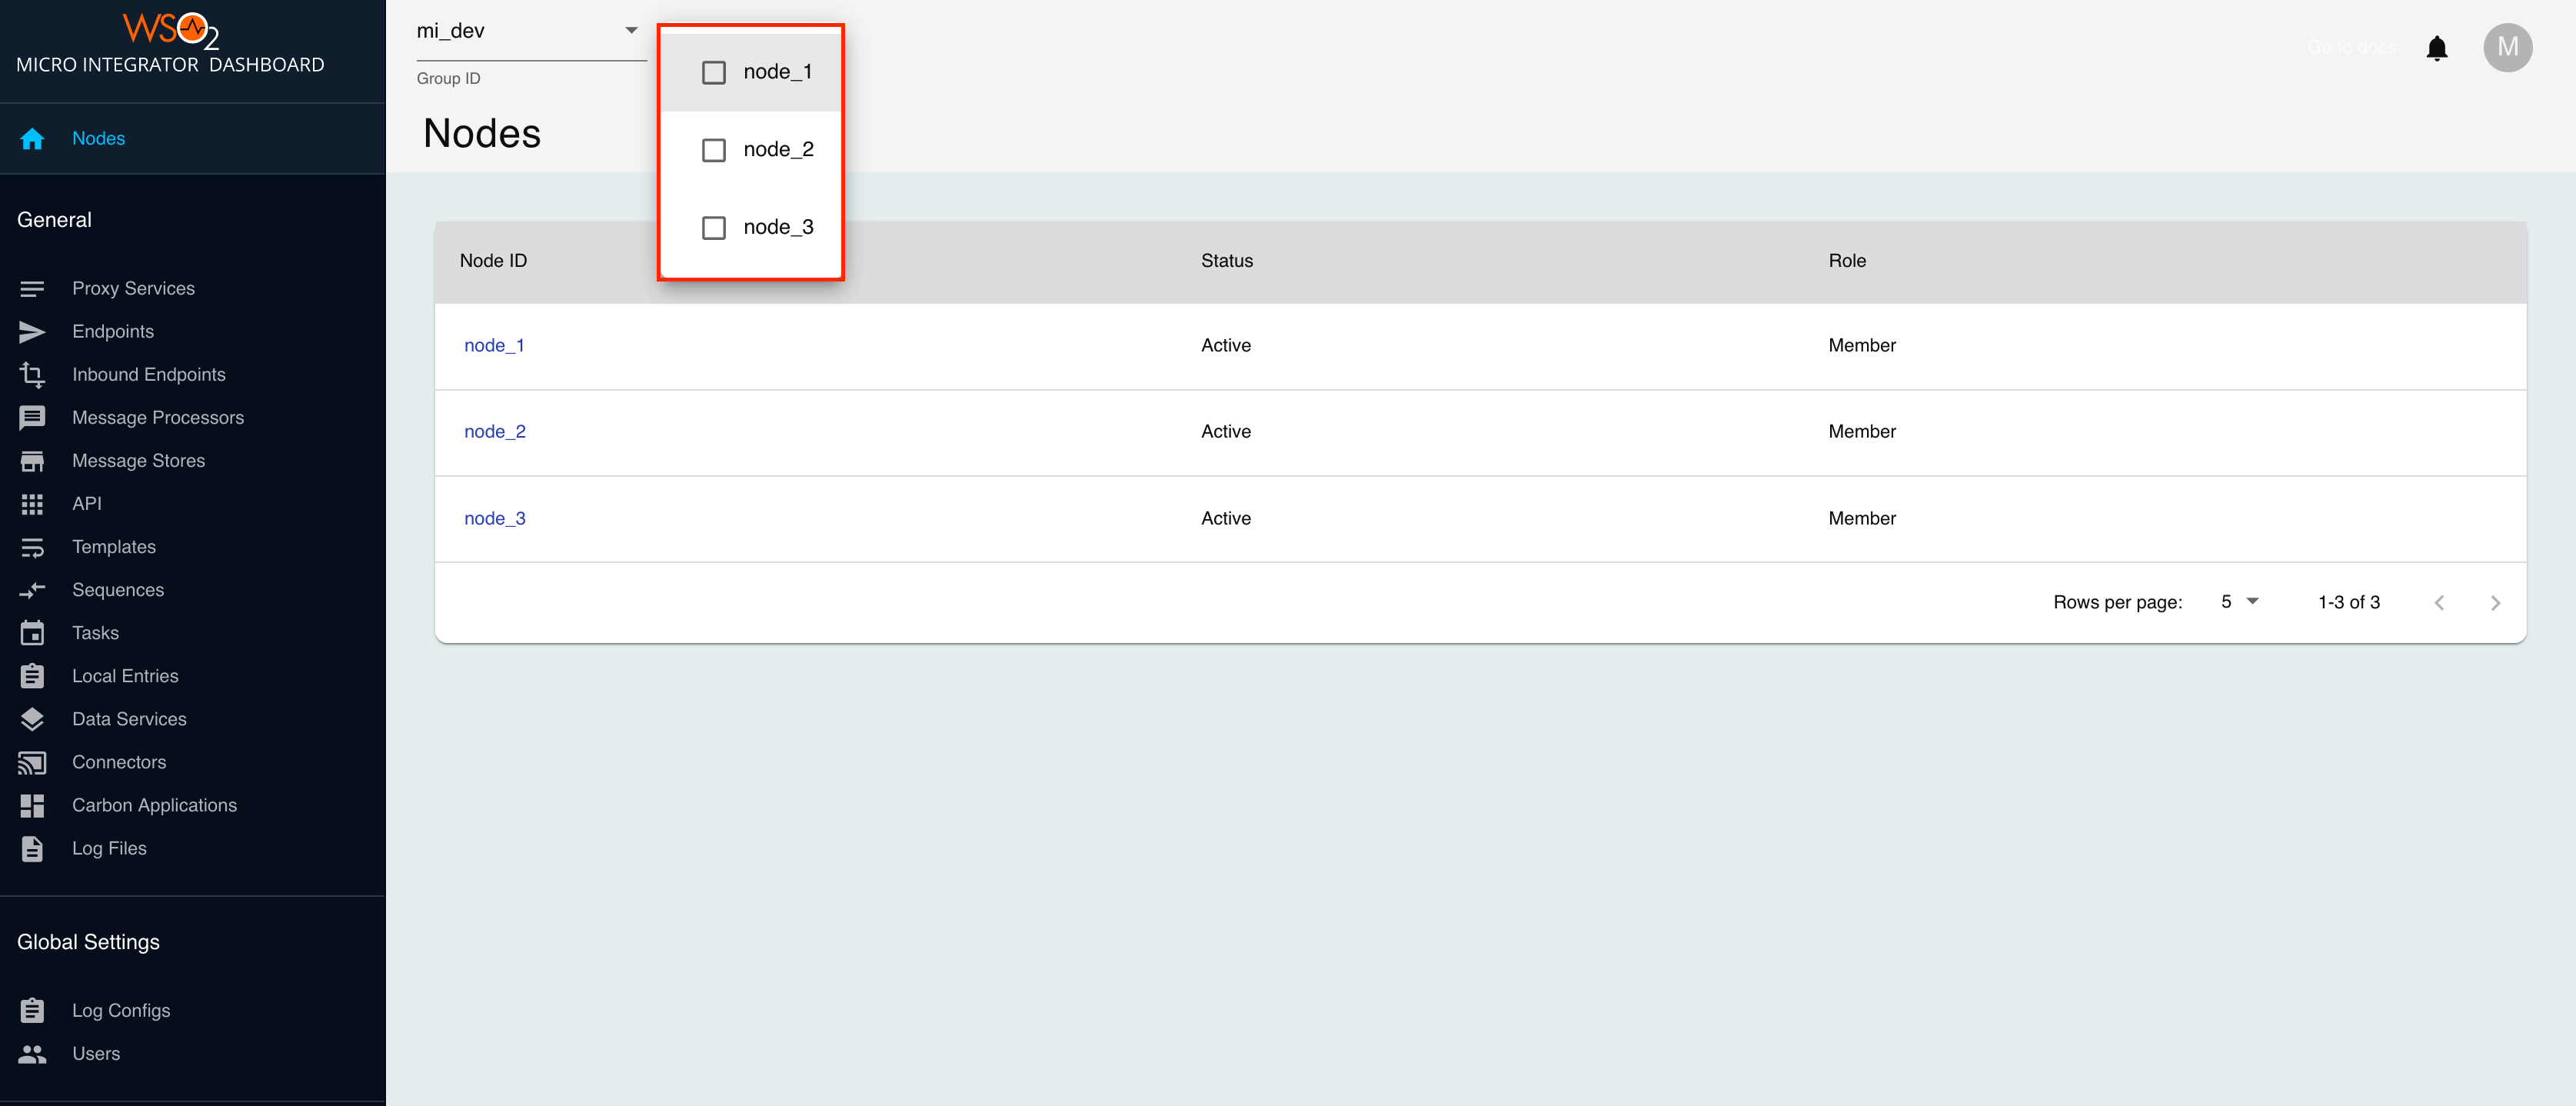
Select the group ID that you want to view from the upper left menu.
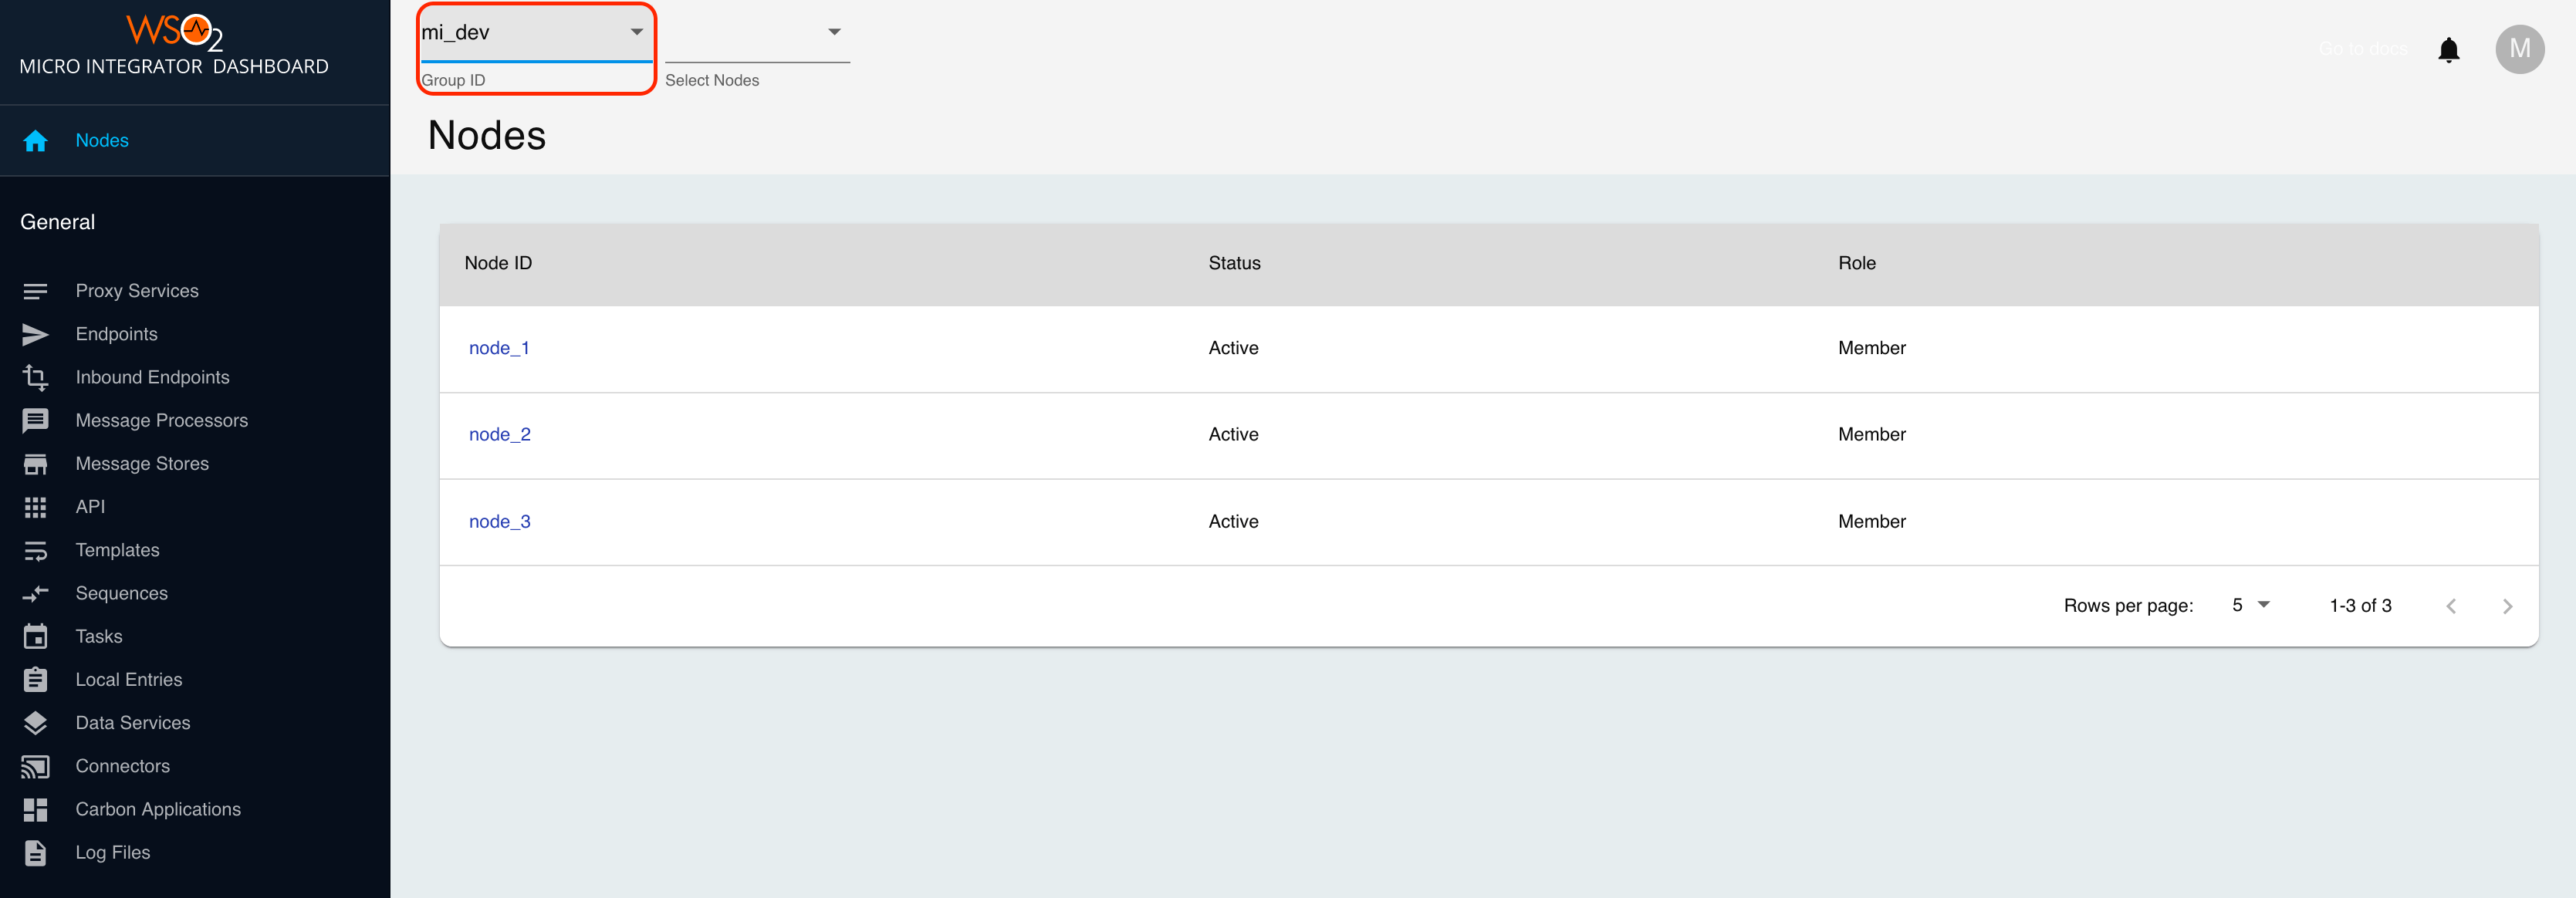
You can see the list of server nodes in each group, as shown in the above diagram.
-
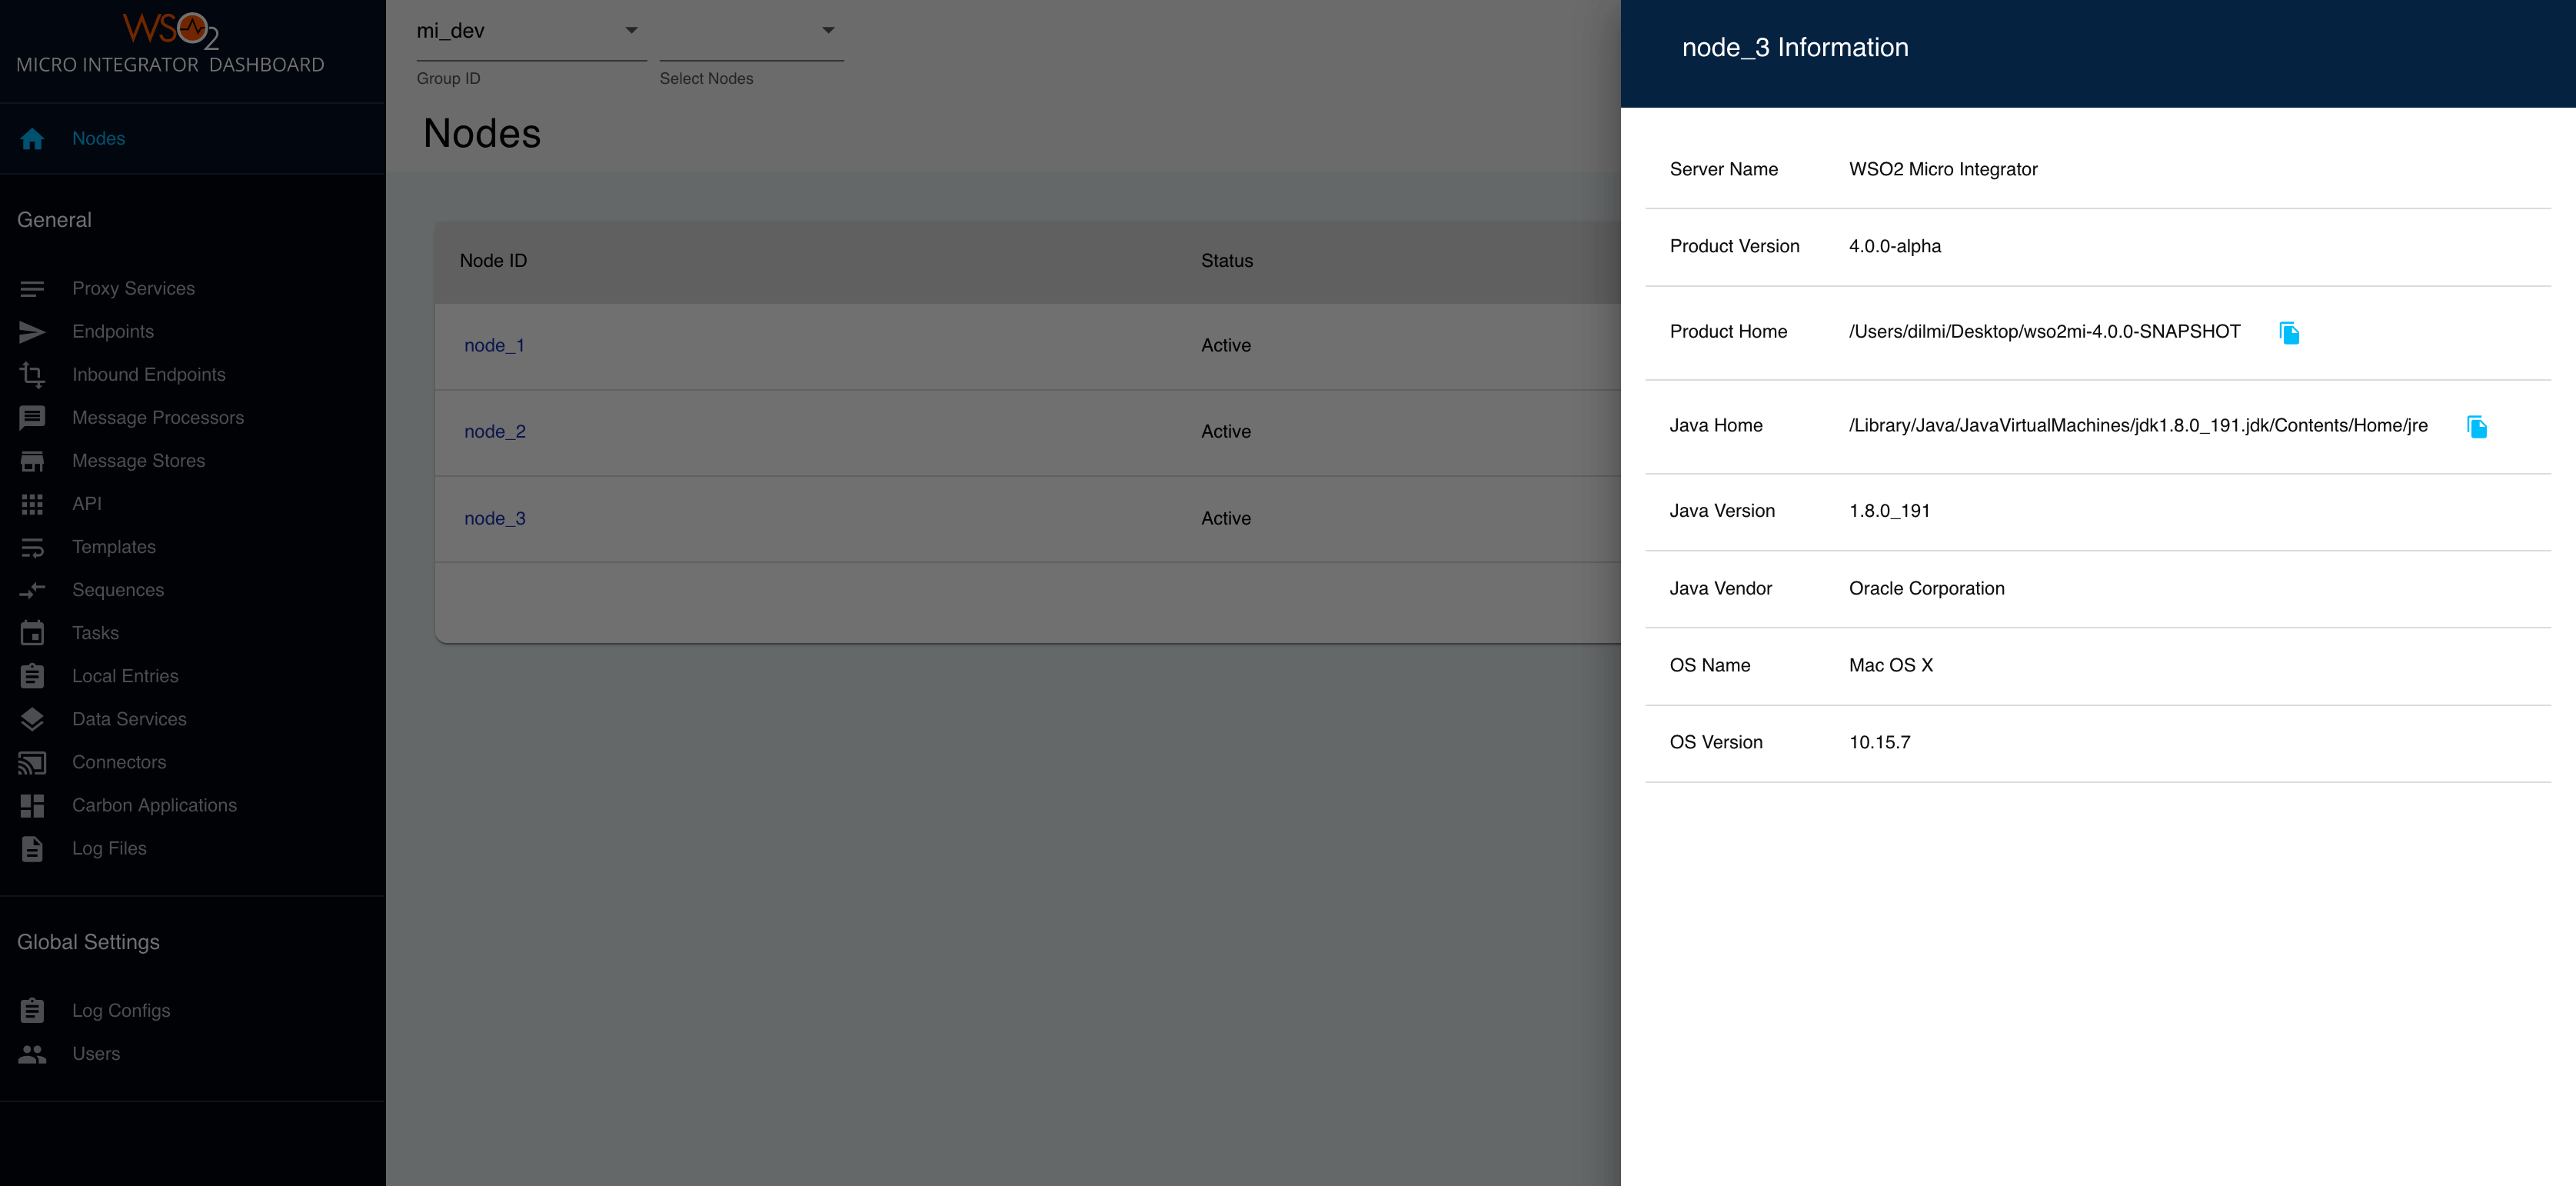
Click a node ID, and a side navigational panel opens to display the server information.
-
Select the set of nodes you want to monitor, as shown in the below figure.
Now you can view details of artifacts, update artifacts, and perform various other administration tasks. Select the required option from the left-hand navigator.