Performance Test Results
The performance tests were conducted for streaming APIs of WSO2 API Manager. Tests were conducted for the three protocols listed below and the subsequent sections present the results and key observations.
- Server Sent Event APIs (SSE)
- WebSub / WebHook APIs
- WebSocket APIs
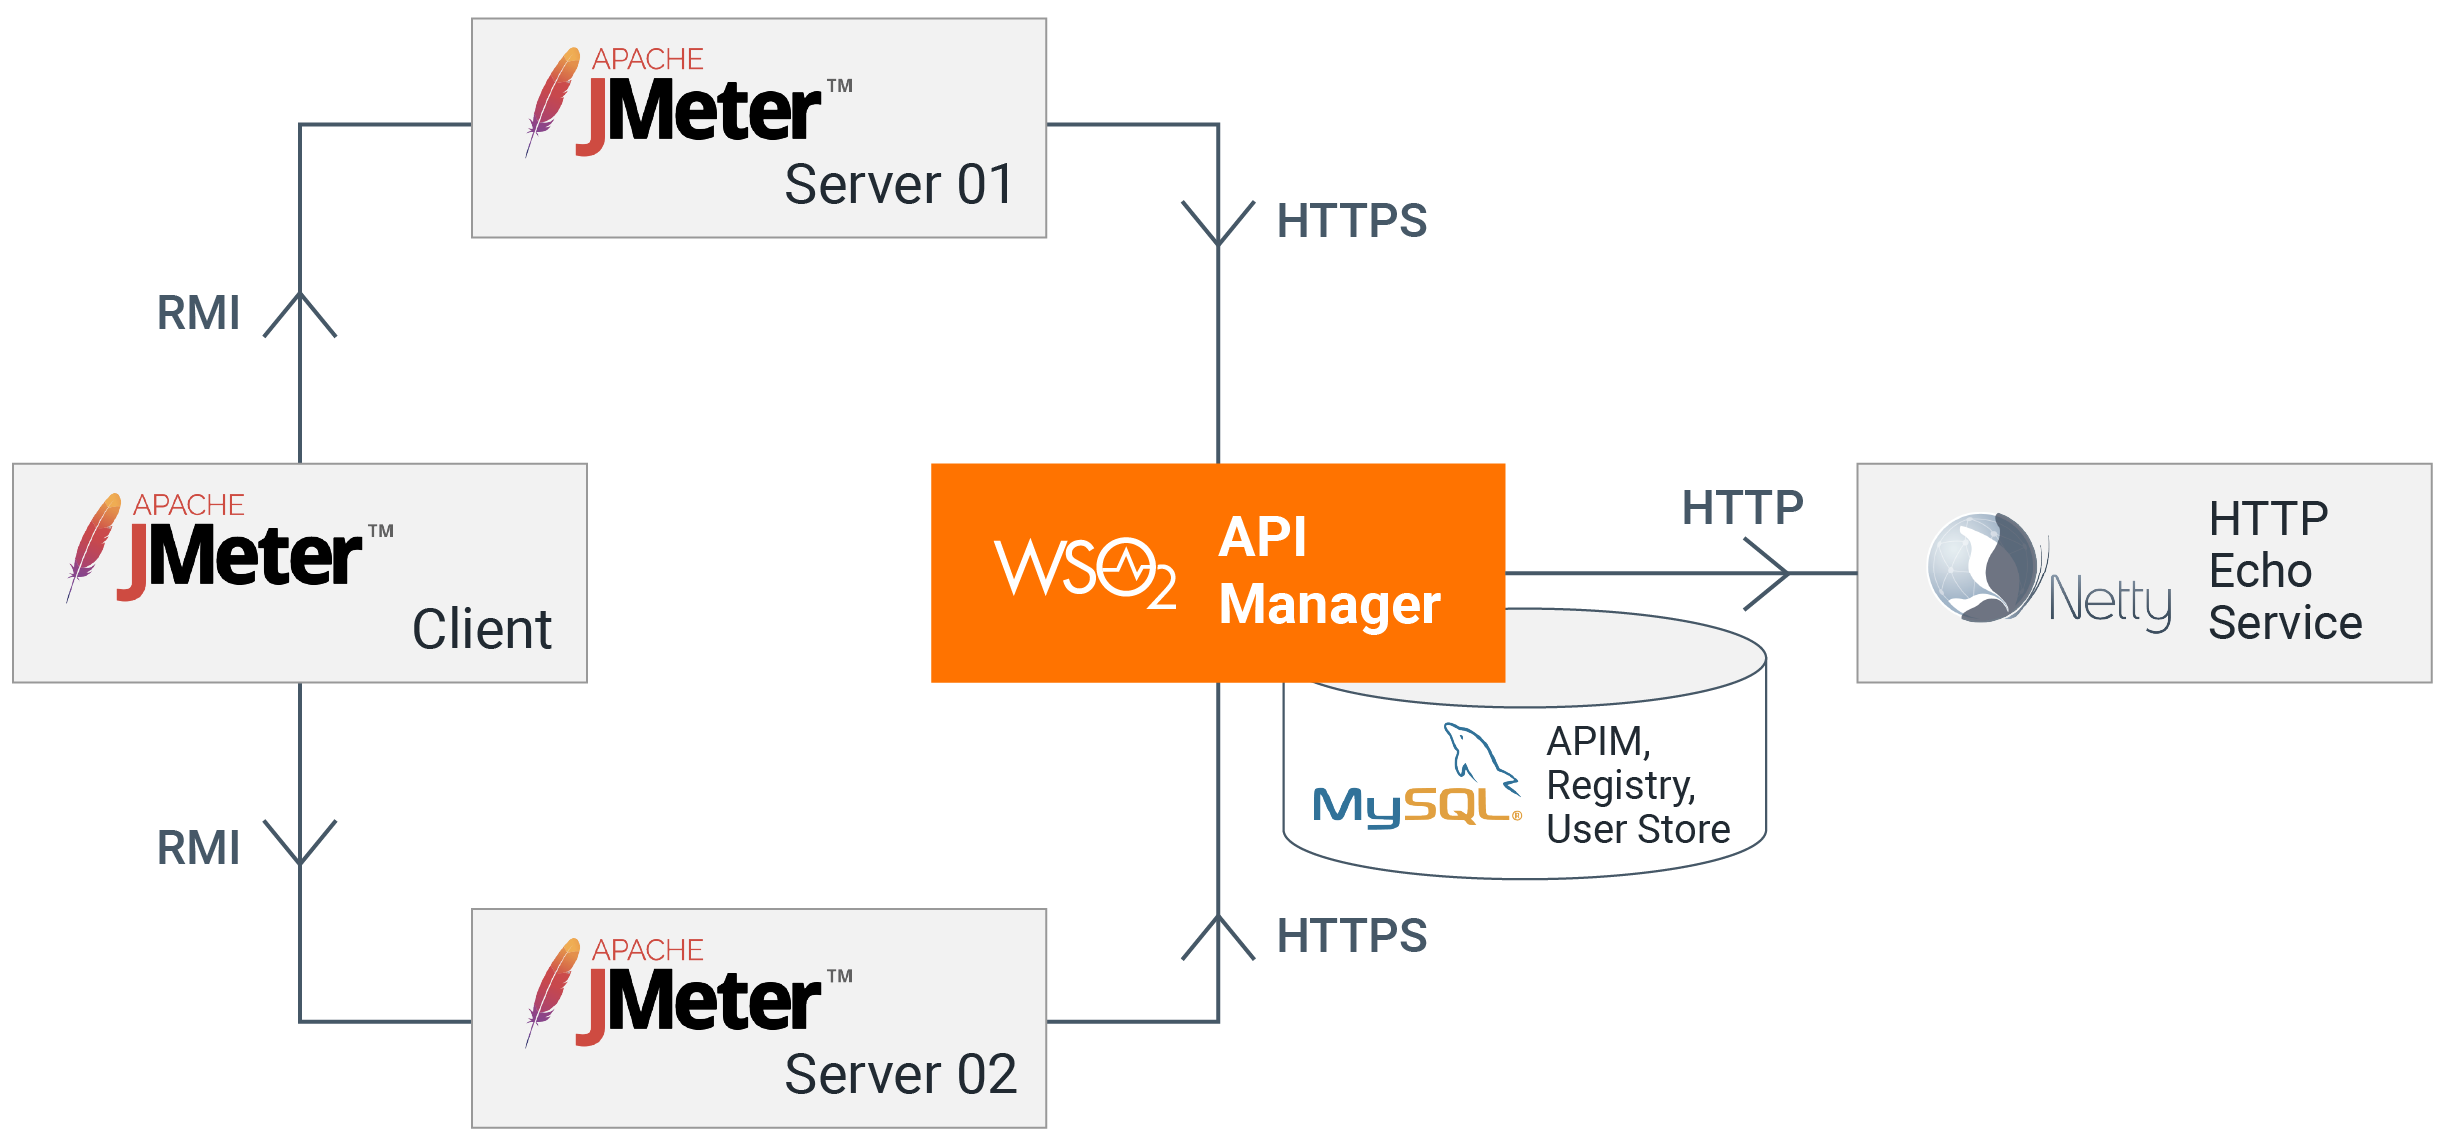
Deployment used for the test
| Name | EC2 Instance Type | vCPU | Mem(GiB) |
|---|---|---|---|
| Apache JMeter Client | c5.large | 2 | 2 |
| Apache JMeter Server 01 | c5.xlarge | 4 | 4 |
| Apache JMeter Server 02 | c5.xlarge | 4 | 4 |
| MySQL | db.m5.large | 2 | 8 |
| Netty HTTP Backend | c5.xlarge | 4 | 4 |
| WSO2 API Manager | c5.large | 2 | 2 |
- Token type: JWT
- The operating system is Ubuntu 18.04
- MySQL version in RDS instance is 5.7
- Java version is JDK 11
Performance test scripts
All scripts used to run the performance tests and analyze results are in the following repositories.
Results
Server Sent Events
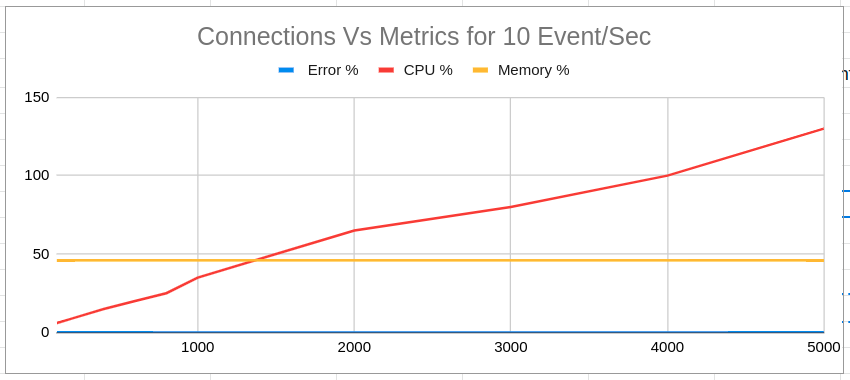
Test for SSE API was done by using an SSE back end which emitted events in different frequencies. The error rate with concurrent users and the CPU and memory percentage consumed was recorded at that time.
The following graph depicts the Error %, CPU % and Memory % variation in the server during the time in which the request was processed.
Key observations:
-
Five thousand (5000) concurrent connections can be handled with zero errors, with an event rate of 10 Event/sec (Average size of an Event used was 82B)
-
CPU spike is expected during the processing time, however it will settle once the requests are served.
WebSub
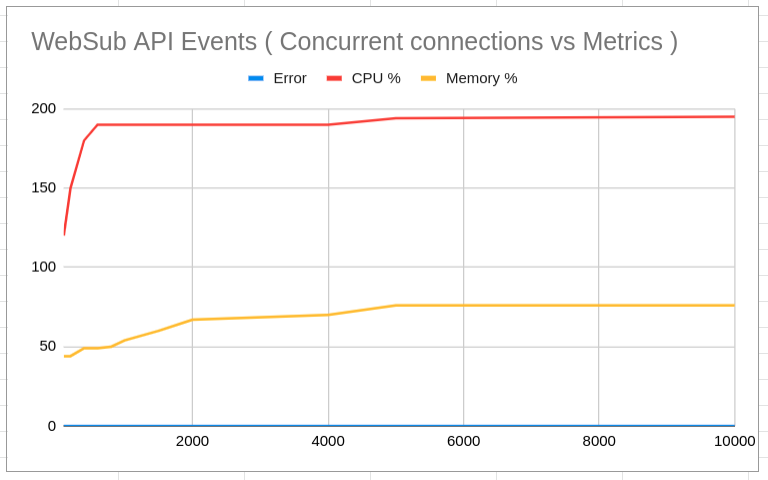
Test for WebSub API was done for varying number of subscribers and measuring the associated error, CPU and Memory % consumed.
The following graph depicts the variation of Error, CPU and Memory % with concurrent users.
Key observations:
-
10,000 subscribers can be handled with zero error rate serving a payload of average size of 8kB.
-
CPU spike is expected during the processing time as higher number of requests are server simultaneously, however this will settle when the events are delivered.
Note
10,000 concurrent users mean a lot, and it is not very common. It is recommended to scale horizontally or vertically to support more concurrent users with acceptable response times. When scaling horizontally, two or more Gateway nodes need to be used with a load balancer. Another load test must be carried out to measure the performance after scaling.
WebSocket
Test for WebSocket API was done using a WebSocket server, which sends back the reversed message received from the client. The ramp up period, error rate, concurrent connections, and CPU and memory usages were recorded during that time.
The following graph depicts the ramp up period with error rate.
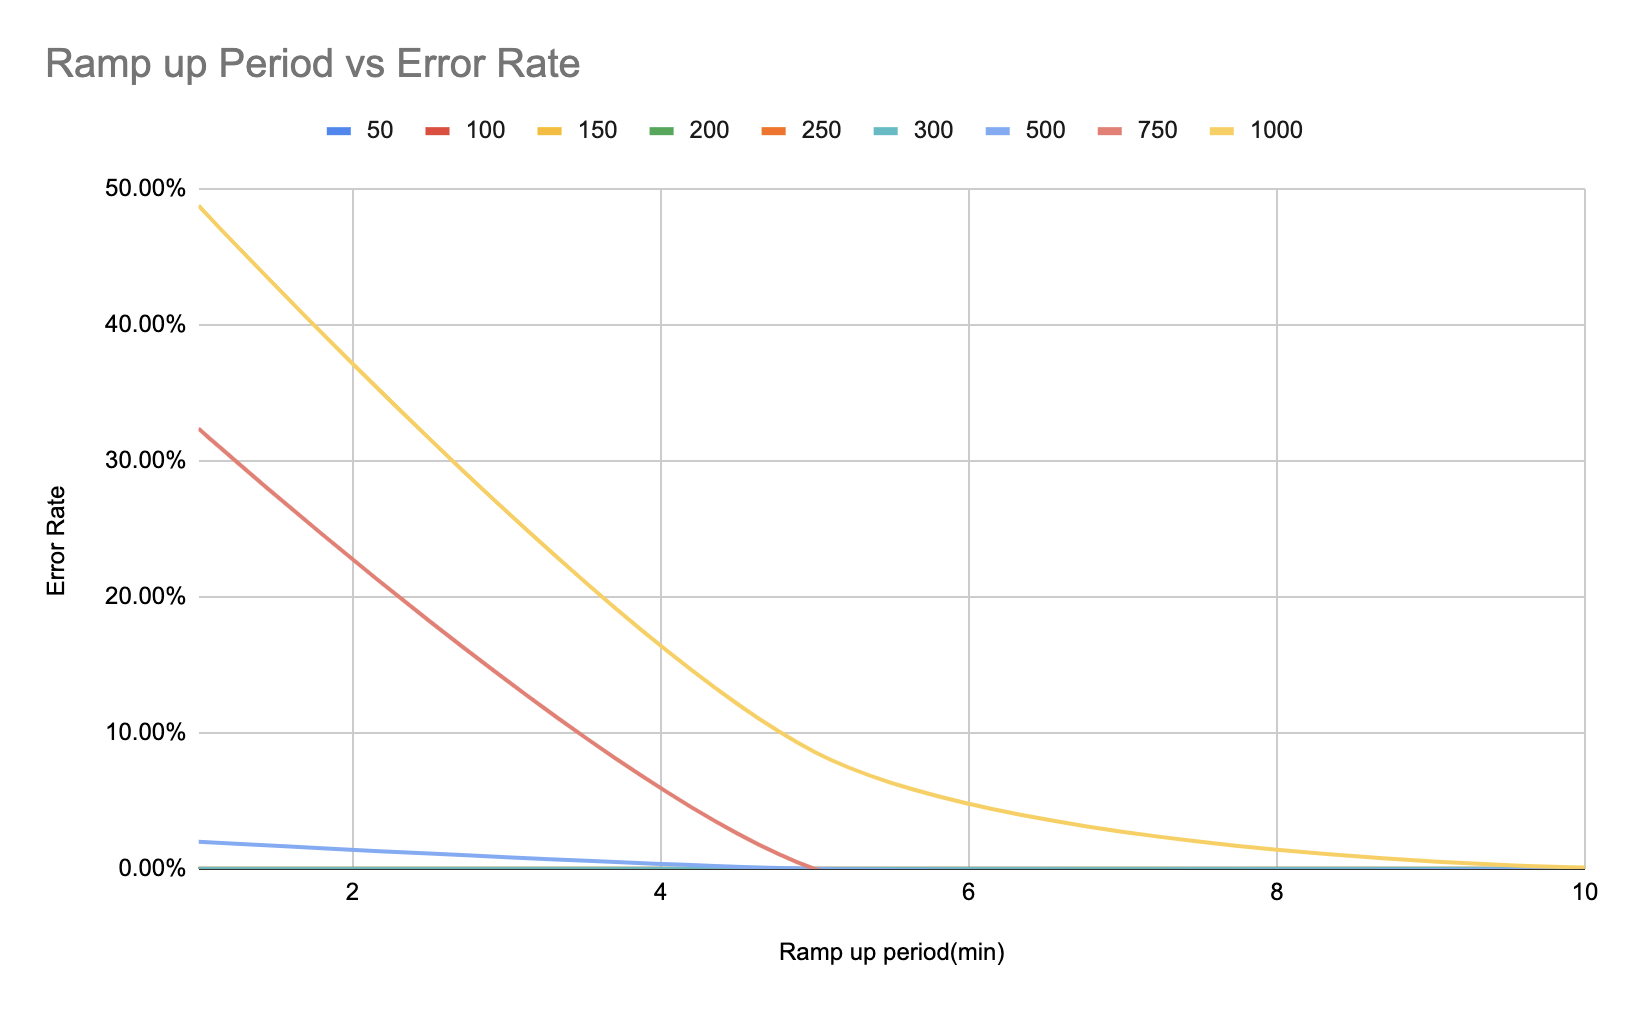
The following table shows the number of concurrent connections with error rate. A 500 bytes string payload was used as the message. Size of the payload was reduced when non-zero error rates were observed without any failed connections.
| Events/second | Message Size | Attempted Concurrent Connections | Failed Connections | Error Rate |
|---|---|---|---|---|
| 1 | 500 bytes | 100 | 0 | 0% |
| 200 | 0 | 0% | ||
| 300 | 0 | 0% | ||
| 400 | 0 | 0% | ||
| 600 | 48 | 0% | ||
| 800 | 78 | 0% | ||
| 1000 | 74 | 0% | ||
| 5 | 500 bytes | 100 | 0 | 0% |
| 200 | 0 | 0% | ||
| 300 | 0 | 0% | ||
| 400 | 0 | 0% | ||
| 600 | 42 | 32.90% | ||
| 800 | 64 | 65.25% | ||
| 1000 | 62 | 70.14% | ||
| 10 | 500 bytes | 100 | 0 | 0% |
| 200 | 0 | 0% | ||
| 300 | 0 | 46.10% | ||
| 250 bytes | 300 | 0 | 14.29% | |
| 125 bytes | 300 | 0 | 12.70% | |
| 60 bytes | 300 | 0 | 29.12% | |
| 400 | 4 | 62.17% | ||
| 600 | 56 | 85.14% |
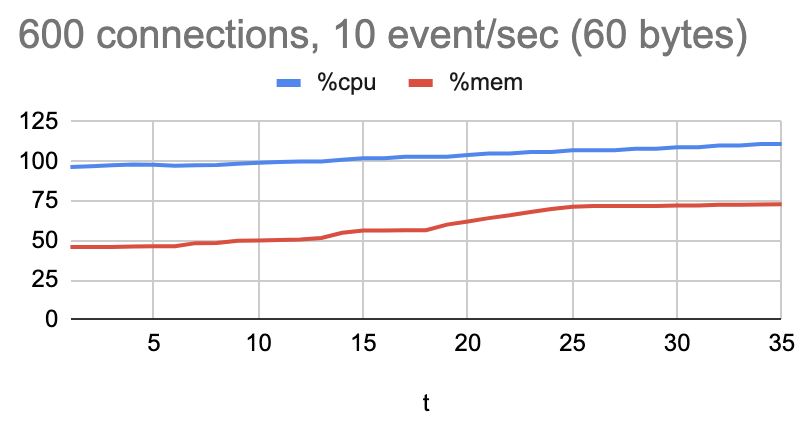
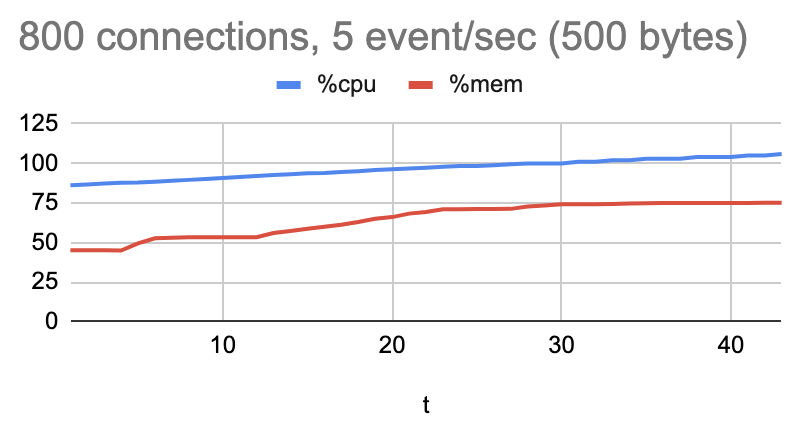
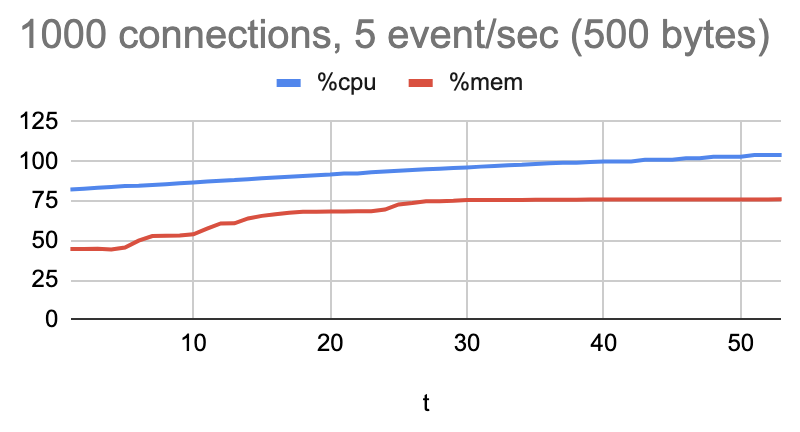
Key observations:
- 400 concurrent connections can be made with zero error rate and without any failed connections, at five events per second.
- 200 concurrent connections can be made with zero error rate and without any failed connections, at ten events per second.
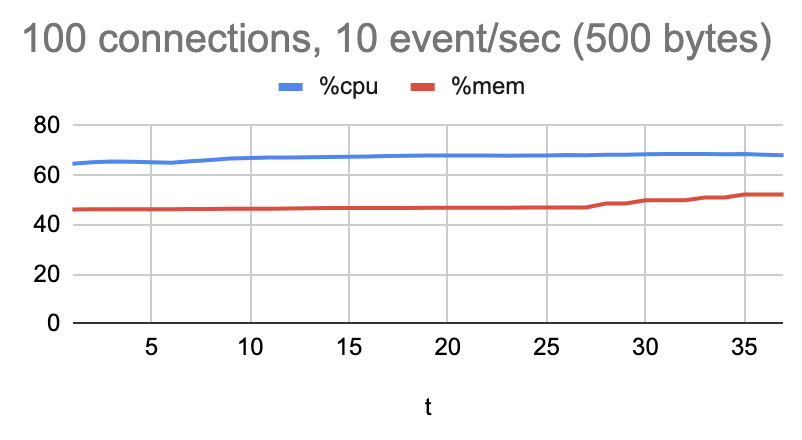
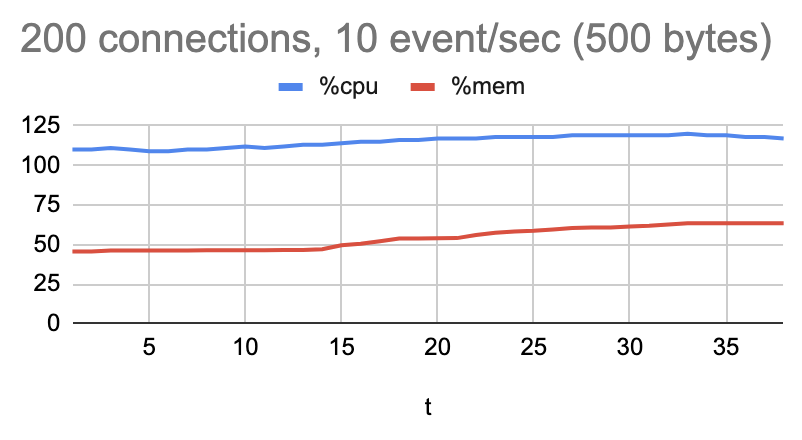
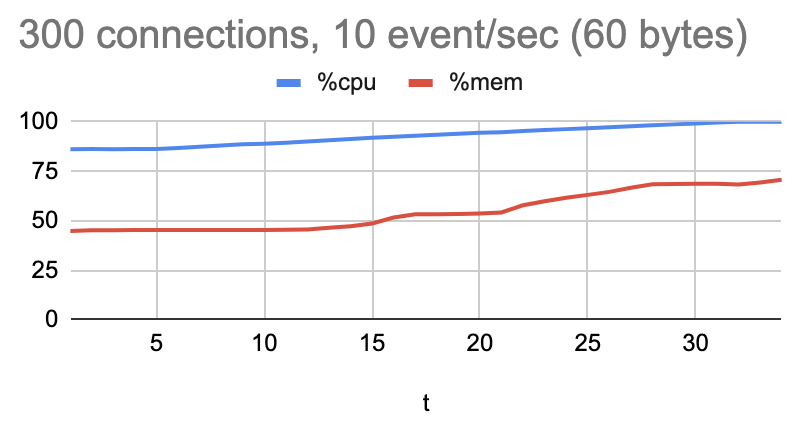
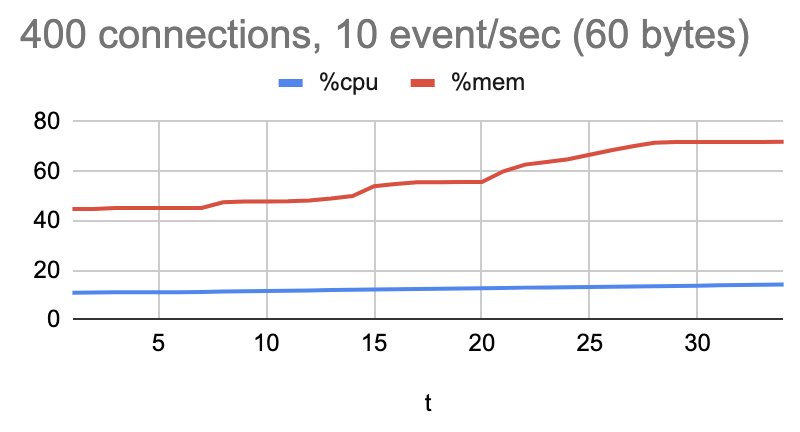
The following graphs depict the variation of CPU and Memory % with concurrent connections.