Monitoring with OpenTracing
In a distributed API Manager architecture, tracing a message is important to debug and observe a message path. This is known as distributed tracing. OpenTracing allows you to enable distributed tracing for WSO2 API Manager. OpenTracing aims to be an open, vendor-neutral standard for distributed systems instrumentation. It offers a way for developers to follow the thread — to trace requests from beginning to end across touchpoints and understand distributed systems at scale. OpenTracing will also help to trace the message and identify the latencies that took place in each process or method. Thereby, OpenTracing will help you to carry out a time-related analysis.
WSO2 API Manager supports the following types of ways to retrieve instrumented data.
- Jaeger
- Zipkin
- Log
For more information, see OpenTracer Configurations.
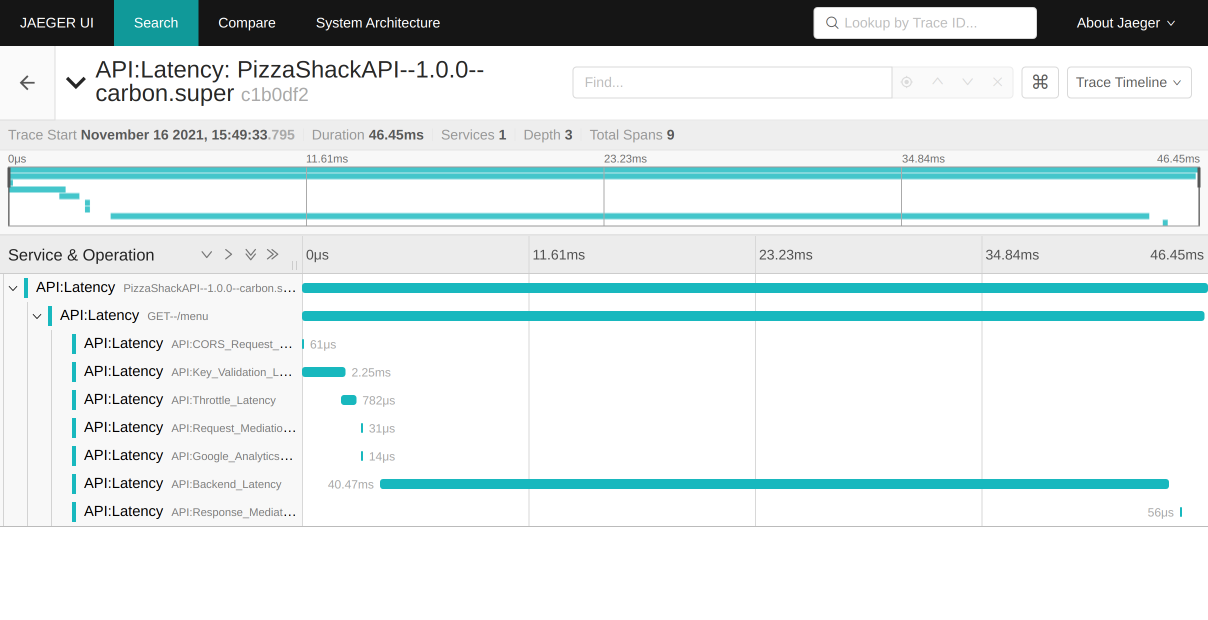
Enabling Jaeger Tracing
-
Copy the following configuration into the
deployment.tomlfile.[apim.open_tracer] remote_tracer.enable = true remote_tracer.name = "jaeger" remote_tracer.properties.hostname = "<hostname-of-jaeger-endpoint>" remote_tracer.properties.port = "<port-of-jaeger-endpoint>"[apim.open_tracer] remote_tracer.enable = true remote_tracer.name = "jaeger" remote_tracer.properties.hostname = "localhost" remote_tracer.properties.port = "6831" #6832 can also be used as the port -
Start the server.
After you invoke the APIs you will see the tracing data in Jaeger as follow:
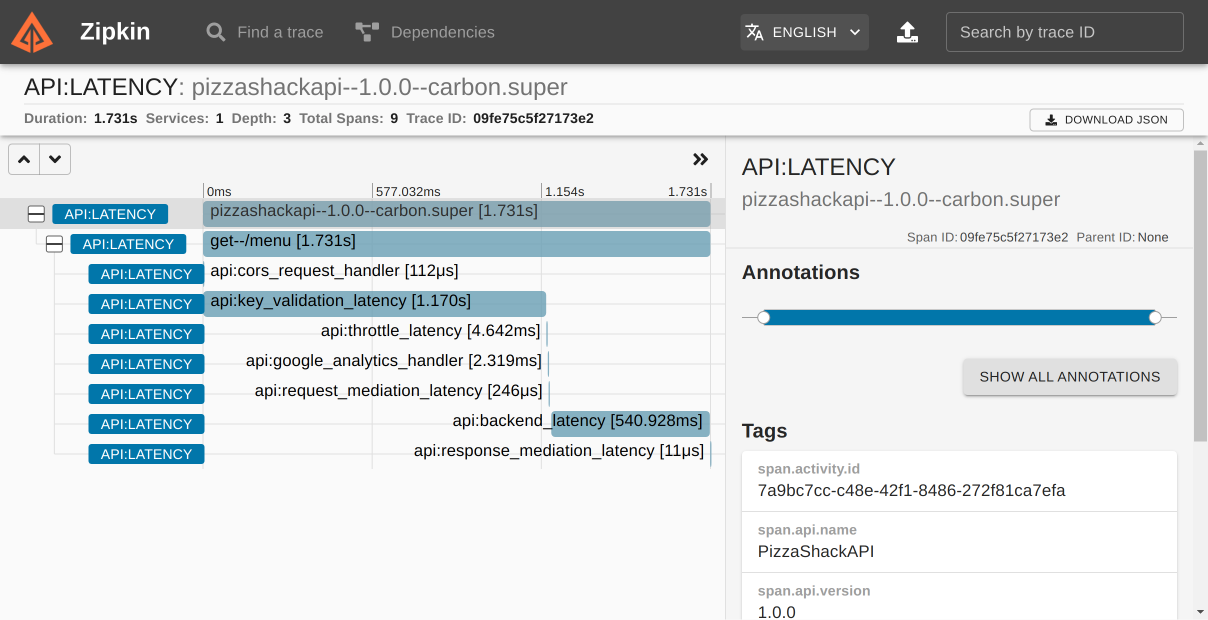
Enabling Zipkin Tracing
-
Copy the following configuration into the
deployment.tomlfile.[apim.open_tracer] remote_tracer.enable = true remote_tracer.name = "zipkin" remote_tracer.properties.hostname = "<hostname-of-zikin-endpoint>" remote_tracer.properties.port = "<port-o-zipkin-endpoint>"[apim.open_tracer] remote_tracer.enable = true remote_tracer.name = "zipkin" remote_tracer.properties.hostname = "localhost" remote_tracer.properties.port = "9411" -
Start the server.
After you invoke the APIs you will see the tracing data in Zipkin as follow:
Enabling Log Tracing
-
Copy the following configuration into the
deployment.tomlfile.[apim.open_tracer] remote_tracer.enable = false log_tracer.enable = true -
Start the server.
After you invoke the APIs you will be able to see tracing data in the
wso2-apimgt-open-tracing.login the<API-M_HOME>/repository/logsfolder.20:19:46,937 [-] [PassThroughMessageProcessor-14] TRACE {"Latency":0,"Operation":"API:CORS_Request_Handler","Tags":{}} 20:19:46,938 [-] [PassThroughMessageProcessor-14] TRACE {"Latency":0,"Operation":"API:Get_Client_Domain()","Tags":{}} 20:19:46,939 [-] [PassThroughMessageProcessor-14] TRACE {"Latency":0,"Operation":"API:Find_matching_verb()","Tags":{}} 20:19:46,939 [-] [PassThroughMessageProcessor-14] TRACE {"Latency":1,"Operation":"API:Get_Resource_Authentication_Scheme()","Tags":{}} 20:19:46,956 [-] [https-jsse-nio-9443-exec-23] TRACE {"Latency":0,"Operation":"API:Get_Access_Token_Cache_key()","Tags":{}} 20:19:46,958 [-] [https-jsse-nio-9443-exec-23] TRACE {"Latency":0,"Operation":"API:Fetching_API_iNFO_DTO_FROM_CACHE()","Tags":{}} 20:19:46,959 [-] [https-jsse-nio-9443-exec-23] TRACE {"Latency":0,"Operation":"API:Validate_Token()","Tags":{}} 20:19:46,972 [-] [https-jsse-nio-9443-exec-23] TRACE {"Latency":12,"Operation":"API:Validate_Subscription()","Tags":{}} 20:19:46,973 [-] [https-jsse-nio-9443-exec-23] TRACE {"Latency":0,"Operation":"API:Validate_Scopes()","Tags":{}} 20:19:46,974 [-] [https-jsse-nio-9443-exec-23] TRACE {"Latency":0,"Operation":"API:Write_To_Key_Manager_Cache()","Tags":{}} 20:19:46,975 [-] [https-jsse-nio-9443-exec-23] TRACE {"Latency":0,"Operation":"API:Publishing_Key_Validation_Response","Tags":{}} 20:19:46,976 [-] [https-jsse-nio-9443-exec-23] TRACE {"Latency":20,"Operation":"API:Validate_Main","Tags":{}} 20:19:46,991 [-] [PassThroughMessageProcessor-14] TRACE {"Latency":51,"Operation":"API:Key_Validation_From_Gateway_Node","Tags":{}} 20:19:46,992 [-] [PassThroughMessageProcessor-14] TRACE {"Latency":52,"Operation":"API:Get_Key_Validation_Info()","Tags":{}} 20:19:46,993 [-] [PassThroughMessageProcessor-14] TRACE {"Latency":56,"Operation":"API:Key_Validation_Latency","Tags":{}} 20:19:46,994 [-] [PassThroughMessageProcessor-14] TRACE {"Latency":0,"Operation":"API:Throttle_Latency","Tags":{}} 20:19:46,995 [-] [PassThroughMessageProcessor-14] TRACE {"Latency":0,"Operation":"API:API_Mgt_Usage_Handler","Tags":{}} 20:19:46,996 [-] [PassThroughMessageProcessor-14] TRACE {"Latency":1,"Operation":"API:Google_Analytics_Handler","Tags":{}} 20:19:46,996 [-] [PassThroughMessageProcessor-14] TRACE {"Latency":0,"Operation":"API:Request_Mediation_Latency","Tags":{}} 20:19:47,016 [-] [PassThroughMessageProcessor-15] TRACE {"Latency":19,"Operation":"API:Backend_Latency","Tags":{"span.endpoint":"https://localhost:9443/am/sample/pizzashack/v1/api/"}} 20:19:47,017 [-] [PassThroughMessageProcessor-15] TRACE {"Latency":0,"Operation":"API:Response_Mediation_Latency","Tags":{}} 20:19:47,018 [-] [PassThroughMessageProcessor-15] TRACE {"Latency":0,"Operation":"API:API_MGT_Response_Handler","Tags":{}} 20:19:47,019 [-] [PassThroughMessageProcessor-15] TRACE {"Latency":83,"Operation":"API:Response_Latency","Tags":{"span.resource":"/menu","span.kind":"server","span.api.name":"PizzaShackAPI","span.consumerkey":"Fn9RGuFeefEe7W07jOq_mvQvLJwa","span.request.method":"GET","span.request.path":"pizzashack/1.0.0/menu","span.api.version":"1.0.0","span.activity.id":"urn:uuid:339f337a-8848-41ec-adba-73da367fa66e"}}
Using the Custom Tracer Implementation
You can use any tracing server with a custom tracer implementation in WSO2 API Manager to publish your tracing data. As an example, let's use the Elastic APM (Application Performance Monitoring), which is a tracing server, and let's implement a custom tracer in WSO2 API Manager for it using the instructions given below:
-
Implement the
org.wso2.carbon.apimgt.tracing.OpenTracerinterface and add your implementation. The getTracer method should contain the generation of theTracerinstance. Also, the getName method should return the tracer name to be configured in thedeployment.tomlfile. In this specific scenario let's name this tracerelastic. This tracer needs to be loaded as an osgi service using a module activator. The sample project for the elastic APM tracer can be downloaded from here. -
Build the Maven project and add the JAR file to the
dropinsdirectory. (<API-M_HOME>/repository/components/dropins) -
Add the following configuration into the
deployment.tomlfile.[apim.open_tracer] remote_tracer.enable = true remote_tracer.name = <custom_tracer_name>[apim.open_tracer] remote_tracer.enable = true remote_tracer.name = "elastic" -
Add the Elastic Opentracer JAR file in to the
libdirectory (<API-M_HOME>/repository/components/lib). You can download it from here.Tip
Elastic opentracing also requires the addition of a Java Agent. This can be added by altering the startup script. Make sure to check the documentation for the tracer you are using so that such requirements can be satisfied.
-
Start the server.
After you invoke the APIs, the tracing data will be published to the configured tracing server, which in this example is the Elastic APM.