Performance Test Results
The performance of WSO2 API Manager was measured using the following APIs, which invoke a simple “Netty HTTP Echo Service.” As the name suggests, the Netty service echoes back any request posted to the service.
- Echo API: This is a secured API, which directly invokes the back-end service.
- Mediation API: This is also a secured API, which has a “sequence” as a mediation extension to modify the message.
Tests were done using 100, 200, 300, 1000, and 2000 concurrent users. Concurrent Users mean that it consists of multiple users accessing the API Gateway at the same time. Different Message Sizes (Payloads) were used for the tests with different back-end service delays. The message sizes used are 50B, 1KiB, 10KiB, and 100KiB. The back-end delay was 0ms. Two key performance metrics were used to measure the performance of each test.
- Throughput: This measures the number of API invocations that the API Manager Gateway server processed during a specific time interval (e.g., per second).
- Response Time: This measures end-to-end processing time for an operation (of invoking an API using HTTPS protocol). The complete distribution of response times was recorded.
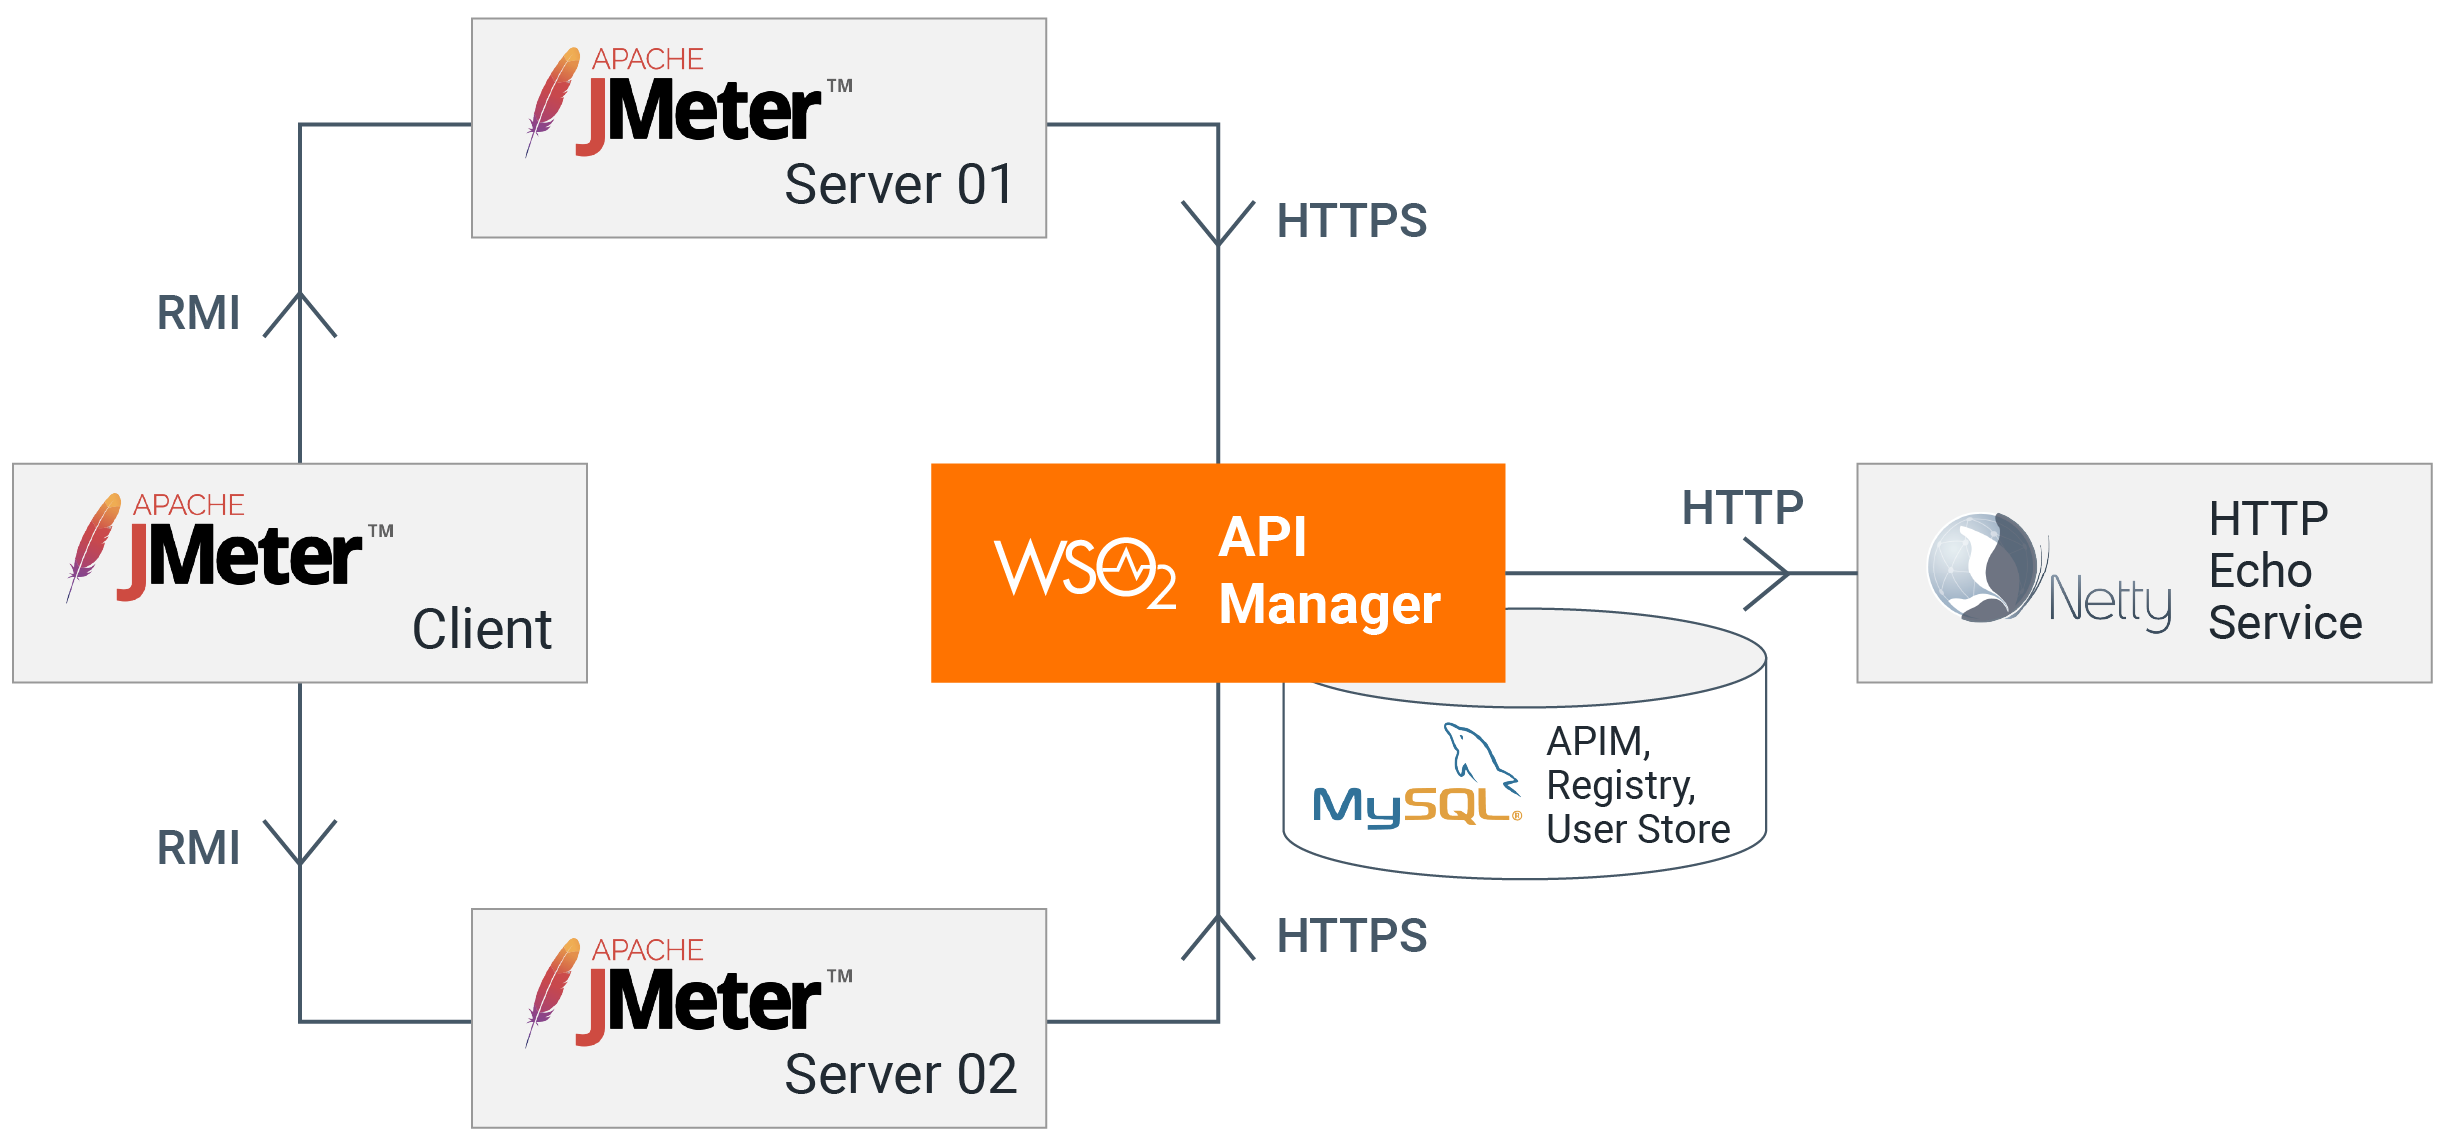
Deployment used for the test
| Name | EC2 Instance Type | vCPU | Mem(GiB) |
|---|---|---|---|
| Apache JMeter Client | c5.large | 2 | 2 |
| Apache JMeter Server 01 | c5.xlarge | 4 | 4 |
| Apache JMeter Server 02 | c5.xlarge | 4 | 4 |
| MySQL | db.m5.large | 2 | 8 |
| Netty HTTP Backend | c5.xlarge | 4 | 4 |
| WSO2 API Manager | c5.large | 2 | 2 |
- Token type: JWT
- The operating system is Ubuntu 18.04
- MySQL version in RDS instance is 5.7
- Java version is JDK 11
Performance test scripts
All scripts used to run the performance tests and analyze results are in the following repositories.
Results
Considering the fact that an average WSO2 API Manager user uses ~1KiB messages, the performance test highlights for that scenario are represented in the charts below. The complete results can be found here.
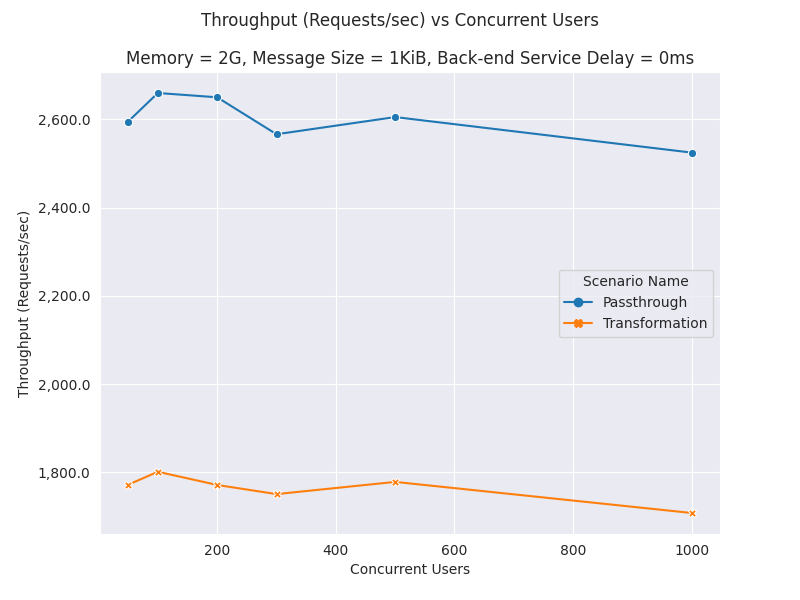
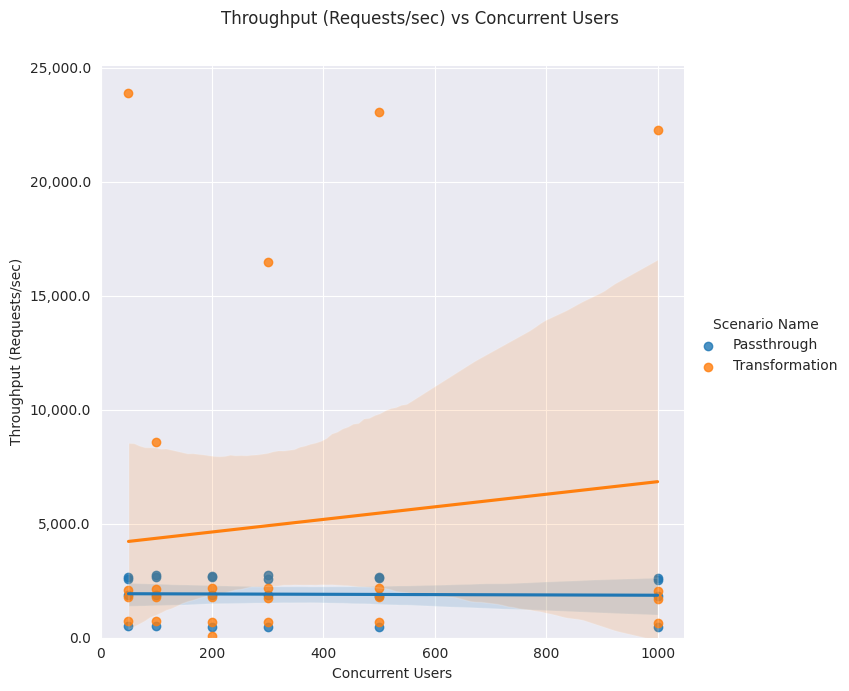
The following graph depicts the throughput changes based on the number of concurrent users.
Key observations:
-
More concurrent users mean more requests to the API Manager Gateway. Therefore, the throughput of the API Manager Gateway increases as the number of concurrent users accessing the APIs increases. The maximum throughput is obtained for 100 concurrent users for both “Echo API” and “Mediation API”, and the throughput degrades slightly after 100 concurrent users due to resource contentions in the system. The degradation point mainly depends on hardware resources.
-
Echo API throughput is much better than the Mediation API. The main reason is that the Mediation API has a mediation extension, which uses a “Payload Factory” Mediator. This mediation in the sequence does a JSON to JSON message transformation. That means the Mediation API reads the message (payload) to do the message transformation, and it has a considerable overhead than the “Echo API”, which is similar to a “Direct Proxy”. A “Direct Proxy” does not perform any processing on the messages that pass through it.
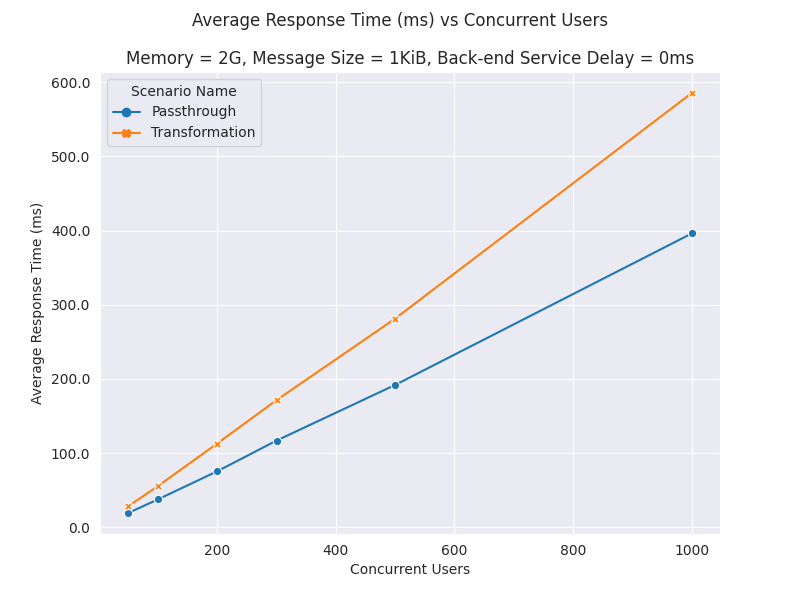
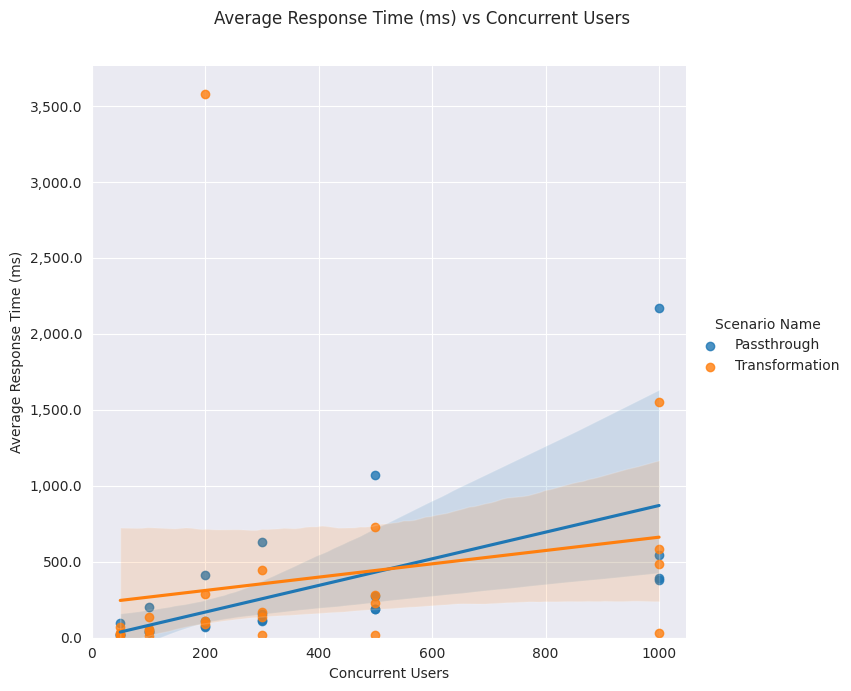
The following graph depicts the average response time changes based on the number of concurrent users.
Key observations:
-
The average response time increases with the number of concurrent users. As the number of requests to serve increases with more users, there are more resource contentions. Therefore, the number of concurrent users served by the API Gateway needs to be decided on the required response time limits. Again, the average response time also varies as the hardware resources change. For example, a user can achieve a lower response time if the number of CPUs allocated is increased.
-
The mediation API response times are higher than Echo API due to the performance overhead of the mediation extension.
Let’s look at the 90th, 95th, and 99th response time percentiles. It is useful to measure the percentage of requests that exceeded the response time value for a given percentile. A percentile can be used to determine the percentage of requests completed below the particular response time value.
For example, when there are 100 concurrent users, the 90th response time percentile for Echo API is 62ms. This means that 10% of the requests have taken more than 62ms to respond. Similarly, the 99th response time percentile for Echo API is 168ms, which means that 99% of the requests have been completed within 168ms.
The figure below represents the percentile values for Echo API (PassThrough Scenario).
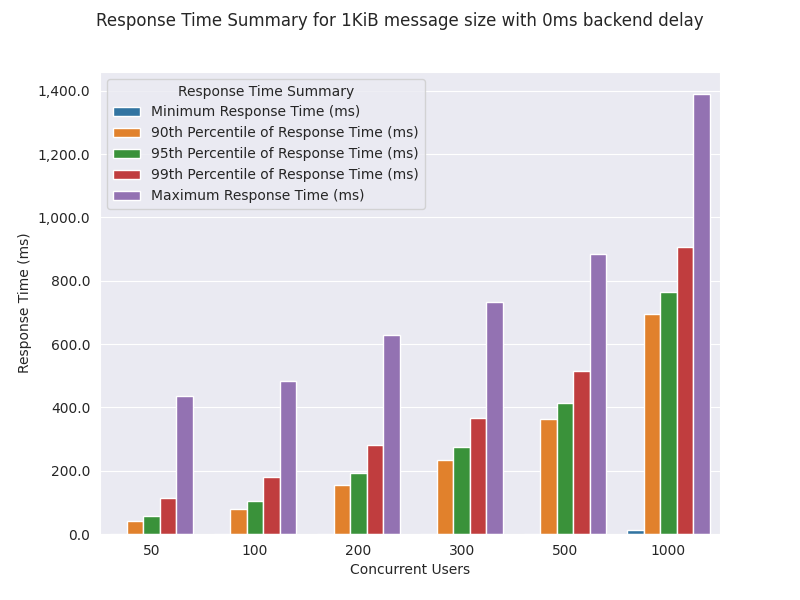
Key observations:
-
The Mediation API is slower than the Echo API due to the performance overhead of the mediation extension.
-
Response Times percentiles are less than 400ms up to 300 concurrent users for both APIs.
Note
1000 concurrent users mean a lot, and it is not very common. It is recommended to scale horizontally or vertically to support more concurrent users with acceptable response times. When scaling horizontally, two or more Gateway nodes need to be used with a load balancer. Another load test must be carried out to measure the performance after scaling.
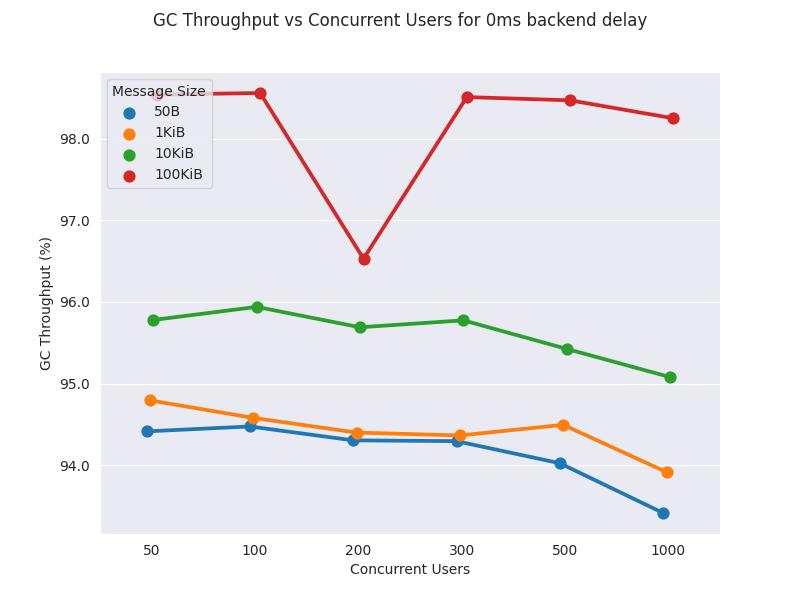
In order to see the memory usage, the Garbage Collection (GC) logs in the API Manager were enabled using the following flags.
-XX:+PrintGC -XX:+PrintGCDetails -XX:+PrintGCDateStamps -Xloggc:"$CARBON_HOME/repository/logs/gc.logIn addition, the GC log for each performance test was analyzed using the GCViewer. The GC Throughput was calculated for each test to check whether GC operations are not impacting the performance of the server. The GC Throughput is the time percentage of the application, which was not busy with GC operations. For example, if the application ran for 10 minutes and 30 seconds were taken for GC operations, the GC Throughput is (1 - 30/(10*60)) * 100 = 95%. A GC Throughput over 90% is good, and that means the allocated heap was enough to handle all concurrent requests, which allocate objects in the memory. On the contrary, if the GC throughput is a lower value, it indicates that the allocated memory is not enough for API Manager to function efficiently.
The following chart depicts the GC Throughput (%) based on the number of concurrent users for the PassThrough scenario (Echo API) for different payload sizes.
Comparison of results
Throughput comparison
Throughput (requests/sec) vs. concurrent users
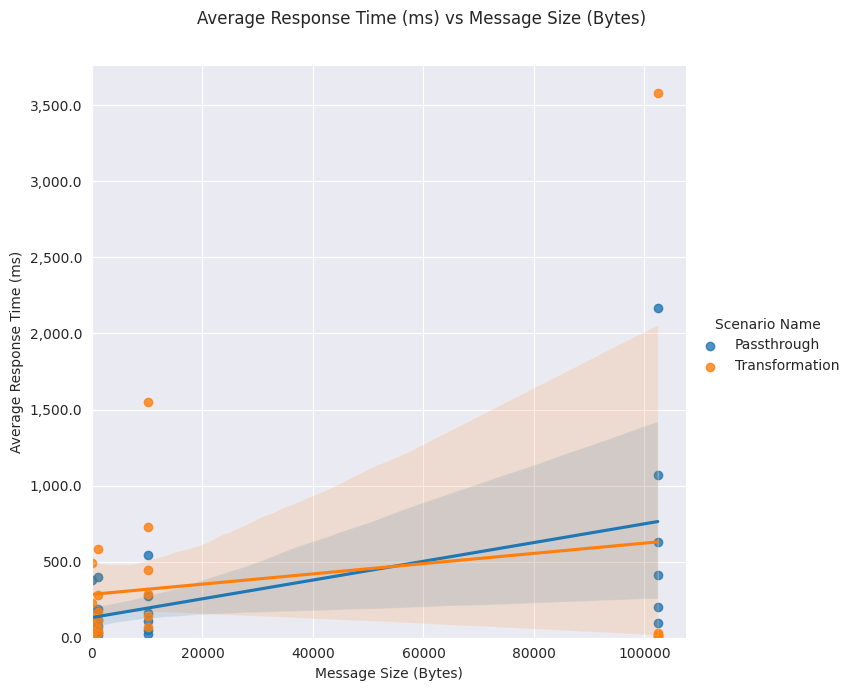
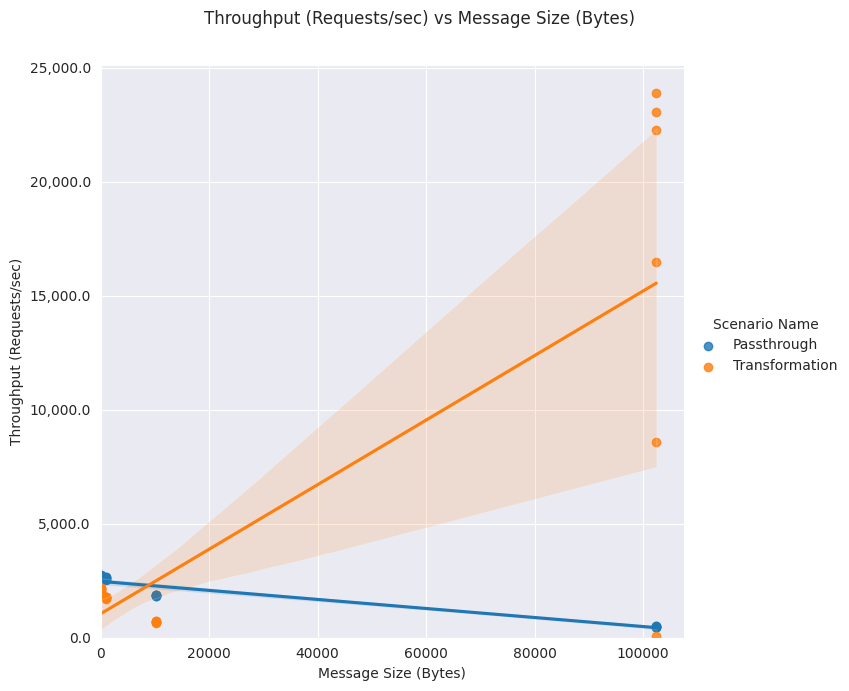
Throughput (requests/sec) vs. message size (Bytes)
Average response time comparison
Average response time (ms) vs. concurrent users
Average response time (ms) vs. message size (Bytes)