Performance Test Results for Router with Two CPU
Test results explained in below obtained assigning Router's concurrency level as four. For the Choreo Connect components, below resource amounts are allocated. Same test setup diagram includes in here .
| Container Name | Requesting Memory Amount (Mi) | Requesting CPU Amount (m) | Limiting Memory Amount (Mi) | Limiting CPU Amount (m) |
|---|---|---|---|---|
| Adapter | 500 | 500 | 500 | 500 |
| Enforcer | 2000 | 1000 | 2000 | 1000 |
| Router | 500 | 2000 (2 CPUs) | 500 | 2000 (2 CPUs) |
| Netty Backend | 4096 | 2000 | 6114 | 2000 |
For the Enforcer's Java Virtual Machine (JVM), memory allocation changed as below.
Xmx1500m (Maximum memory allocation for the JVM)Xms1500m (Satrting memory allocation for the JVM)
In order to handle high request counts in Enforcer, authService's resource allocation changed as below.
[enforcer.authService]
    # Port of the Enforcer auth service
    port = 8081
    # Maximum message size in bytes
    maxMessageSize = 1000000000
    # Maximum header size in bytes
    maxHeaderLimit = 8192
    # Keep alive time in seconds for connection with the router via external authz service
    keepAliveTime = 600
    # Thread pool configurations of gRPC netty based server in Enforcer that handles the incoming requests in the Choreo Connect
    [enforcer.authService.threadPool]
        # Minimum number of workers to keep alive
        coreSize = 400
        # Maximum pool size
        maxSize = 1000
        # Timeout in seconds for idle threads waiting for work
        keepAliveTime = 600
        # Queue size of the worker threads
        queueSize = 2000
Below graphs depict performance test results considering different test parameters.
Comparison of results
Throughput (requests/sec) vs. concurrent users
The following graph illustrates the throughput against the number of concurrent users.
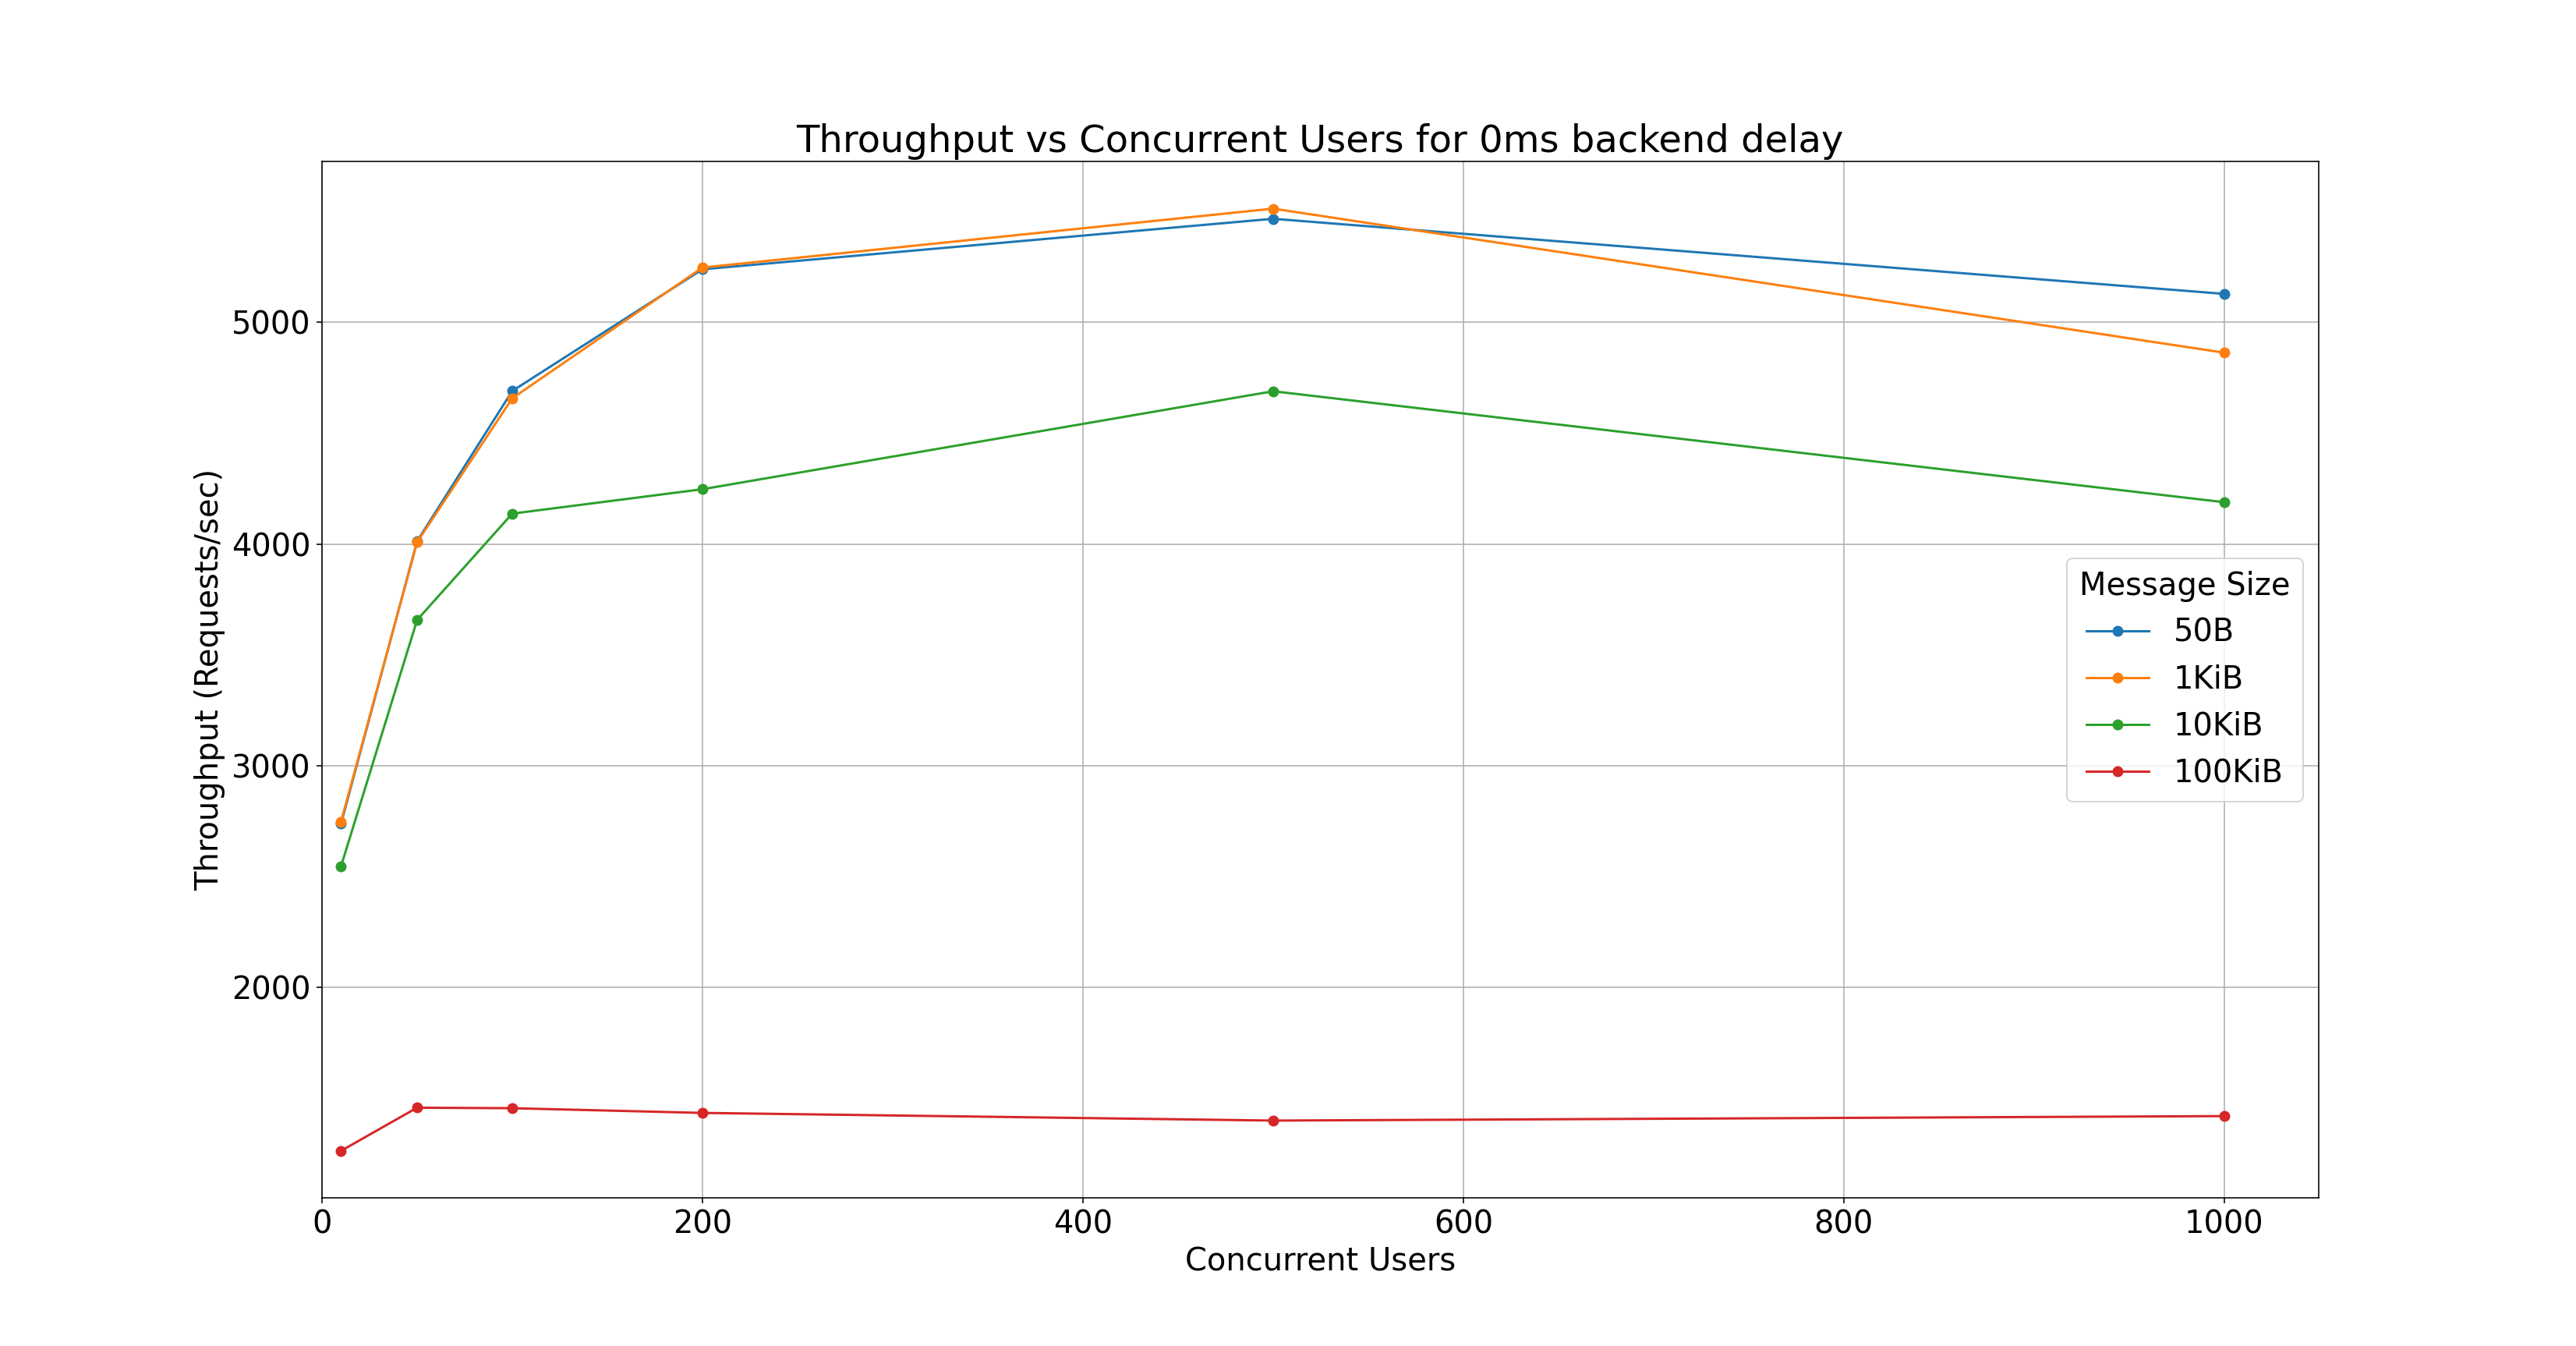
Key observations:
- For large payload sizes you will get a low throughput value when compared to the small payload sizes.
Average Response time (ms) vs. concurrent users
Backend delay is assigned as zero milliseconds when obtaining test results. The below graph shows how response time varied for different concurrent user counts. Also, the same graph shows the impact of the payload size for the average response time.
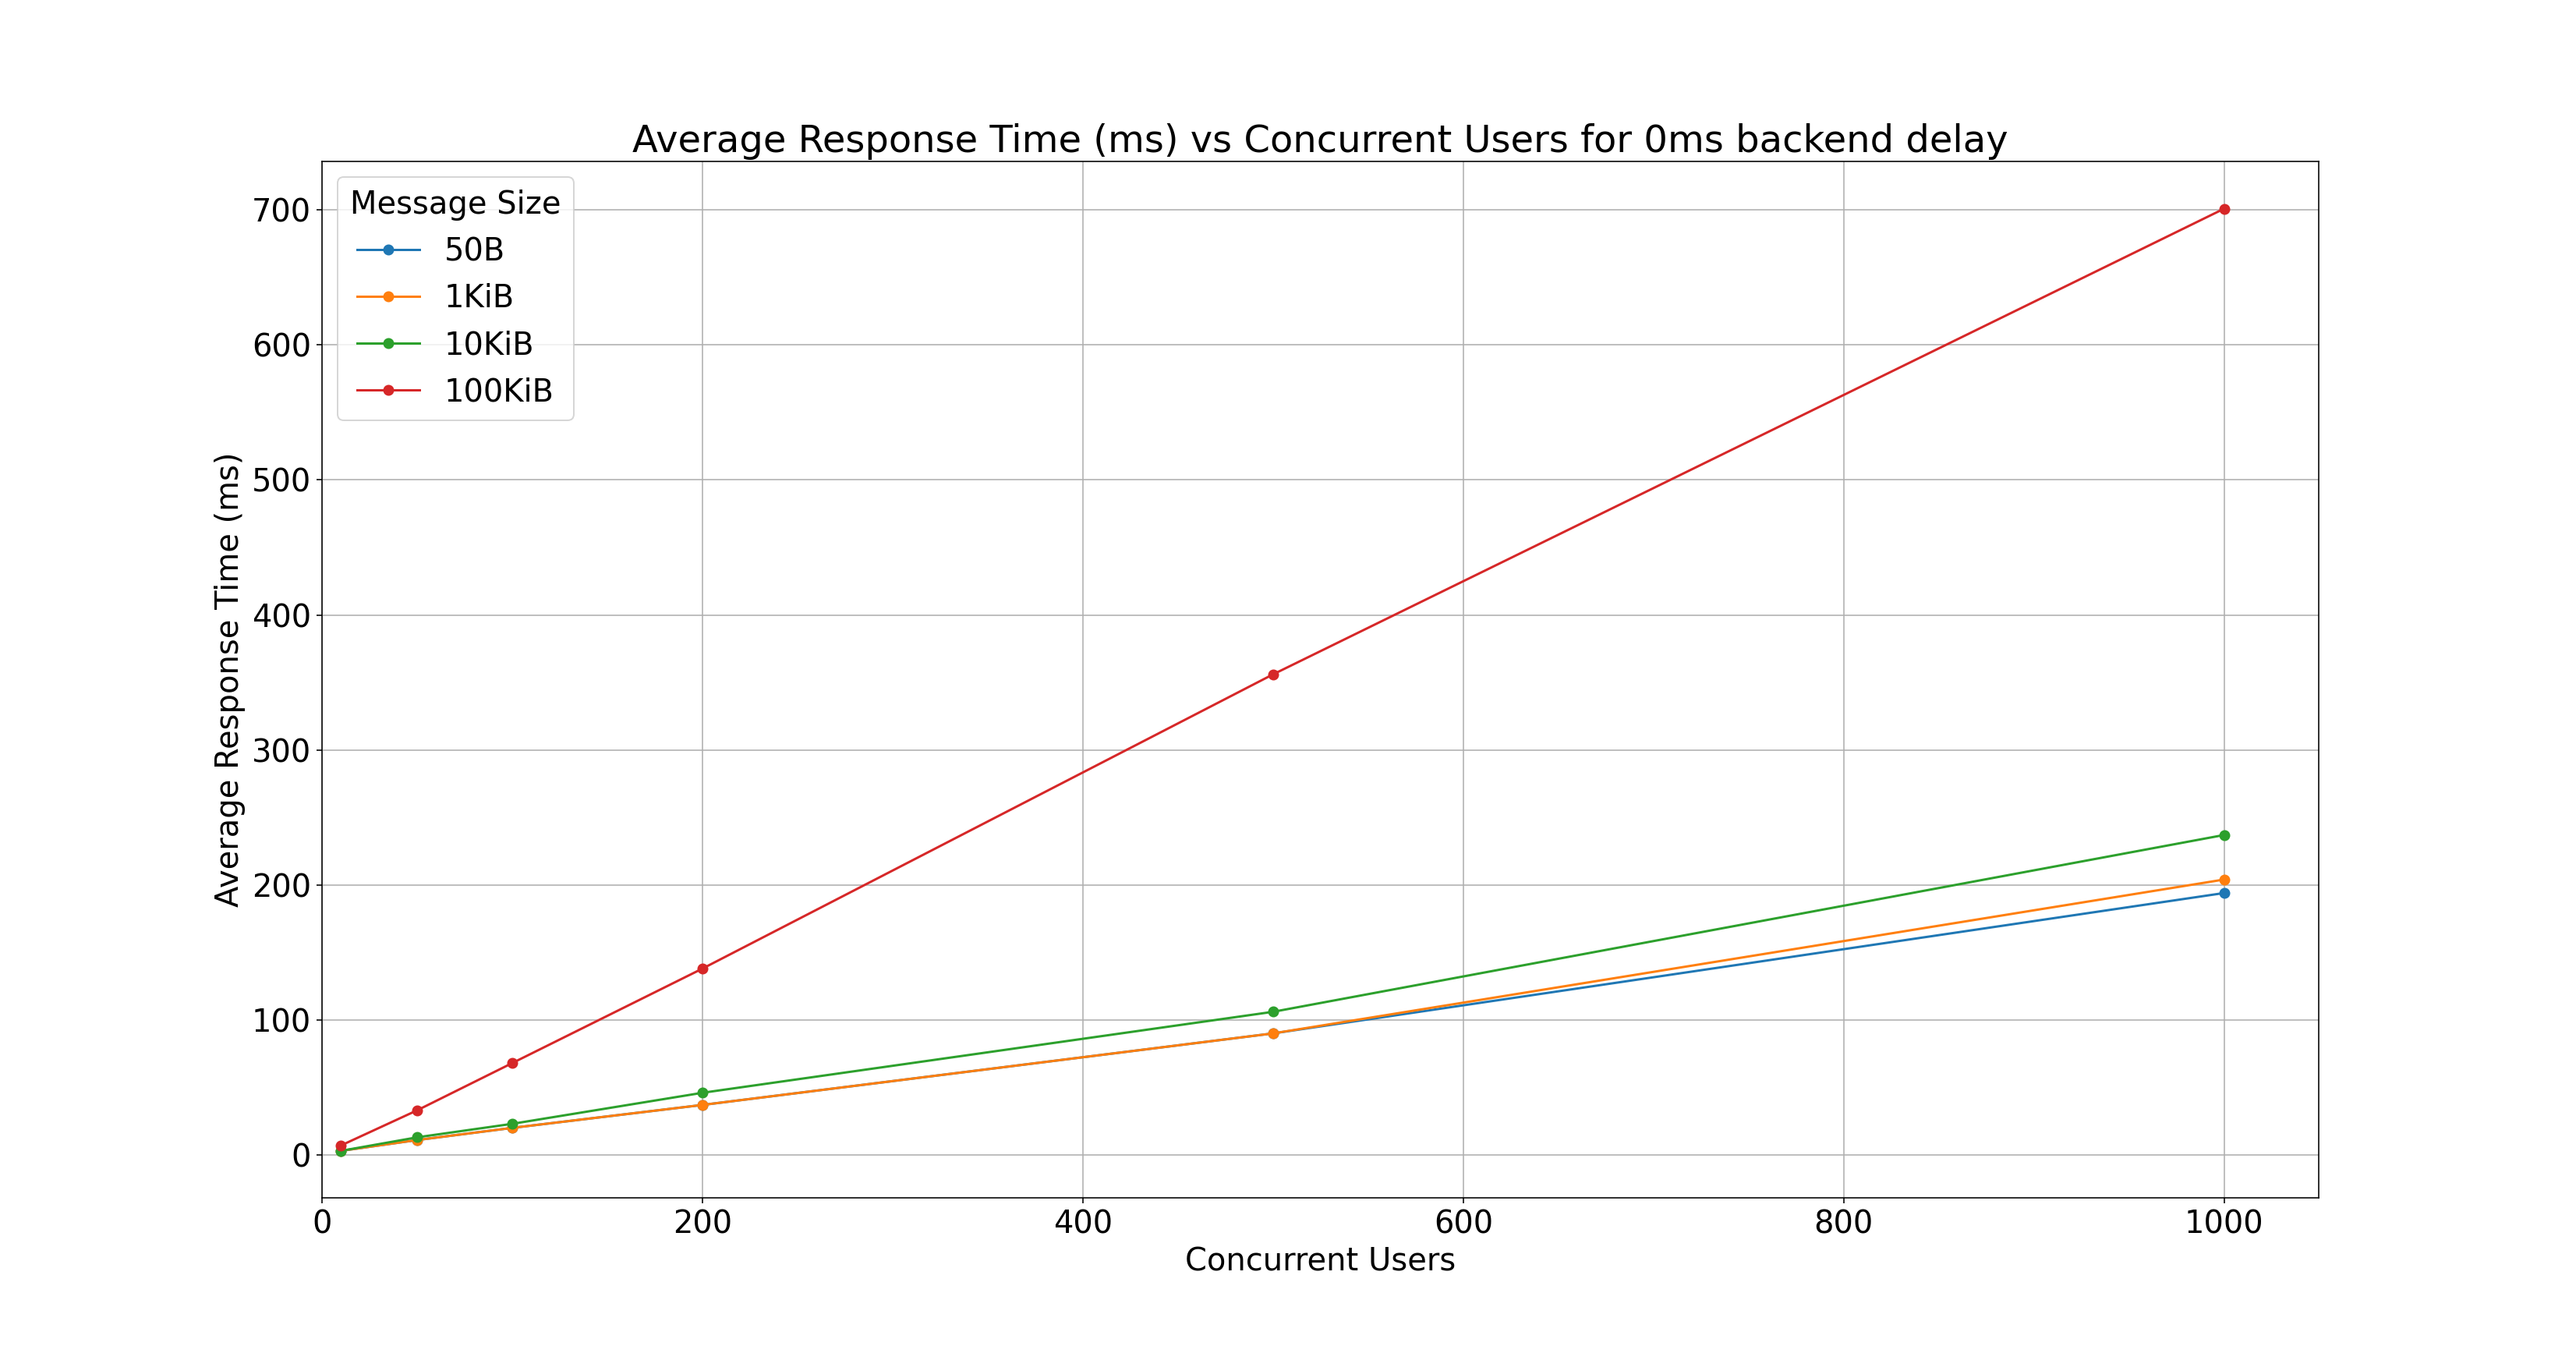
Key observations:
- When increasing concurrent users for given payload size, Choreo Connect consumes steady growth for the response time. But when considering the same user count for large payloads, response time is high compared to the small payloads.
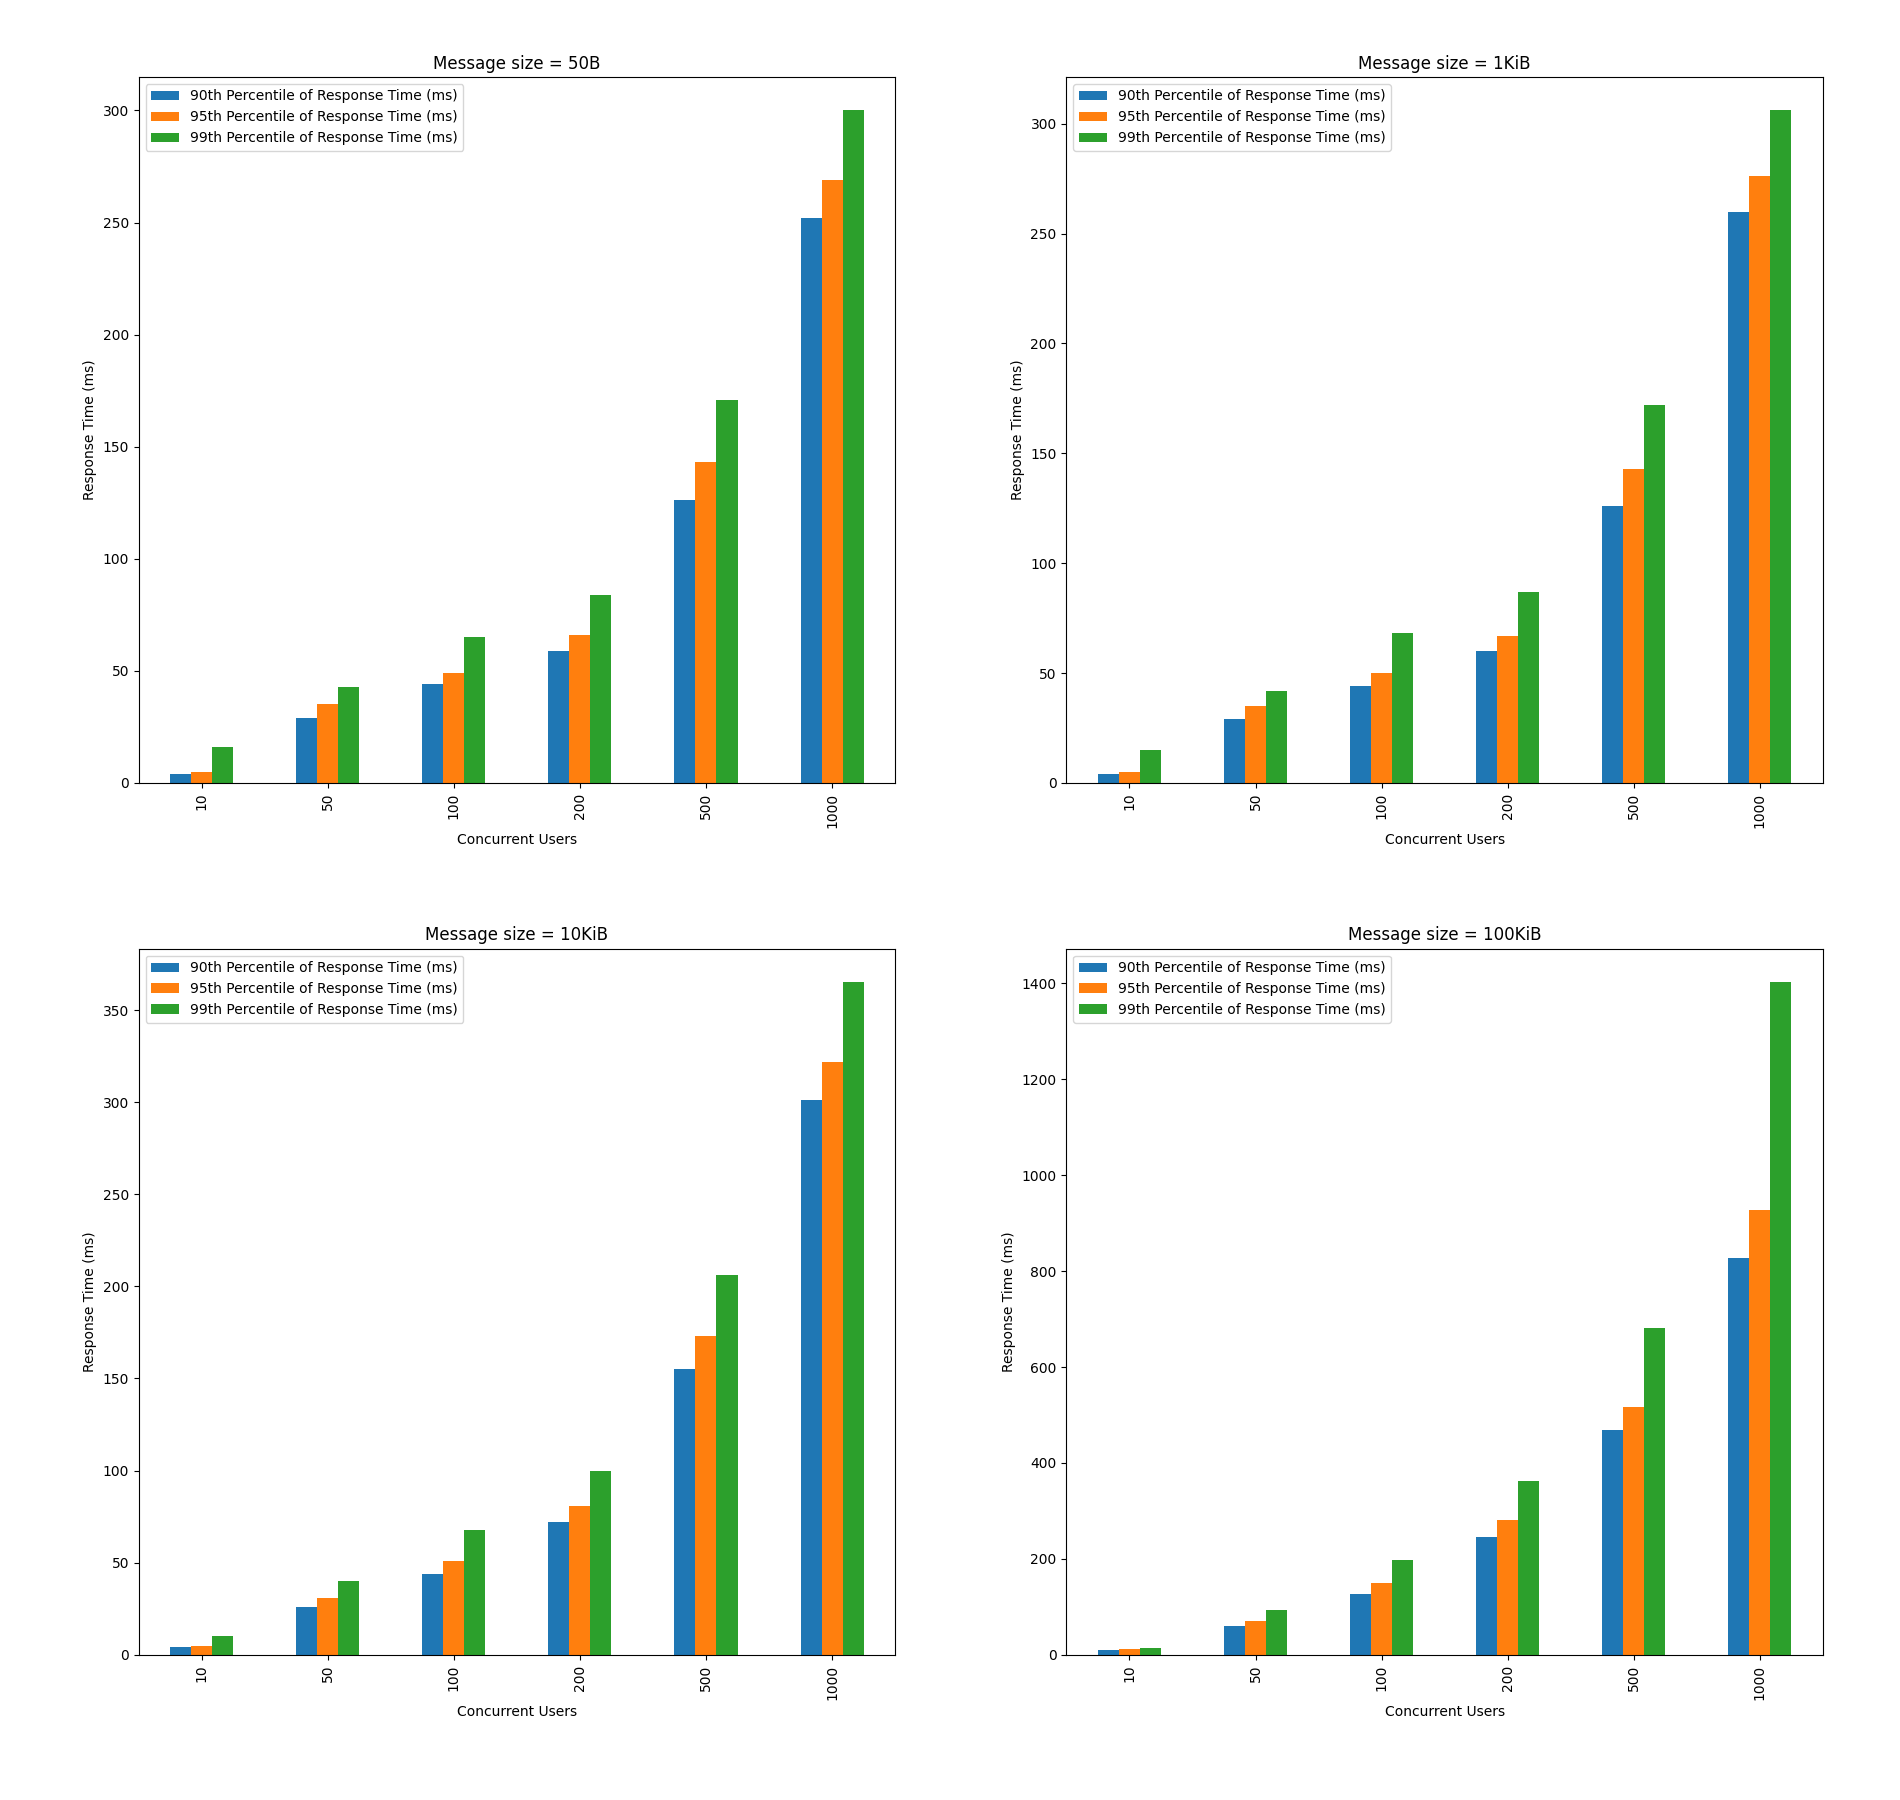
Response time percentiles vs. concurrent users
Below graphs show 90th, 95th, and 99th Response Time percentiles for 0ms backend delay. This is useful to measure the percentage of requests that exceeded the response time value for a given percentile. A percentile can also tell the percentage of requests completed below the particular response time value.
Data relevant to the test scenarios listed in the below table.
| Concurrent Users | Message Size (Bytes) | Total requests | Average Response Time (ms) | Throughput (Requests/sec) | Error % | Error Count | Little's law verification | 90th Percentile of Response Time (ms) | 95th Percentile of Response Time (ms) | 99th Percentile of Response Time (ms) |
|---|---|---|---|---|---|---|---|---|---|---|
| 10 | 50B | 2465235 | 3 | 2738.5 | 0 | 0 | 8.2155 | 4 | 5 | 16 |
| 50 | 50B | 3612288 | 11 | 4012.5 | 0 | 0 | 44.1375 | 29 | 35 | 43 |
| 100 | 50B | 4221994 | 20 | 4689.8 | 0 | 0 | 93.796 | 44 | 49 | 65 |
| 200 | 50B | 4715766 | 37 | 5238.6 | 0 | 0 | 193.8282 | 59 | 66 | 84 |
| 500 | 50B | 4921820 | 90 | 5466.4 | 0 | 0 | 491.976 | 126 | 143 | 171 |
| 1000 | 50B | 4617754 | 194 | 5127.7 | 0 | 0 | 994.7738 | 252 | 269 | 300 |
| 10 | 1KiB | 2474194 | 3 | 2748.4 | 0 | 0 | 8.2452 | 4 | 5 | 15 |
| 50 | 1KiB | 3608191 | 11 | 4008.2 | 0 | 0 | 44.0902 | 29 | 35 | 42 |
| 100 | 1KiB | 4187712 | 20 | 4656.9 | 0 | 0 | 93.138 | 44 | 50 | 68 |
| 200 | 1KiB | 4722928 | 37 | 5246.3 | 0 | 0 | 194.1131 | 60 | 67 | 87 |
| 500 | 1KiB | 4962712 | 90 | 5512.1 | 0 | 0 | 496.089 | 126 | 143 | 172 |
| 1000 | 1KiB | 4379559 | 204 | 4862.5 | 0 | 0 | 991.95 | 260 | 276 | 306 |
| 10 | 10KiB | 2292961 | 3 | 2547 | 0 | 0 | 7.641 | 4 | 5 | 10 |
| 50 | 10KiB | 3292426 | 13 | 3657.4 | 0 | 0 | 47.5462 | 26 | 31 | 40 |
| 100 | 10KiB | 3726912 | 23 | 4136.9 | 0 | 0 | 95.1487 | 44 | 51 | 68 |
| 200 | 10KiB | 3823400 | 46 | 4246.9 | 0 | 0 | 195.3574 | 72 | 81 | 100 |
| 500 | 10KiB | 4213767 | 106 | 4688.7 | 0 | 0 | 497.0022 | 155 | 173 | 206 |
| 1000 | 10KiB | 3773976 | 237 | 4188.4 | 0 | 0 | 992.6508 | 301 | 322 | 365 |
| 10 | 100KiB | 1137663 | 7 | 1263.8 | 0 | 0 | 8.8466 | 11 | 12 | 15 |
| 50 | 100KiB | 1312758 | 33 | 1458.3 | 0 | 0 | 48.1239 | 60 | 71 | 93 |
| 100 | 100KiB | 1310828 | 68 | 1456 | 0 | 0 | 99.008 | 127 | 150 | 198 |
| 200 | 100KiB | 1291683 | 138 | 1434.8 | 0 | 0 | 198.0024 | 246 | 282 | 362 |
| 500 | 100KiB | 1260706 | 356 | 1400.2 | 0 | 0 | 498.4712 | 469 | 516 | 681 |
| 1000 | 100KiB | 1280531 | 701 | 1420.4 | 0 | 0 | 995.7004 | 827 | 927 | 1402 |