JMX-Based Monitoring
Java Management Extensions (JMX) is a technology that lets you implement management interfaces for Java applications. A management interface, as defined by JMX, is composed of named objects called MBeans (Management Beans). MBeans are registered with a name (an ObjectName) in an MBeanServer. To manage a resource or many resources in your application, you can write an MBean defining its management interface and register that MBean in your MBeanServer. The content of the MBeanServer can then be exposed through various protocols, implemented by protocol connectors, or protocol adapters.
Configuring JMX in a WSO2 product
JMX is enabled in WSO2 products by default, which ensures that the JMX server starts automatically when you start a particular product. Additionally, you can enable JMX separately for the various datasources that are used by the product. Once JMX is enabled, you can log in to the JConsole tool and monitor your product as explained in the next section.
Configuring JMX ports for the server
The default JMX ports (RMIRegistryPort and the RMIServerPort) can be changed by adding the below configuration into <API-M_HOME>/repository/conf/deployment.toml file as shown below. Following are the default values and you can update them as required.
 [monitoring.jmx]
 rmi_registry_port = 9999
 rmi_server_port = 11111
Disabling JMX for the server
You can disable the JMX server for your product by adding the rmi_server_start property with value false into the <API-M_HOME>/repository/conf/deployment.toml file as shown below.
 [monitoring.jmx]
 rmi_server_start=false
Enabling JMX for a datasource
You can enable JMX for a datasource by adding the jmx_enable property with value true into the
<API-M_HOME>/repository/conf/deployment.toml file as shown below.
[database.shared_db]
jmx_enable = "true"[database.am_db]
jmx_enable = "true"Monitoring a WSO2 product with JConsole
JConsole is a JMX-compliant monitoring tool, which comes with the Java Development Kit (JDK). You can find this tool inside your <JDK_HOME>/bin directory.
Starting the WSO2 product with JMX
First, start the WSO2 product:
- Open a command prompt and navigate to the
<API-M_HOME>/bindirectory. -
Execute the product startup script (
api-manager.shfor Linux andapi-manager.batfor Windows) to start the server.Info
If JMX is enabled, the JMX server URL will be published on the console when the server starts, as shown below.
INFO {org.wso2.carbon.core.init.CarbonServerManager} - JMX Service URL : service:jmx:rmi://<your-ip>:11111/jndi/rmi://<your-ip>:9999/jmxrmi
Once the product server is started, you can start the JConsole tool as follows:
- Open a command prompt and navigate to the
<JDK_HOME>/bindirectory. -
Execute the j
consolecommand to open the log-in screen of the Java Monitoring & Management Console as shown below.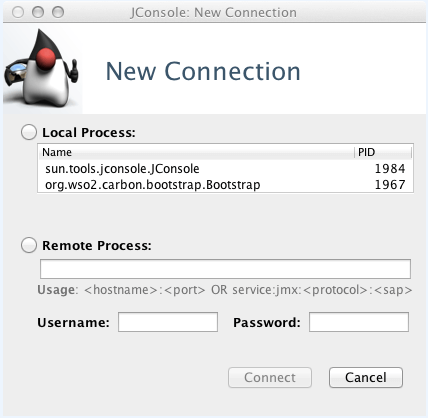
-
Enter the connection details in the above screen as follows:
-
Enter the JMX server URL in the Remote Process field. This URL is published on the command prompt when you start the WSO2 server as explained above.
Info
If you are connecting with a remote IP address instead of localhost, you need to bind the JMX service to the externally accessible IP address by adding the following system property to the product startup script stored in the
<API-M_HOME>/bindirectory (api-manager.shfor Linux andapi-manager.batfor Windows). For more information, read Troubleshooting Connection Problems in JConsole.-Djava.rmi.server.hostname=<IP_ADDRESS_WHICH_YOU_USE_TO_CONNECT_TO_SERVER>Be sure to restart the server after adding the above property.
-
Enter values for the Username and Password fields to log in. If you are logging in as the administrator, you can use the same administrator account that is used to log in to the product's management console: admin/admin.
Info
Make sure that the user ID you are using for JMX monitoring is assigned a role that has the Server Admin permission. See Configuring Roles for further information about configuring roles assigned to users. Any user assigned to the admin role can log in to JMX.
-
-
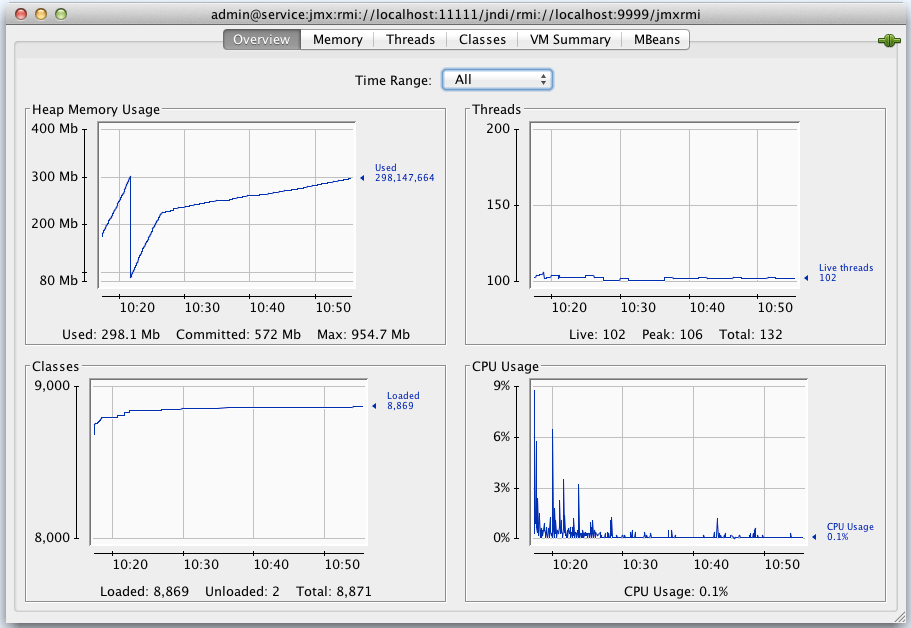
Click Connect to open the Java Monitoring & Management Console. The following tabs will be available:
Overview
See the Oracle documentation on using JConsole for more information on these tabs.
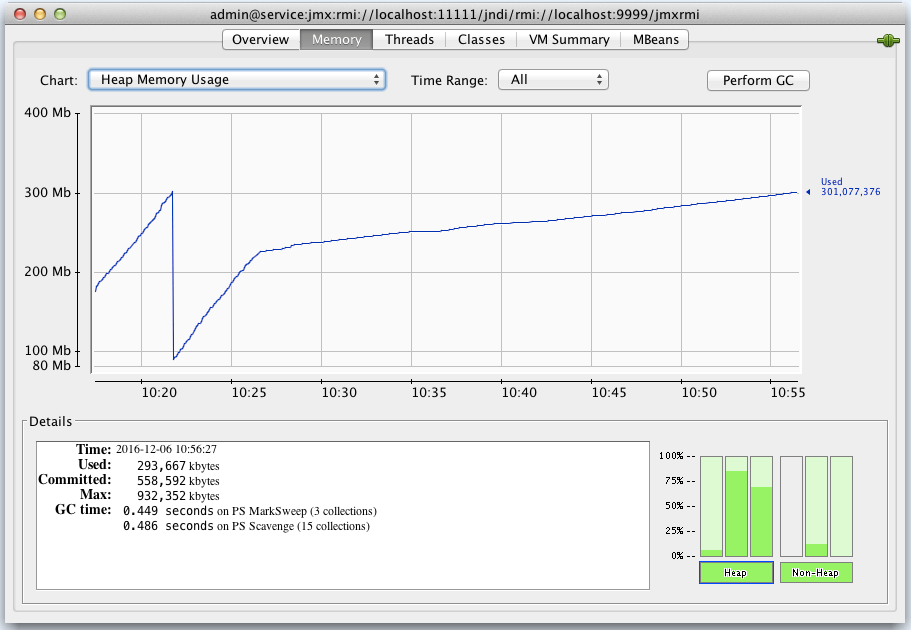
Memory
See the Oracle documentation on using JConsole for more information on these tabs.
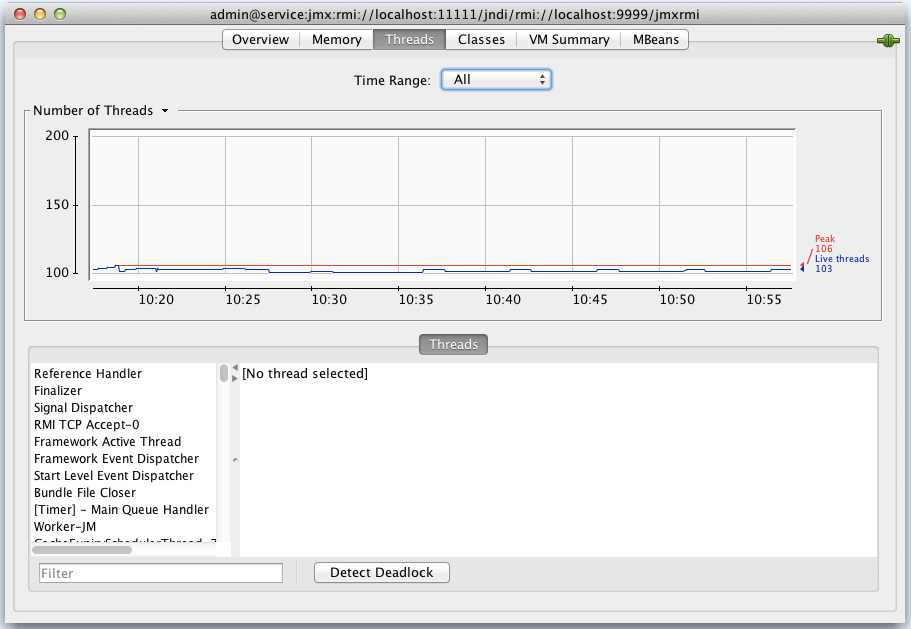
Threads
See the Oracle documentation on using JConsole for more information on these tabs.
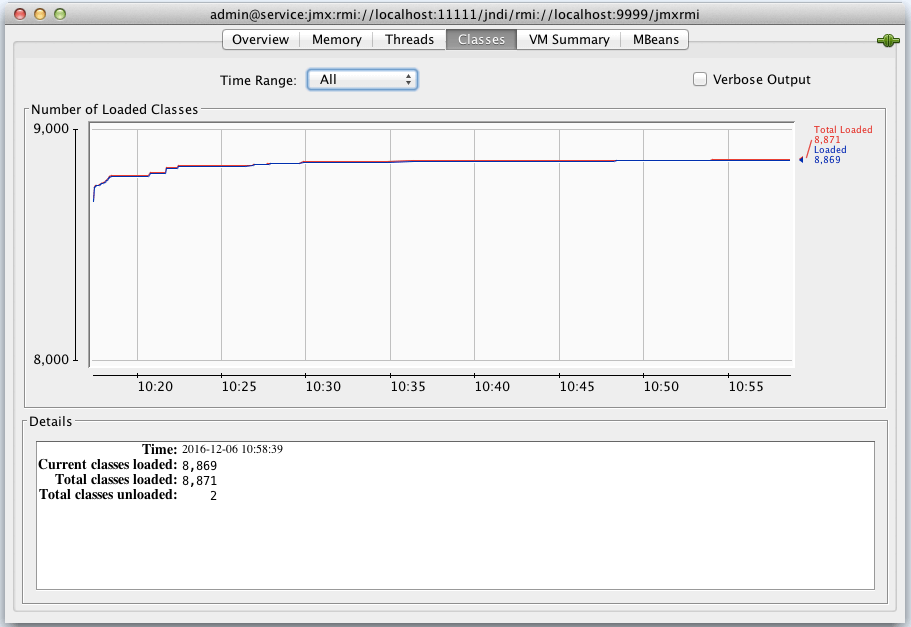
Classes
See the Oracle documentation on using JConsole for more information on these tabs.
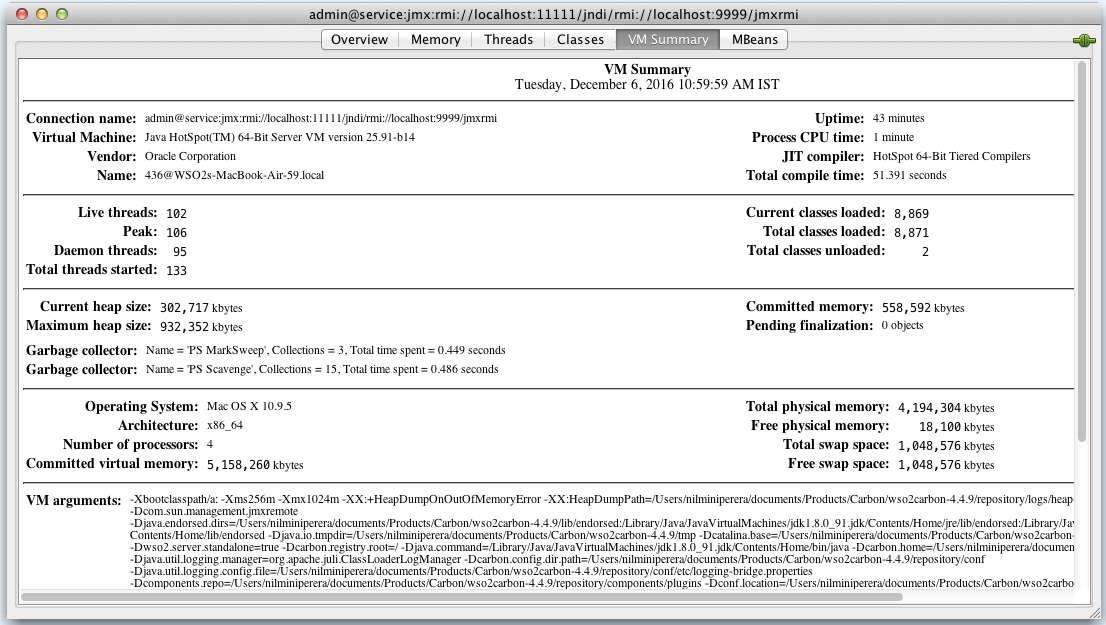
VM
See the Oracle documentation on using JConsole for more information on these tabs.
MBeans
See the Oracle documentation on using JConsole for more information on these tabs.
Using the ServerAdmin MBean
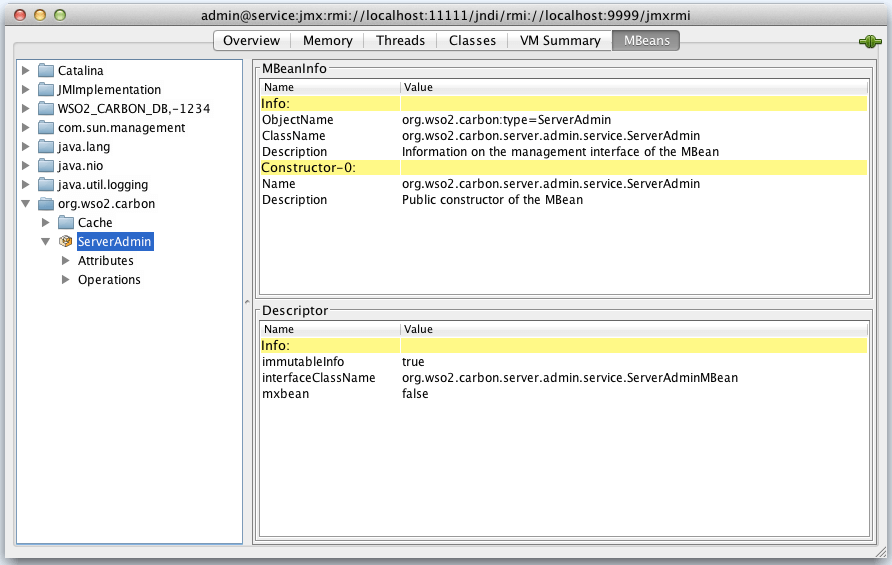
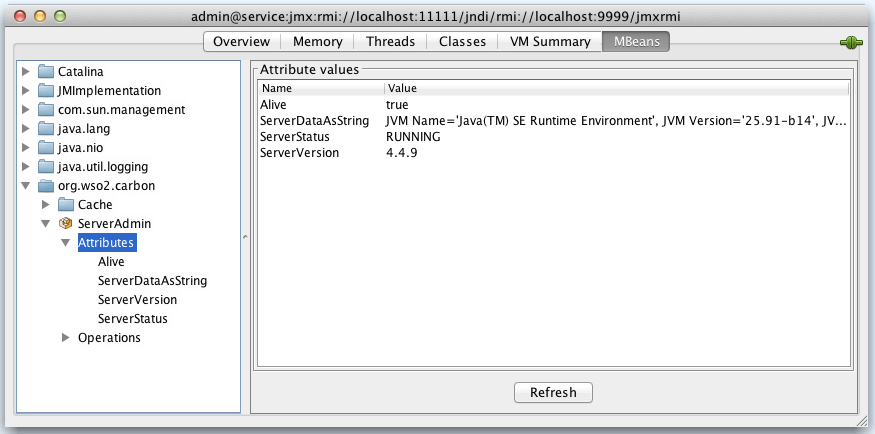
When you go to the MBeans tab in the JConsole, the ServerAdmin MBean will be listed under the "org.wso2.carbon" domain as shown below.
The ServerAdmin MBean is used for administering the product server instance. There are several server attributes such as "ServerStatus", "ServerData" and "ServerVersion". The "ServerStatus" attribute can take any of the following values:
- RUNNING
- SHUTTING_DOWN
- RESTARTING
- IN_MAINTENANCE
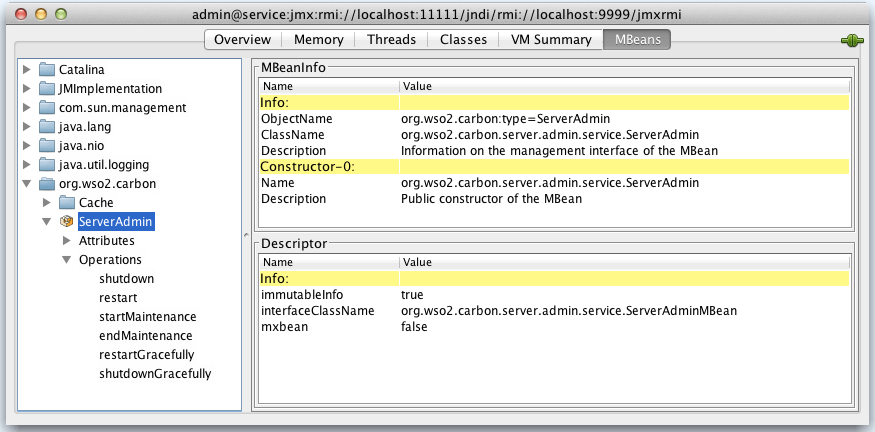
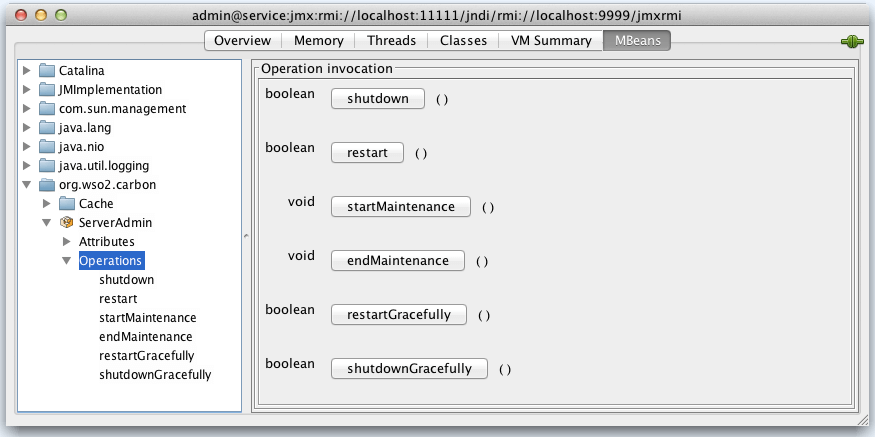
The ServerAdmin MBean has the following operations:
| Operation | Description |
|---|---|
| shutdown | Forcefully shut down the server. |
| restart | Forcefully restart the server. |
| restartGracefully | Wait till all current requests are served and then restart. |
| shutdownGracefully | Wait till all current requests are served and then shutdown. |
| startMaintenance | Switch the server to maintenance mode. No new requests will be accepted while the server is in maintenance. |
| endMaintenance | Switch the server to normal mode if it was switched to maintenance mode earlier. |
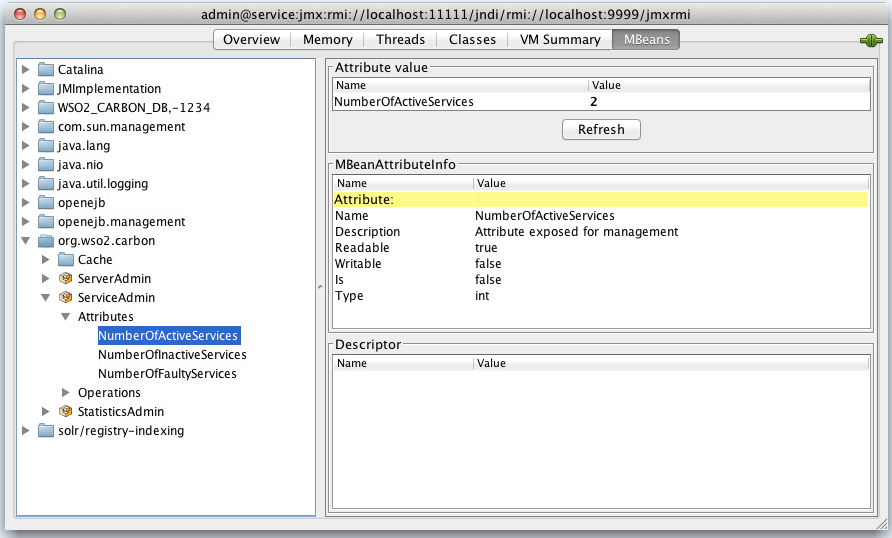
Using the ServiceAdmin MBean
This MBean is used for administering services deployed in your product. Its attributes are as follows:
| Attribute | Description |
|---|---|
| NumberOfActiveServices | The number of services that can currently serve requests. |
| NumberOfInactiveServices | The number of services that have been disabled by an administrator. |
| NumberOfFaultyServices | The number of services that are faulty. |
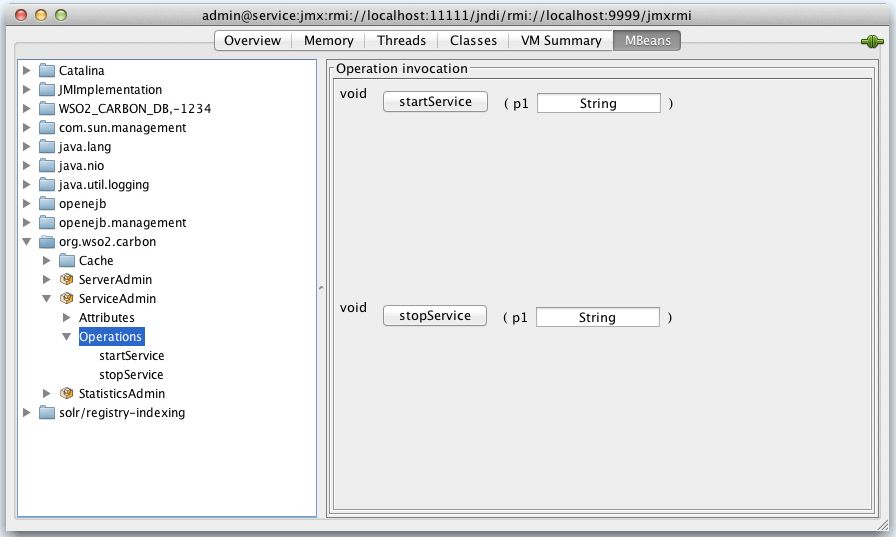
The operations available in the ServiceAdmin MBean:
| Operation | Description |
|---|---|
| startService (p1:string) | The p1 parameter is the service name. You can activate a service using this operation. |
| stopService (p1:string) | The p1 parameter is the service name. You can deactivate/disable a service using this operation. |
 ](https://apim.docs.wso2.com/en/4.1.0/assets/img/administer/operation-invocation.png)
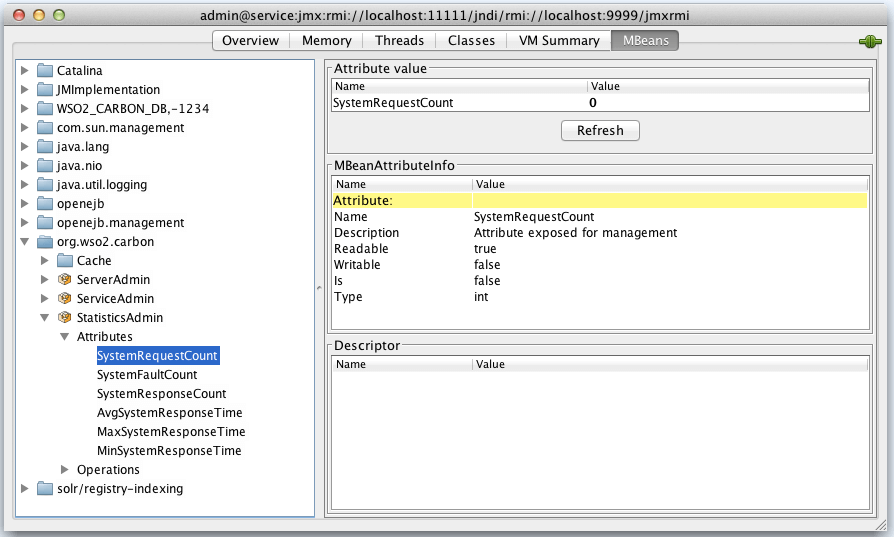
Using the StatisticsAdmin MBean
This MBean is used for monitoring system and server statistics. Its attributes are as follows:
| Attributes | Description |
|---|---|
| AvgSystemResponseTime | The average response time for all the services deployed in the system. The beginning of the measurement is the time at which the server started. |
| MaxSystemResponseTime | The maximum response time for all the services deployed in the system. The beginning of the measurement is the time at which the server started. |
| MinSystemResponseTime | The minimum time for all the services deployed in the system. The beginning of the measurement is the time at which the server started. |
| SystemFaultCount | The total number of faults that occurred in the system since the server was started. |
| SystemRequestCount | The total number of requests that has been served by the system since the server was started. |
| SystemResponseCount | The total number of response that has been sent by the system since the server was started. |
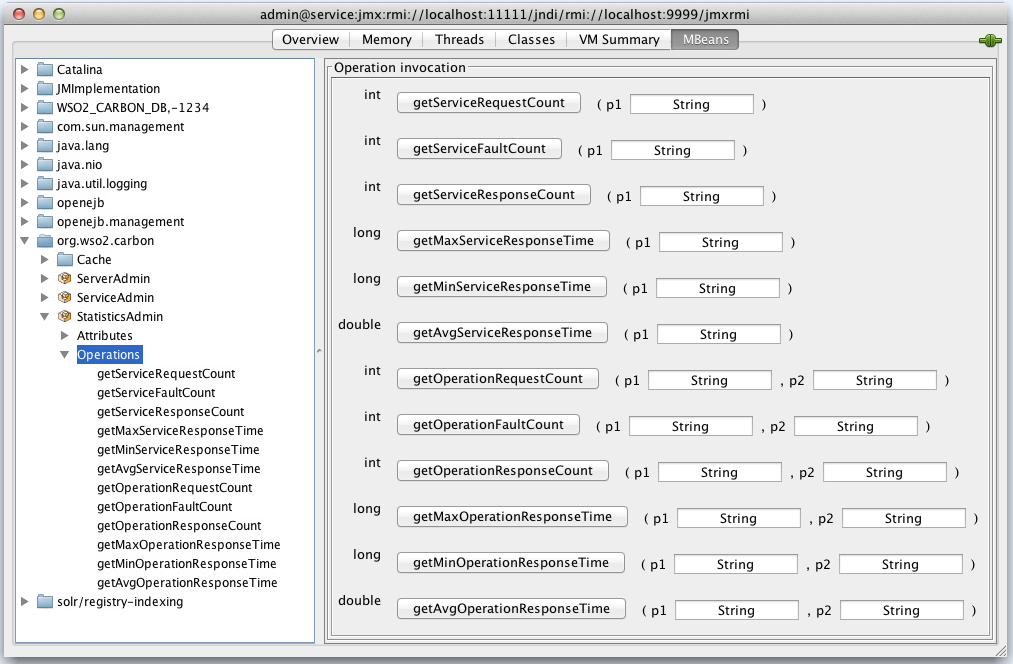
Operations available in the Statistics MBean:
| Operation | Description |
|---|---|
| getServiceRequestCount (p1:string) | The p1 parameter is the service name. You can get the total number of requests received by this service since the time it was deployed using this operation. |
| getServiceResponseCount (p1:string) | The p1 parameter is the service name. You can get the total number of responses sent by this service since the time it was deployed using this operation. |
| getServiceFaultCount (p1:string) | The p1 parameter is the service name. You can get the total number of fault responses sent by this service since the time it was deployed using this operation. |
| getMaxServiceResponseTime (p1:string) | The p1 parameter is the service name. You can get the maximum response time of this service since deployment. |
| getMinServiceResponseTime (p1:string) | The p1 parameter is the service name. You can get the minimum response time of this service since deployment. |
| getAvgServiceResponseTime (p1:string) | The p1 parameter is the service name. You can get the average response time of this service since deployment. |
getOperationRequestCount ( p1:string, http://p2string/ ) |
The p1 parameter is the service name. The p2 parameter is the operation name. You can get the total number of requests received by this operation since the time its service was deployed using this operation. |
getOperationResponseCount ( p1:string, http://p2string/ ) |
The p1 parameter is the service name. The p2 parameter is the operation name. You can get the total number of responses sent by this operation since the time its service was deployed using this operation. |
getOperationFaultCount ( p1:string, http://p2string/ ) |
The p1 parameter is the service name. The p2 parameter is the operation name. You can get the total number of fault responses sent by this operation since the time its service was deployed using this operation. |
getMaxOperationResponseTime ( p1:string, [p2:string]http://p2string ) |
The p1 parameter is the service name. The p2 parameter is the operation name. You can get the maximum response time of this operation since deployment. |
getMinOperationResponseTime ( p1:string, [p2:string]http://p2string/ ) |
The p1 parameter is the service name. The p2 parameter is the operation name. You can get the minimum response time of this operation since deployment. |
getAvgOperationResponseTime ( p1:string, [p2:string]http://p2string/ ) |
The p1 parameter is the service name. The p2 parameter is the operation name. You can get the average response time of this operation since deployment. |
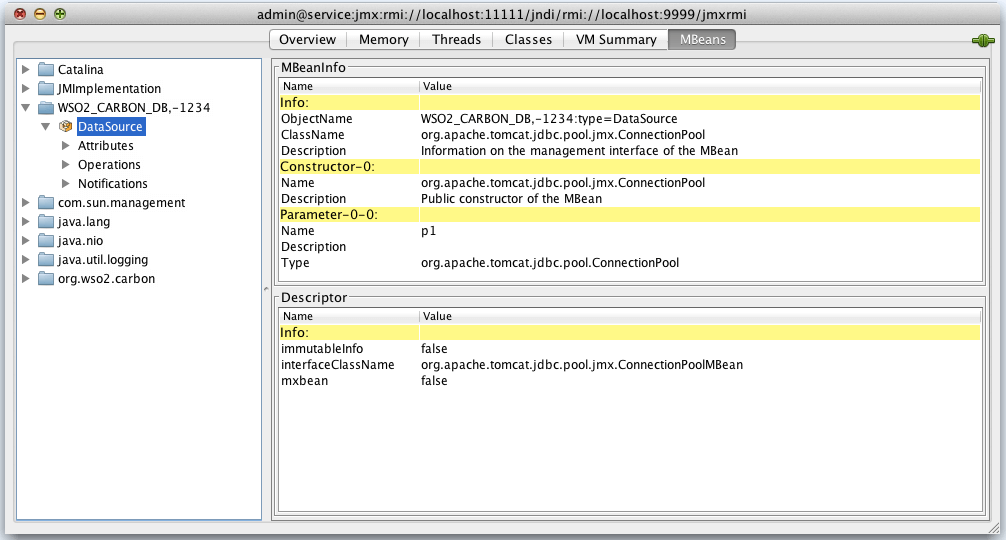
Using the DataSource MBean
If you have JMX enabled for a datasource connected to the product, you can monitor the performance of the datasource using this MBean. The DataSource MBean will be listed as shown below.
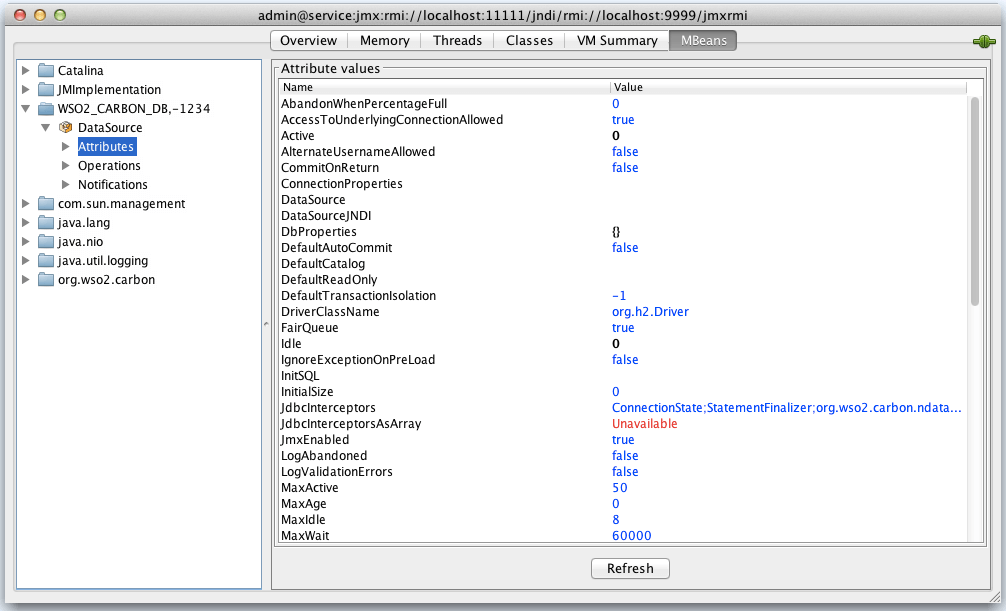
Example: If you have JMX enabled for the default Carbon datasource in the master-datasources.xml. file, the JDBC connection pool parameters that are configured for the Carbon datasource will be listed as attributes as shown below. See the performance tuning guide for instructions on how these parameters are configured for a datasource.
Using the Product-specific MBeans
The WSO2 product that you are using may have product-specific MBeans enabled for monitoring and managing specific functions. See the documentation for your product for detailed instructions on such product-specific MBeans.
Monitoring a WSO2 product with Jolokia
Jolokia is a JMX-HTTP bridge, which is an alternative to JSR-160 connectors. It is an agent-based approach that supports many platforms. In addition to basic JMX operations, it enhances JMX monitoring with unique features like bulk requests and fine-grained security policies.
Follow the steps below to use Jolokia to monitor a WSO2 product.
- Download Jolokia OSGi Agent. (These instructions are tested with the Jolokia OSGI Agent version 1.3.6 by downloading the
jolokia-osgi-1.3.6.jarfile.) - Add it to the
<API-M_HOME>/repository/components/dropins/directory. -
Start the WSO2 product server.
Once the server starts, you can read MBeans using Jolokia APIs. The following are a few examples.
- List all available MBeans:
http://localhost:9763/jolokia/list(Change the appropriate hostname and port accordingly.) -
WSO2 ESB MBean:
http://localhost:9763/jolokia/read/org.apache.synapse:Name=https-sender,Type=PassThroughConnections/ActiveConnections -
Reading Heap Memory:
http://localhost:9763/jolokia/read/java.lang:type=Memory/HeapMemoryUsage
For more information on the JMX MBeans that are available in WSO2 products, see Monitoring a WSO2 product with JConsole.
- List all available MBeans: