Performance Test Results
The performance of WSO2 Micro Integrator Manager was measured using the following scenarios.
- Direct Proxy: This is a PassThrough Proxy Service, which directly invokes the back-end service.
- Direct API: This is a PassThrough API Service, which directly invokes the back-end service.
- CBR Transport Header Proxy: This is a Proxy Service which routes the message based on an HTTP header in the message.
- XSLT Proxy: This is a Proxy Service which has XSLT transformations in request and response paths.
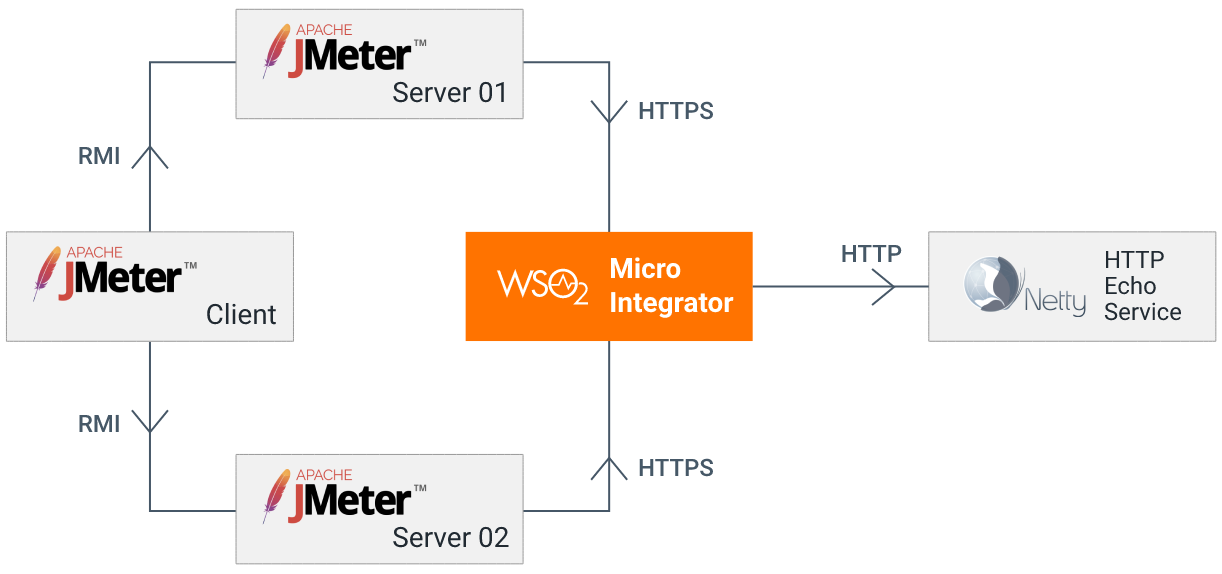
Our test client is Apache JMeter. We test each scenario for a fixed duration of time. We split the test results into warmup and measurement parts and use the measurement part to compute the performance metrics. Test scenarios use a Netty based back-end service which echoes back any request posted to it after a specified period of time. (All the tests were executed with a 0ms backend delay)
Tests were done using 100, 200, 500, and 1000 concurrent users. Concurrent Users mean that it consists of multiple users sending requests at the same time. Different Message Sizes (Payloads) were used for the tests : 500B, 1kB, 10kB, and 100kB.
Two key performance metrics were used to measure the performance of each test.
- Throughput: The number of requests that the WSO2 Micro Integrator processes during a specific time interval (e.g. per second)..
- Response Time: The end-to-end latency for an operation of invoking a service in WSO2 Micro Integrator. The complete distribution of response times was recorded.
Note
All the performance results were done on the default Micro Integrator distribution. The following performance results may become invalid if configurations are changed. For example, the default passthru io_buffer_size is 16KB. Hence the throughput significantly decreases for payload sizes above 16KB. If the buffer size is increased, the throughput might differ. Similarly, when worker pool thread counts are changed, the performance of the Micro Integrator changes significantly. Therefore, to get accurate results, it is necessary to be specific about the exact configurations and scenarios used for the performance tests.
Deployment used for the test
Given below are the details of the deployment that was used for the performance test that is recorded in this documentation.
| Name | EC2 Instance Type | vCPU | Mem(GiB) |
|---|---|---|---|
| Apache JMeter Client | c5.large | 2 | 2 |
| Apache JMeter Server 01 | c5.xlarge | 4 | 4 |
| Apache JMeter Server 02 | c5.xlarge | 4 | 4 |
| Netty HTTP Backend | c5.xlarge | 4 | 4 |
| WSO2 Micro Manager | c5.large | 2 | 2 |
- The operating system is Ubuntu 18.04.5 LTS
- Java version is JDK 8
Performance test scripts
All scripts used to run the performance tests and analyze results are in the following repositories.
Results
Given below is a summary of the performance result for each of the scenarios used for the tests. The complete results can be found here.
Throughput (requests/sec) vs. concurrent users
The following results compare the throughput against the number of concurrent users in each scenario.
Direct Proxy

Direct API

CBR Transport Header Proxy

XSLT Proxy

Average response time (ms) vs. concurrent users
The following results compare the average response time of the Micro Integrator server against the number of users in each scenario.
Direct Proxy

Direct API

CBR Transport Header Proxy

XSLT Proxy
