Publishing Analytics Events to External Systems
WSO2 API Manager allows publishing its analytics data to external systems in the same way it publishes the data to the cloud. For this purpose you need to create a custom event publisher. This guide will explain and walk through the steps required to implement, deploy, and configure a custom event publisher.
For demonstration purposes, let’s assume ELK as the external system.
Step 1 - Create an Event Publisher
Follow the instructions below to create the custom event publisher.
Note
If you are not interested in creating the custom event publisher from scratch, you can use the already created sample event publisher instead and resume the guide from here.
Step 1.1 - Set up a Maven project
-
Create a new Maven-based Java project.
-
Add the required dependency.
The Maven-based Java project uses the WSO2 Analytics Publisher library, which is available in the WSO2 Nexus repository. Therefore, you need to add this library as a dependency.
-
Navigate and open the
<PROJECT_DIR>/pom.xmlfile. -
Define the
wso2-nexusrepository in thepom.xmlfile. -
Add the dependency in the
pom.xmlfile.
-
Step 1.2 - Implement the required classes
You need to implement two interfaces from the above dependency, (i.e., CounterMetric and MetricReporter) in order to implement the rest of the functionality.
-
org.wso2.am.analytics.publisher.reporter.CounterMetric
You can use the
CounterMetricclass type to log accumulated analytics data. You can override itsincrementCount()method to log the required analytics data. -
org.wso2.am.analytics.publisher.reporter.MetricReporter
You can use the
MetricReporterclass type to publish analytics data to an external party. You can override itscreateCounterMetric()method to return an instance of theCounterMetricimplementation which is mentioned above. This allows logging accumulated analytics data.
-
Create a new class implementing the
org.wso2.am.analytics.publisher.reporter.CounterMetricinterface and override its methods.You can find a sample implementation here.
-
Create a new class implementing the
org.wso2.am.analytics.publisher.reporter.MetricReporterinterface and override its methods.You can find a sample implementation here.
Step 1.3 - Build the project
- Navigate to the project root directory.
-
Build the project by executing the following command.
Step 2 - Deploy the Event Publisher
After the project is implemented and built, you need to deploy and configure the resulting library within WSO2 API Manager. This section will guide you through the steps required to deploy and configure the above-created library in WSO2 API Manager Gateway.
Follow the instructions below to configure WSO2 API Gateway for the sample created above:
API Manager Gateway
Follow the instructions below to configure WSO2 API Gateway for the sample created above:
- Copy the JAR file to the
<API-M_HOME>/repository/components/libdirectory. -
Open the
<API-M_HOME>/repository/conf/deployment.tomlfile in a text editor and modify theapim.analyticssection as follows: -
Open the
<API-M_HOME>/repository/conf/log4j2.propertiesfile in a text editor and do the following modifications.-
Add
reporterto the loggers list. -
Add the following configurations after the loggers.
-
Step 3 - Visualize analytics data
After publishing the analytics data, the next step is to visualize them in a manner in which the end-user can get more information out of it. WSO2 API Manager logs are structured in a way that allows us to easily plug them into a visualization tool to visualize them.
This section will guide you through the steps required to visualize the published data in a data visualization platform. For this guide, ELK is used as the data visualization platform.
Step 3.1 - Set up ELK
Step 3.1.1 - Install the Elasticsearch
-
Install Elasticsearch based on your operating system.
-
Make sure Elasticsearch is up and running.
Step 3.1.2 - Install Kibana
-
Install Kibana based on your operating system.
-
Launch the Kibana web interface.
Step 3.1.3 - Install Filebeat
-
Install Filebeat based on your operating system.
-
Connect to Elastic Stack.
Step 3.1.4 - Collect Log Data
-
Add the following configurations to feed WSO2 API-M logs in to Filebeat.
-
Start Filebeat.
Step 3.2 - View analytics data on Kibana
Filebeat comes with pre-built Kibana dashboards and UIs for visualizing log data.
Step 3.2.1 - Configure the visualization
[Launch Kibana and discover](https://www.elastic.co/guide/en/beats/filebeat/7.13/filebeat-installation-configuration.html#view-data) log data.
Once you have followed and completed the above steps successfully, you will be able to visualize log data as follows.
[](https://apim.docs.wso2.com/en/4.3.0/assets/img/analytics/samples/logs-listed-in-kibana.png)Step 3.2.2 - Filter total analytics traffic
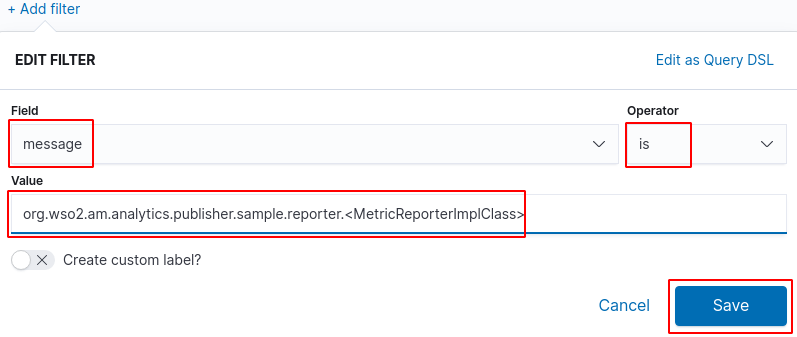
The total analytics traffic can be visualized by applying a filter as follows:
Replace <MetricReporterImplClass> with the class name given to the MetricReporter implementation class that you have created with your sample.
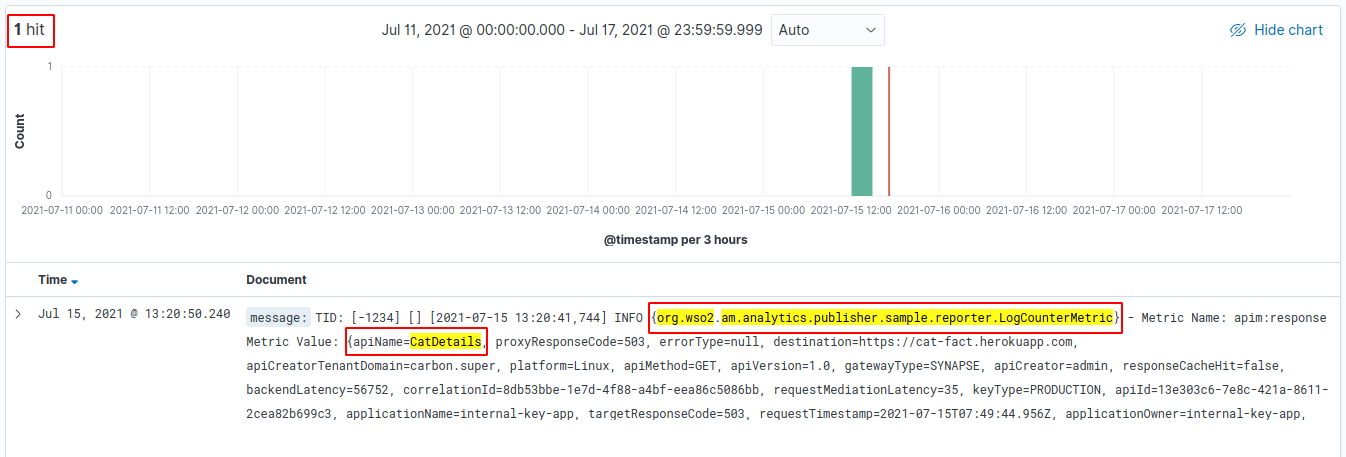
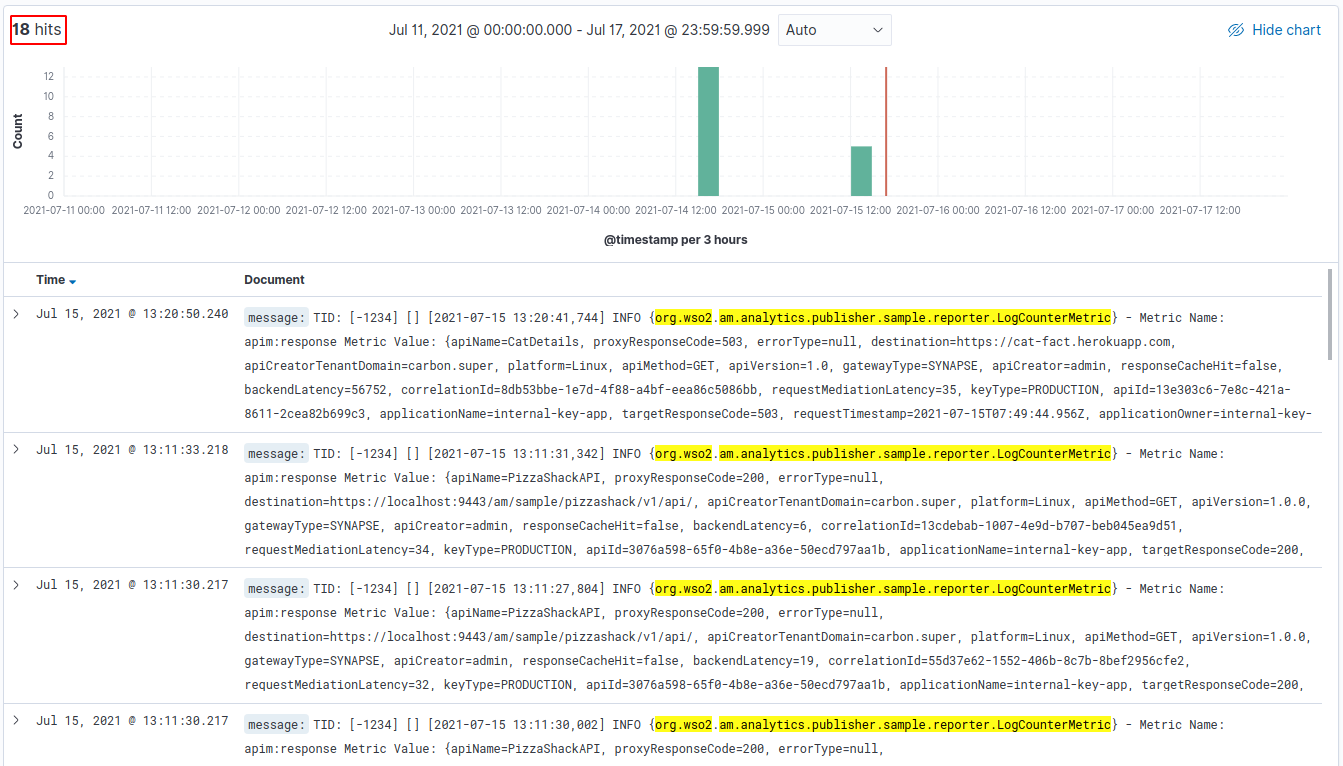
After applying this filter you will be able to visualize analytics traffic as shown below.
Step 3.2.3 - Optionally, filter analytics traffic for a specific API
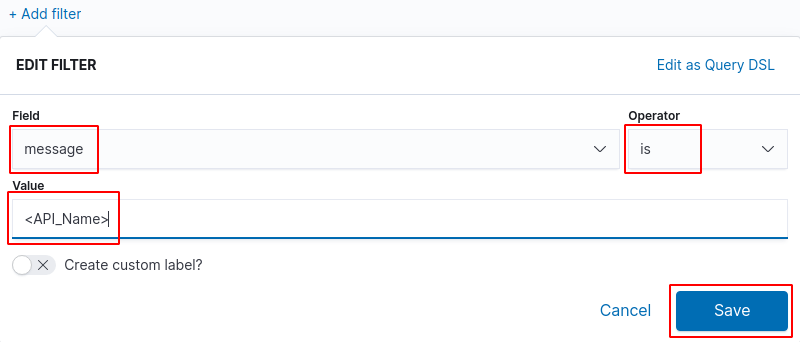
The analytics traffic for a specific API can be visualized by applying a filter on top of the above filter as follows:
Replace <API_Name> with the name of the API in which you want to visualize traffic.
After applying this filter you will be able to visualize the analytics traffic for a specific API as shown below. In the logs you will notice that both the filters are applied.