Viewing Cloud Native Observability Statistics
Let's use the dashboards from the cloud-native observability deployment to monitor statistics from your integration artifacts.
Before you begin
Set up the suitable cloud-native observability deployment. The dashboards described in this section apply to all the cloud-native deployment strategies.
See the following topics for information and instructions:
Tip
If you do not know which dashboard to download when setting up cloud-native observability, check the "Downloading the dashboard" section in the respective sub-sections below for details on the dashboard.
- Setting up cloud-native observability for a VM environment.
- Setting up cloud-native observability for a Kubernetes environment.
Cluster dashboard
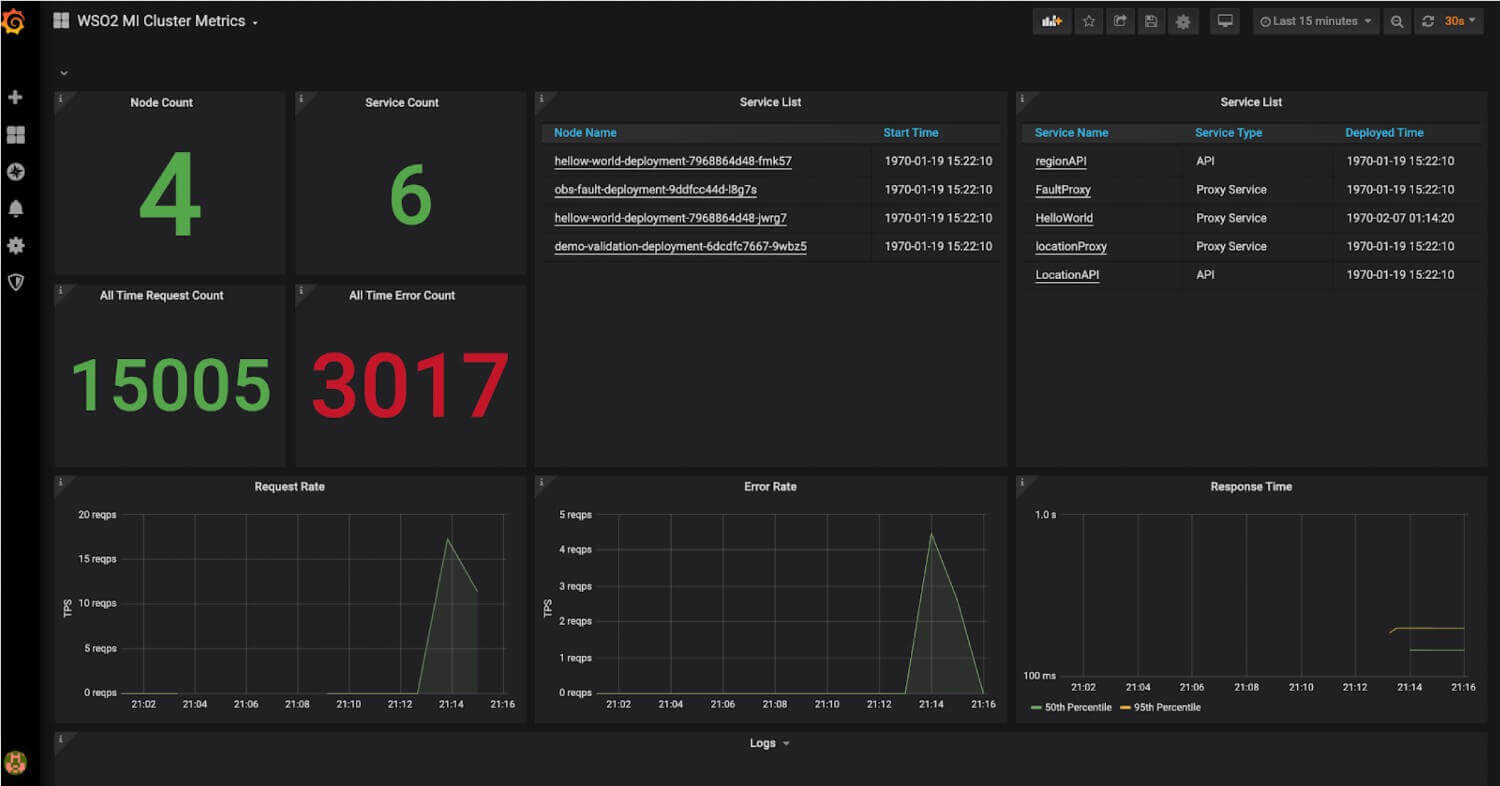
Cluster dashboards visualize the overall statistics relating to your Micro Integrator cluster. You can view information related to your MI cluster.
Downloading the dashboard
You can download the dashboard from the Grafana Labs - WSO2 Integration Cluster Metrics.
Statistic types
The following is the list of widgets displayed in this dashboard.
| Widget | Description |
|---|---|
| Node Count | The total number of nodes in the cluster. |
| Service Count | The total number of services deployed in the cluster. |
| Node List | The list of nodes in the cluster. The time at which the node started is displayed together with the node name. You can click on a node to open the MI Node Metrics dashboard, which displays statistics specific to the selected node. |
| Service List | The list of services deployed in the cluster. The service type and the deployment time are displayed for each service. The service can be a proxy service or a REST API. You can click on a proxy service to view statistics specific to it in the WSO2 Proxy Service Metrics dashboard. You can click on a REST API service to view statistics specific to it in the WSO2 API Metrics dashboard. |
| All Time Request Count | The total number of requests handled by the cluster. |
| All Time Error Count | The total number of errors that have occurred for requests handled by the cluster. |
| Request Rate | This is a graphical representation of the number of requests handled by the cluster against time. |
| Error Rate | This is a graphical representation of the number of errors that have occurred for the cluster against time. |
| Response Time | The amount of time taken by the cluster to respond to a request against time. |
Purpose
This dashboard serves the following purposes:
-
It provides an overview of how the cluster as a whole performs in terms of the successful execution of requests and the response time.
-
It also provides the basic details of the nodes and services deployed in the cluster. This can indicate how each node/service affects the overall cluster performance. e.g., If the Error Rate widget indicates a surge in the error rate at a particular time, you can identify a node/service that started at around the same time (as shown by the Node List and Service List widgets) as a possible cause of it.
-
It provides access to other dashboards that display statistics related to specific nodes and services so that you can carry out further analysis relating to the performance of your Micro Integrator setup.
Recommended action
-
Identify the times at which the error rate and/or the response time has been rising. Depending on the time, you can investigate the cause of if (e.g., a node/service that started around the same time).
-
Click on the nodes/services that you have identified as nodes/services to be further analyzed to improve the performance of your Micro Integrator setup, and view the visualizations specific to them.
-
Based on the request count, make the appropriate decisions with regard to the resource allocation (i.e., whether to add or reduce the number of nodes to leave the present number unchanged).
-
Identify the popular services and make business decisions accordingly. For example, if there is a surge in the request rate, you can identify the services that were active during that time. You can analyze such services in more detail by viewing information specific to them and decide whether to invest more in them.
Node dashboard
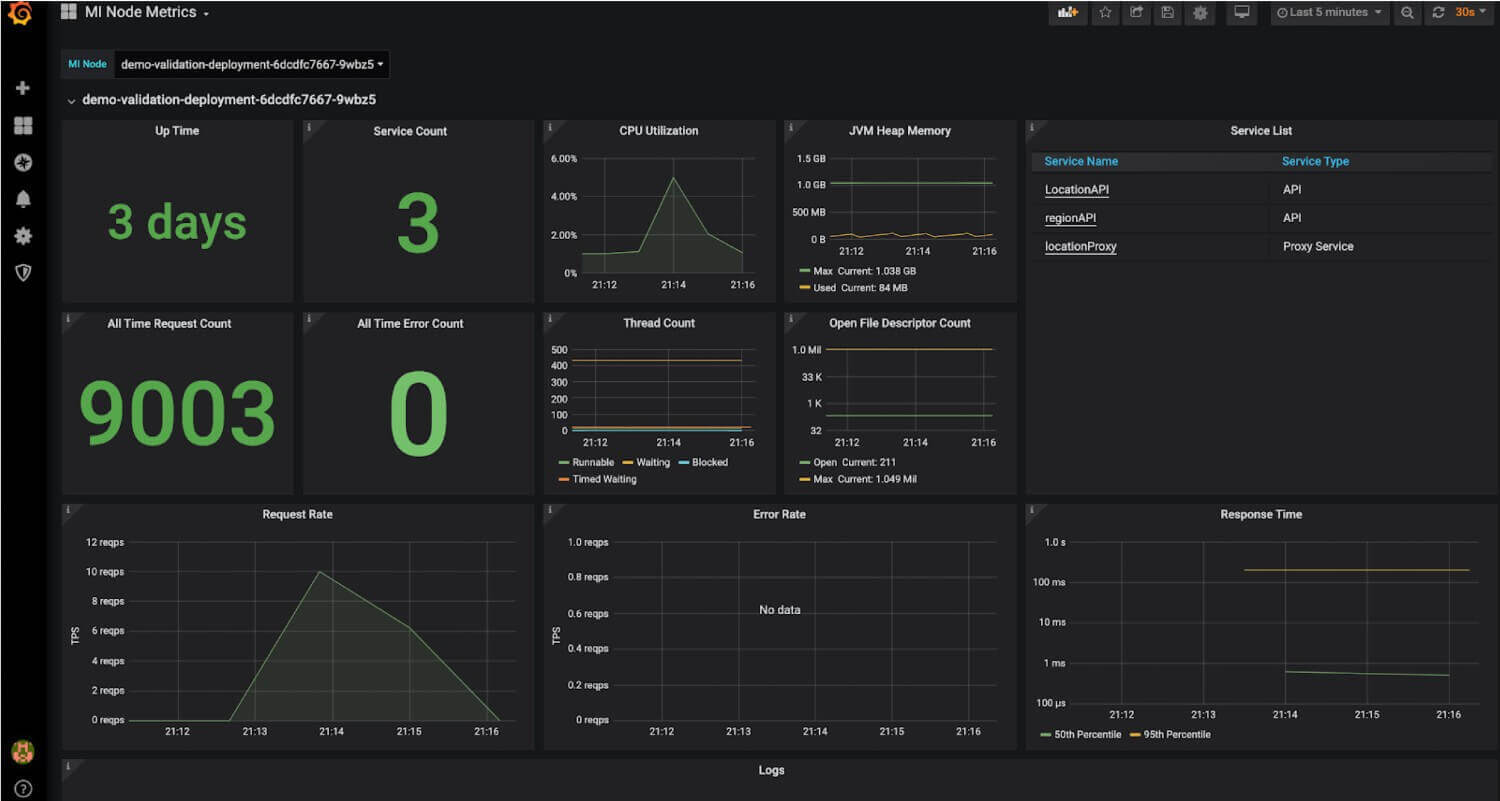
This displays statistics specific to a selected node.
Downloading the dashboard
You can download the dashboard from the Grafana Labs - WSO2 Integration Node Metrics.
Statistic types
The following is the list of widgets displayed in this dashboard.
| Widget | Description |
|---|---|
| Up Time | The time duration that has elapsed since the node became active for the current session. |
| Service Count | The number of services (i.e., proxy services and REST API services) that are currently deployed in the node. |
| All Time Request Count | The total number of requests received by the node after it became a member of the current Micro Integrator setup. |
| All Time Error Count | The total number of requests handled by the node that have resulted in errors. |
| CPU Utilization | A visualization of the node's CPU consumption over time. |
| JVM Heap Memory | A visualization of the amount of JVM heap memory consumed by the node over time. |
| Thread Count | A visualization of the number of threads allocated to the node over time. |
| Open File Descriptor Count | |
| Services List | The complete list of services (i.e., proxy services and REST API services) that are currently deployed in the node. |
| Request Rate | A visualization of the total number of requests received by the node over time. |
| Error Rate | A visualization of the total number of requests handled by the node that has resulted in errors over time. |
| Response Time | A visualization of the amount of time taken by the node to respond to requests over time. |
Purpose
The purposes of this dashboard are as follows:
-
It shows the performance of individual nodes in terms of the error count and the response time.
-
It allows you to track the resource consumption of individual nodes and make decisions accordingly (e.g., to allocate more CPU cores, undeploy services with a high throughput if the node does not have sufficient system resources to run them etc.).
-
By clicking on the name of a service deployed in the selected node, you can open the Proxy Service Dashboard and the API Dashboard dashboard (depending on the type of the service) to view statistics specific to the selected service.
Recommended action
-
Evaluate whether the resources allocated to the node (i.e., system memory, CPU cores, etc.) are sufficient/excessive in proportion to the throughput it handles (i.e., the number of requests within a specific duration of time), and make changes accordingly. For example, suppose the number of requests that are handled is less in proportion to the node's capacity in terms of system resources. In that case, you can either reduce the number of resources to reduce your cost or deploy more services in the node to utilize the existing resources in a more optimum manner.
-
Click on the services deployed in the node to view statistics specific to those services. This allows you to evaluate the throughput of each service to analyze further and make decisions on how to deploy the available services in the available nodes in a manner that optimizes the use of resources. It also allows you to identify the services that contribute to the total error count of the node and take appropriate action.
WSO2 Proxy Service Metrics dashboard
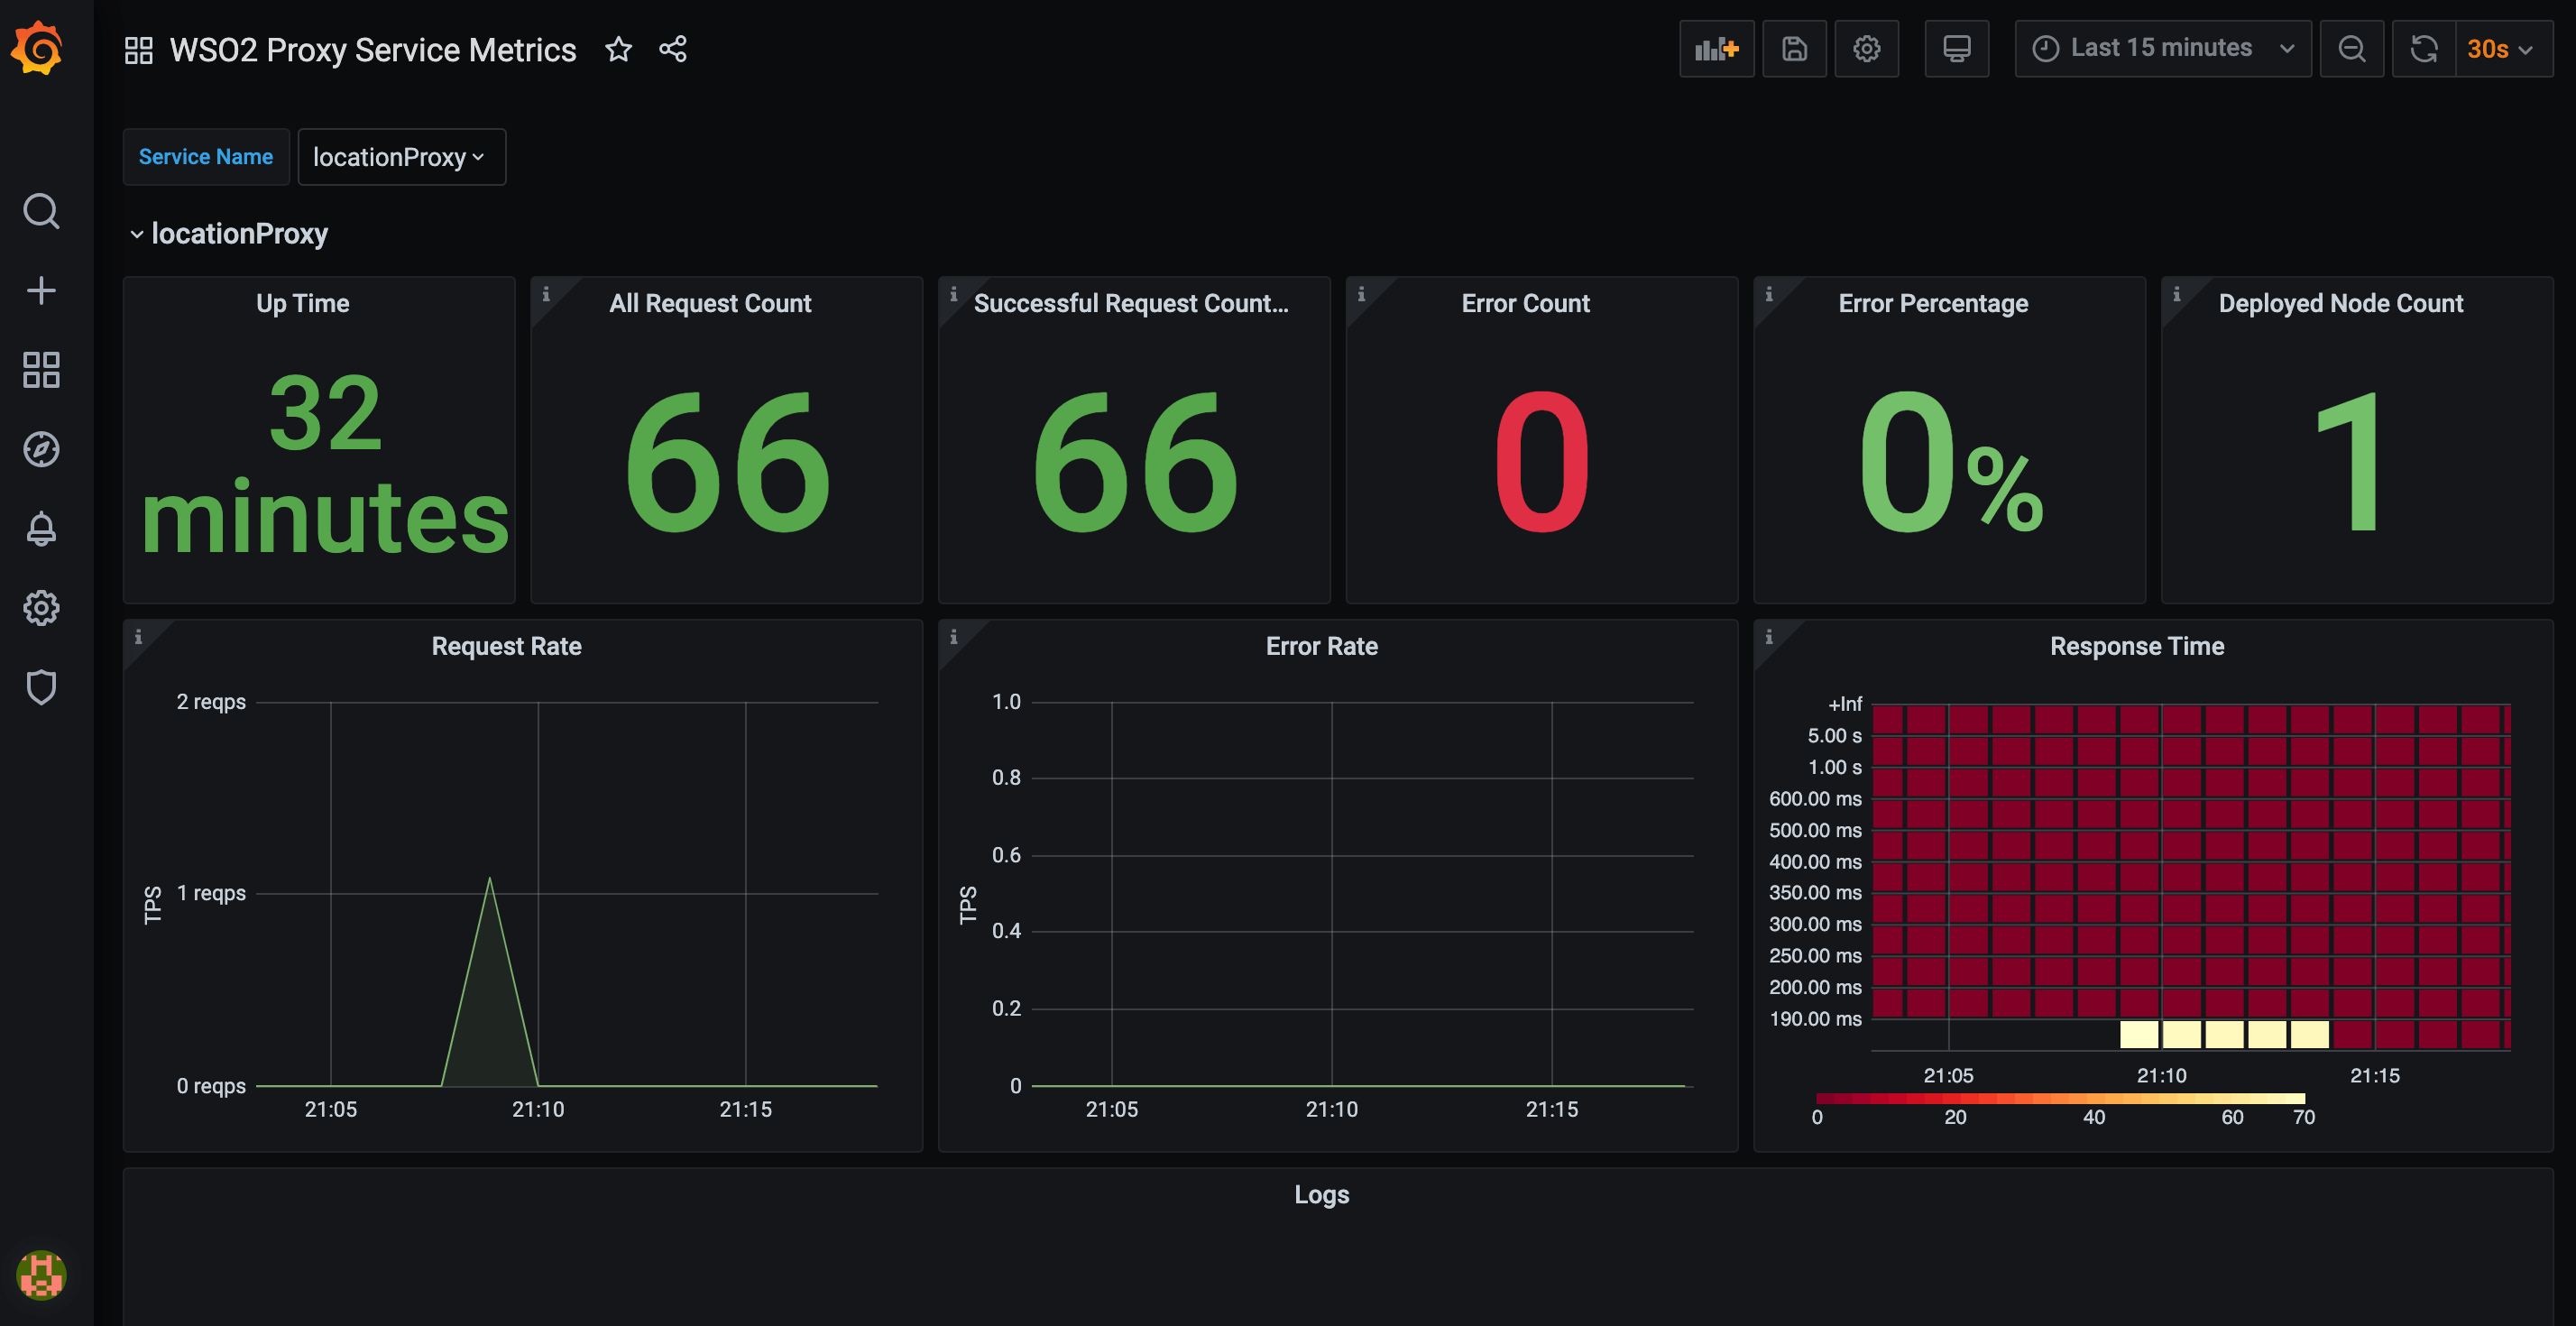
In the Proxy service dashboard, you can view information related to a specific Proxy service.
Downloading the dashboard
You can download the dashboard from the Grafana Labs - WSO2 Proxy Service Metrics.
Statistic types
The following is the list of widgets displayed in this dashboard.
| Widget | Description |
|---|---|
| Up Time | The time duration that has elapsed since the proxy service started running during the current session. |
| All Request Count | The total number of requests received and handled by the proxy service during the selected time interval. |
| Successful Request Count | The total number of requests that were successfully executed by the proxy service during the selected time interval. |
| Error Count | The total number of requests handled by the proxy service during the selected time interval that have resulted in errors. |
| Error Percentage | The requests handled by the proxy service during the selected time interval that have resulted in errors, as a percentage of the total number of requests received by the proxy service during that same time interval. |
| Deployed Node Count | The number of nodes in which the proxy service is deployed. |
| Request Rate | A visualization of the total number of requests handled by the proxy service during the selected time interval. |
| Error Rate | A visualization of the total number of errors that have occurred for the proxy service during the selected time interval. |
| Response Time | A visualization of the time taken by the proxy service to respond to requests during the selected time interval. |
Purpose
The purposes of this dashboard are as follows:
-
To understand the performance of a selected proxy service in terms of the number of requests it processes within a given time duration, the number/percentage of errors that have resulted, and the time taken by the proxy service to respond to requests.
-
To understand the client demand for the related business based on the number of requests received by the proxy service.
Recommended action
-
If the number of requests/response time is too high, deploy the proxy service in more nodes in the cluster so that the throughput is divided.
-
If there are errors, check the mediation flow of the proxy service and make changes to prevent the errors.
WSO2 API Metrics dashboard
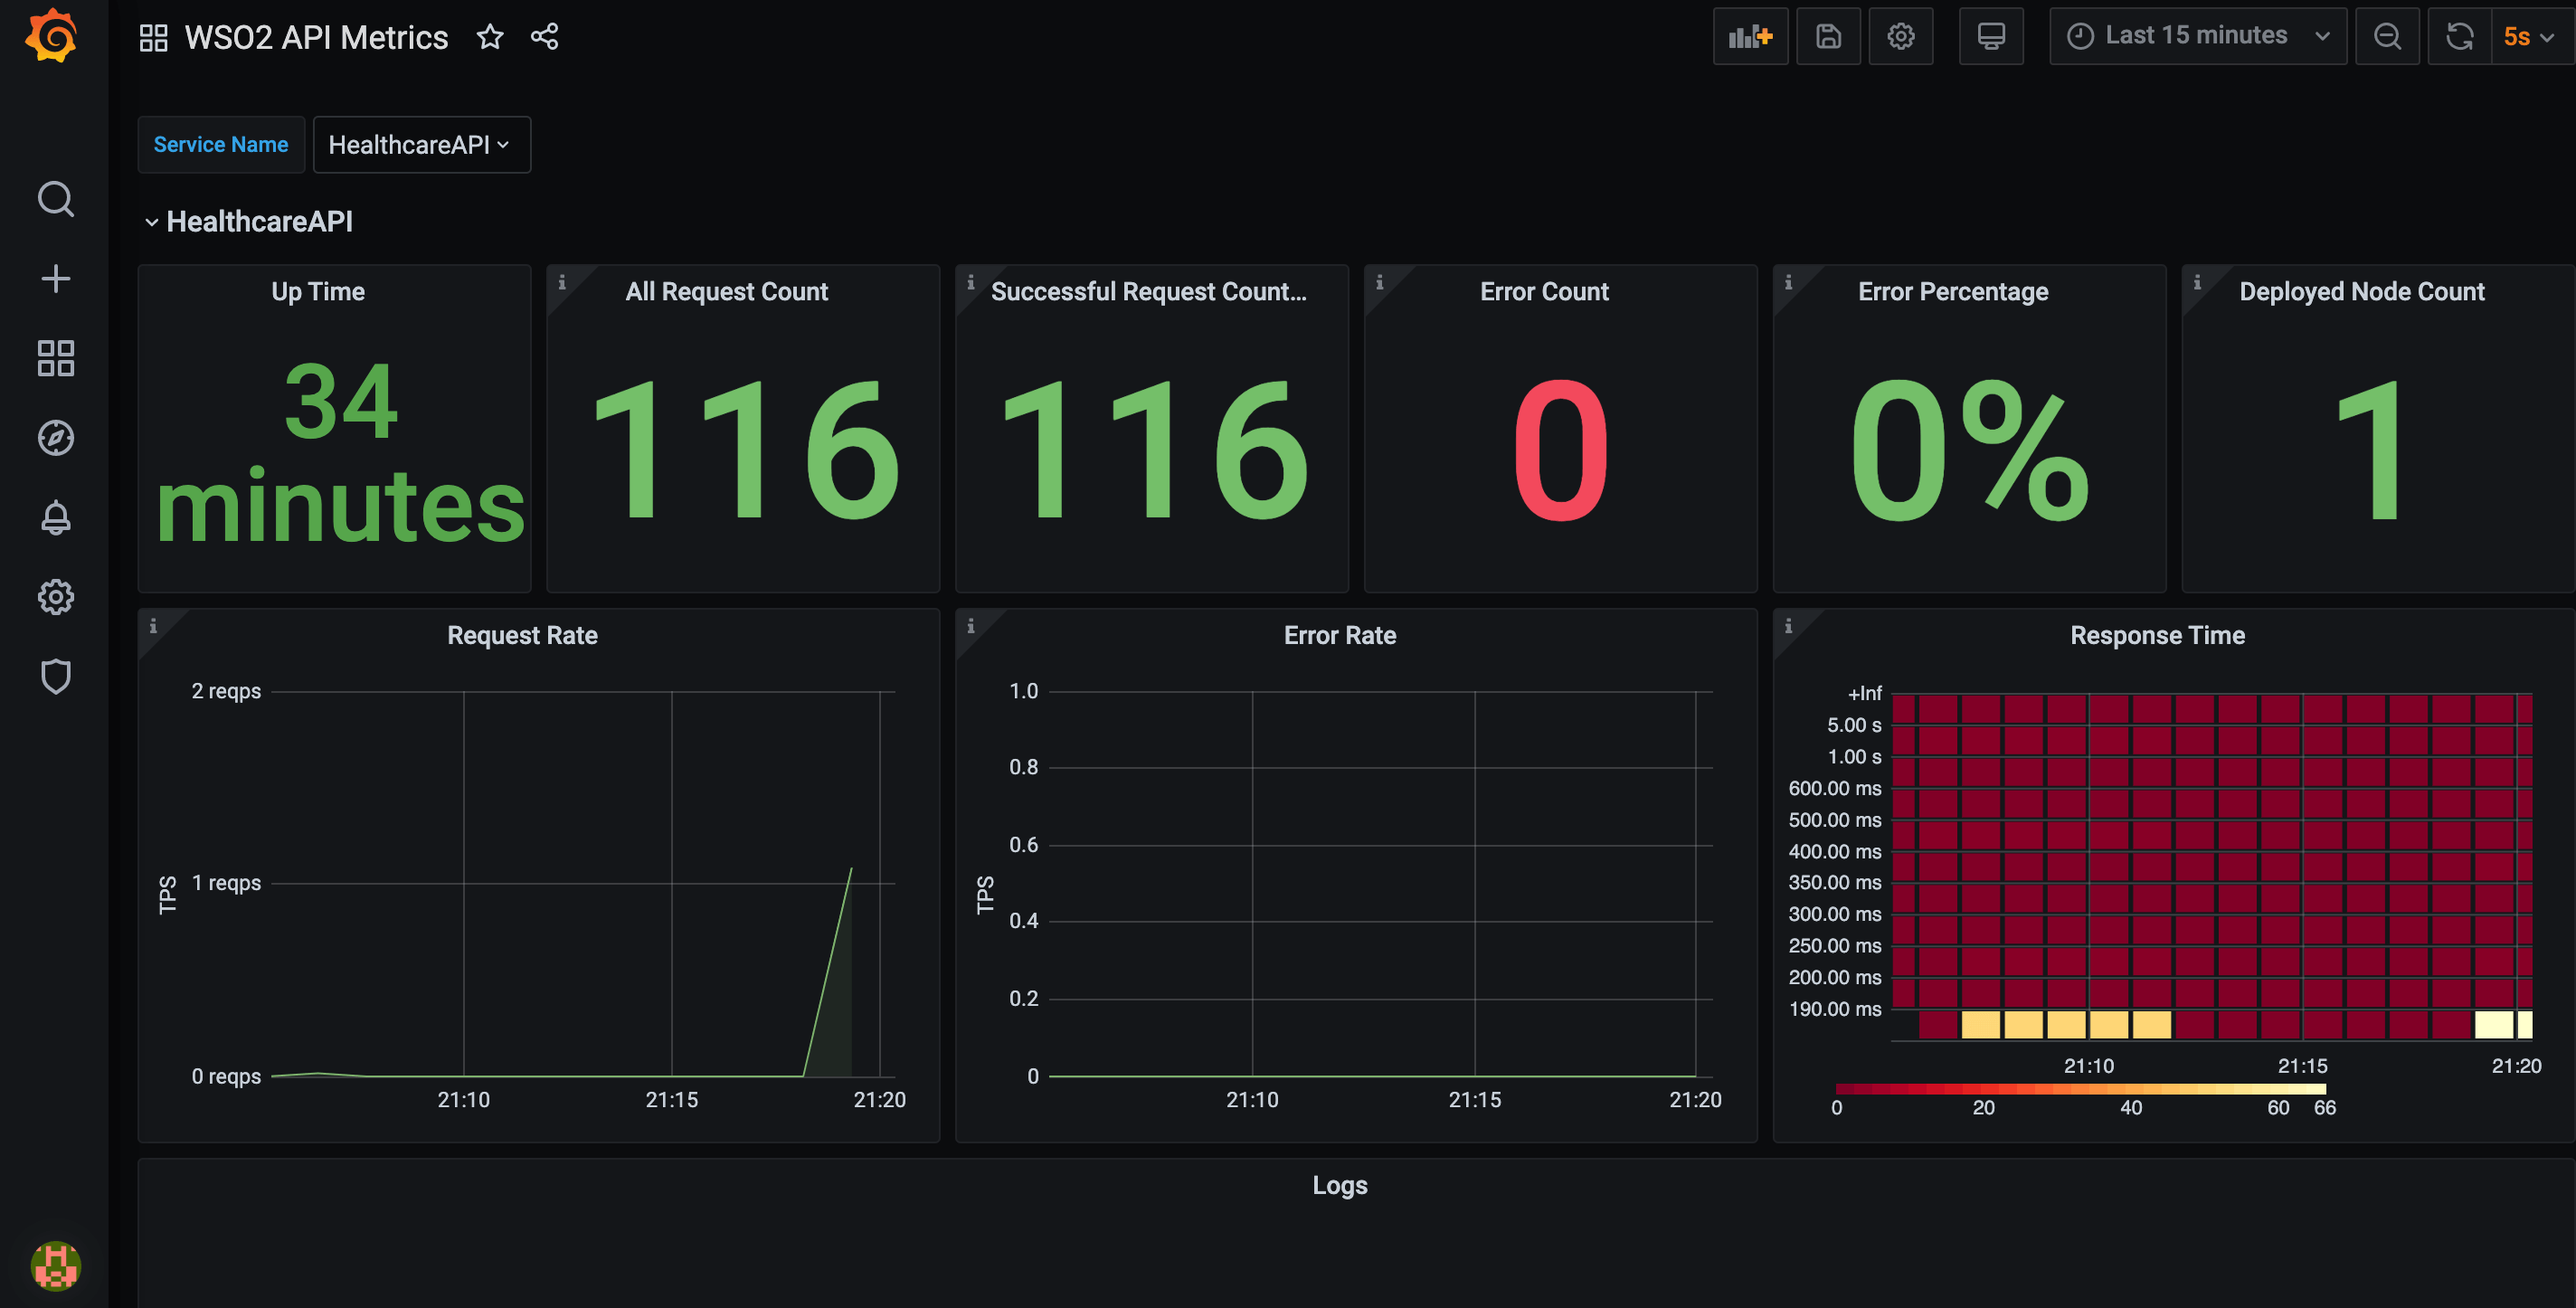
This dashboard displays overall statistics related to a specific API.
Downloading the dashboard
You can download the dashboard from the Grafana Labs - WSO2 API Metrics.
Statistic types
The following is the list of widgets displayed in this dashboard.
| Widget | Description |
|---|---|
| Up Time | The time duration that has elapsed since the API service started running during the current session. |
| All Request Count | The total number of requests received and handled by the API during the selected time interval. |
| Successful Request Count | The total number of requests that were successfully executed by the API during the selected time interval. |
| Error Count | The total number of requests handled by the API during the selected time interval that have resulted in errors. |
| Error Percentage | The requests handled by the API during the selected time interval that have resulted in errors, as a percentage of the total number of requests received by the API during that same time interval. |
| Deployed Node Count | The number of nodes in which the API service is deployed. |
| Request Rate | A visualization of the total number of requests handled by the API service during the selected time interval. |
| Error Rate | A visualization of the total number of errors that have occurred for the API service during the selected time interval. |
| Response Time | A visualization of the time taken by the API service to respond to requests during the selected time interval. |
Purpose
-
To understand the performance of a selected API service in terms of the number of requests it processes within a given time duration, the number/percentage of errors that have resulted, and the time taken by the API service to respond to requests.
-
To understand the client demand for the related business based on the number of requests received by the API service.
Recommended action
-
If the number of requests/response time is too high, deploy the API service in more nodes in the cluster so that the throughput is divided.
-
If there are errors, check the mediation flow of the API service and make changes to prevent the errors.
WSO2 Inbound Endpoint Metrics dashboard
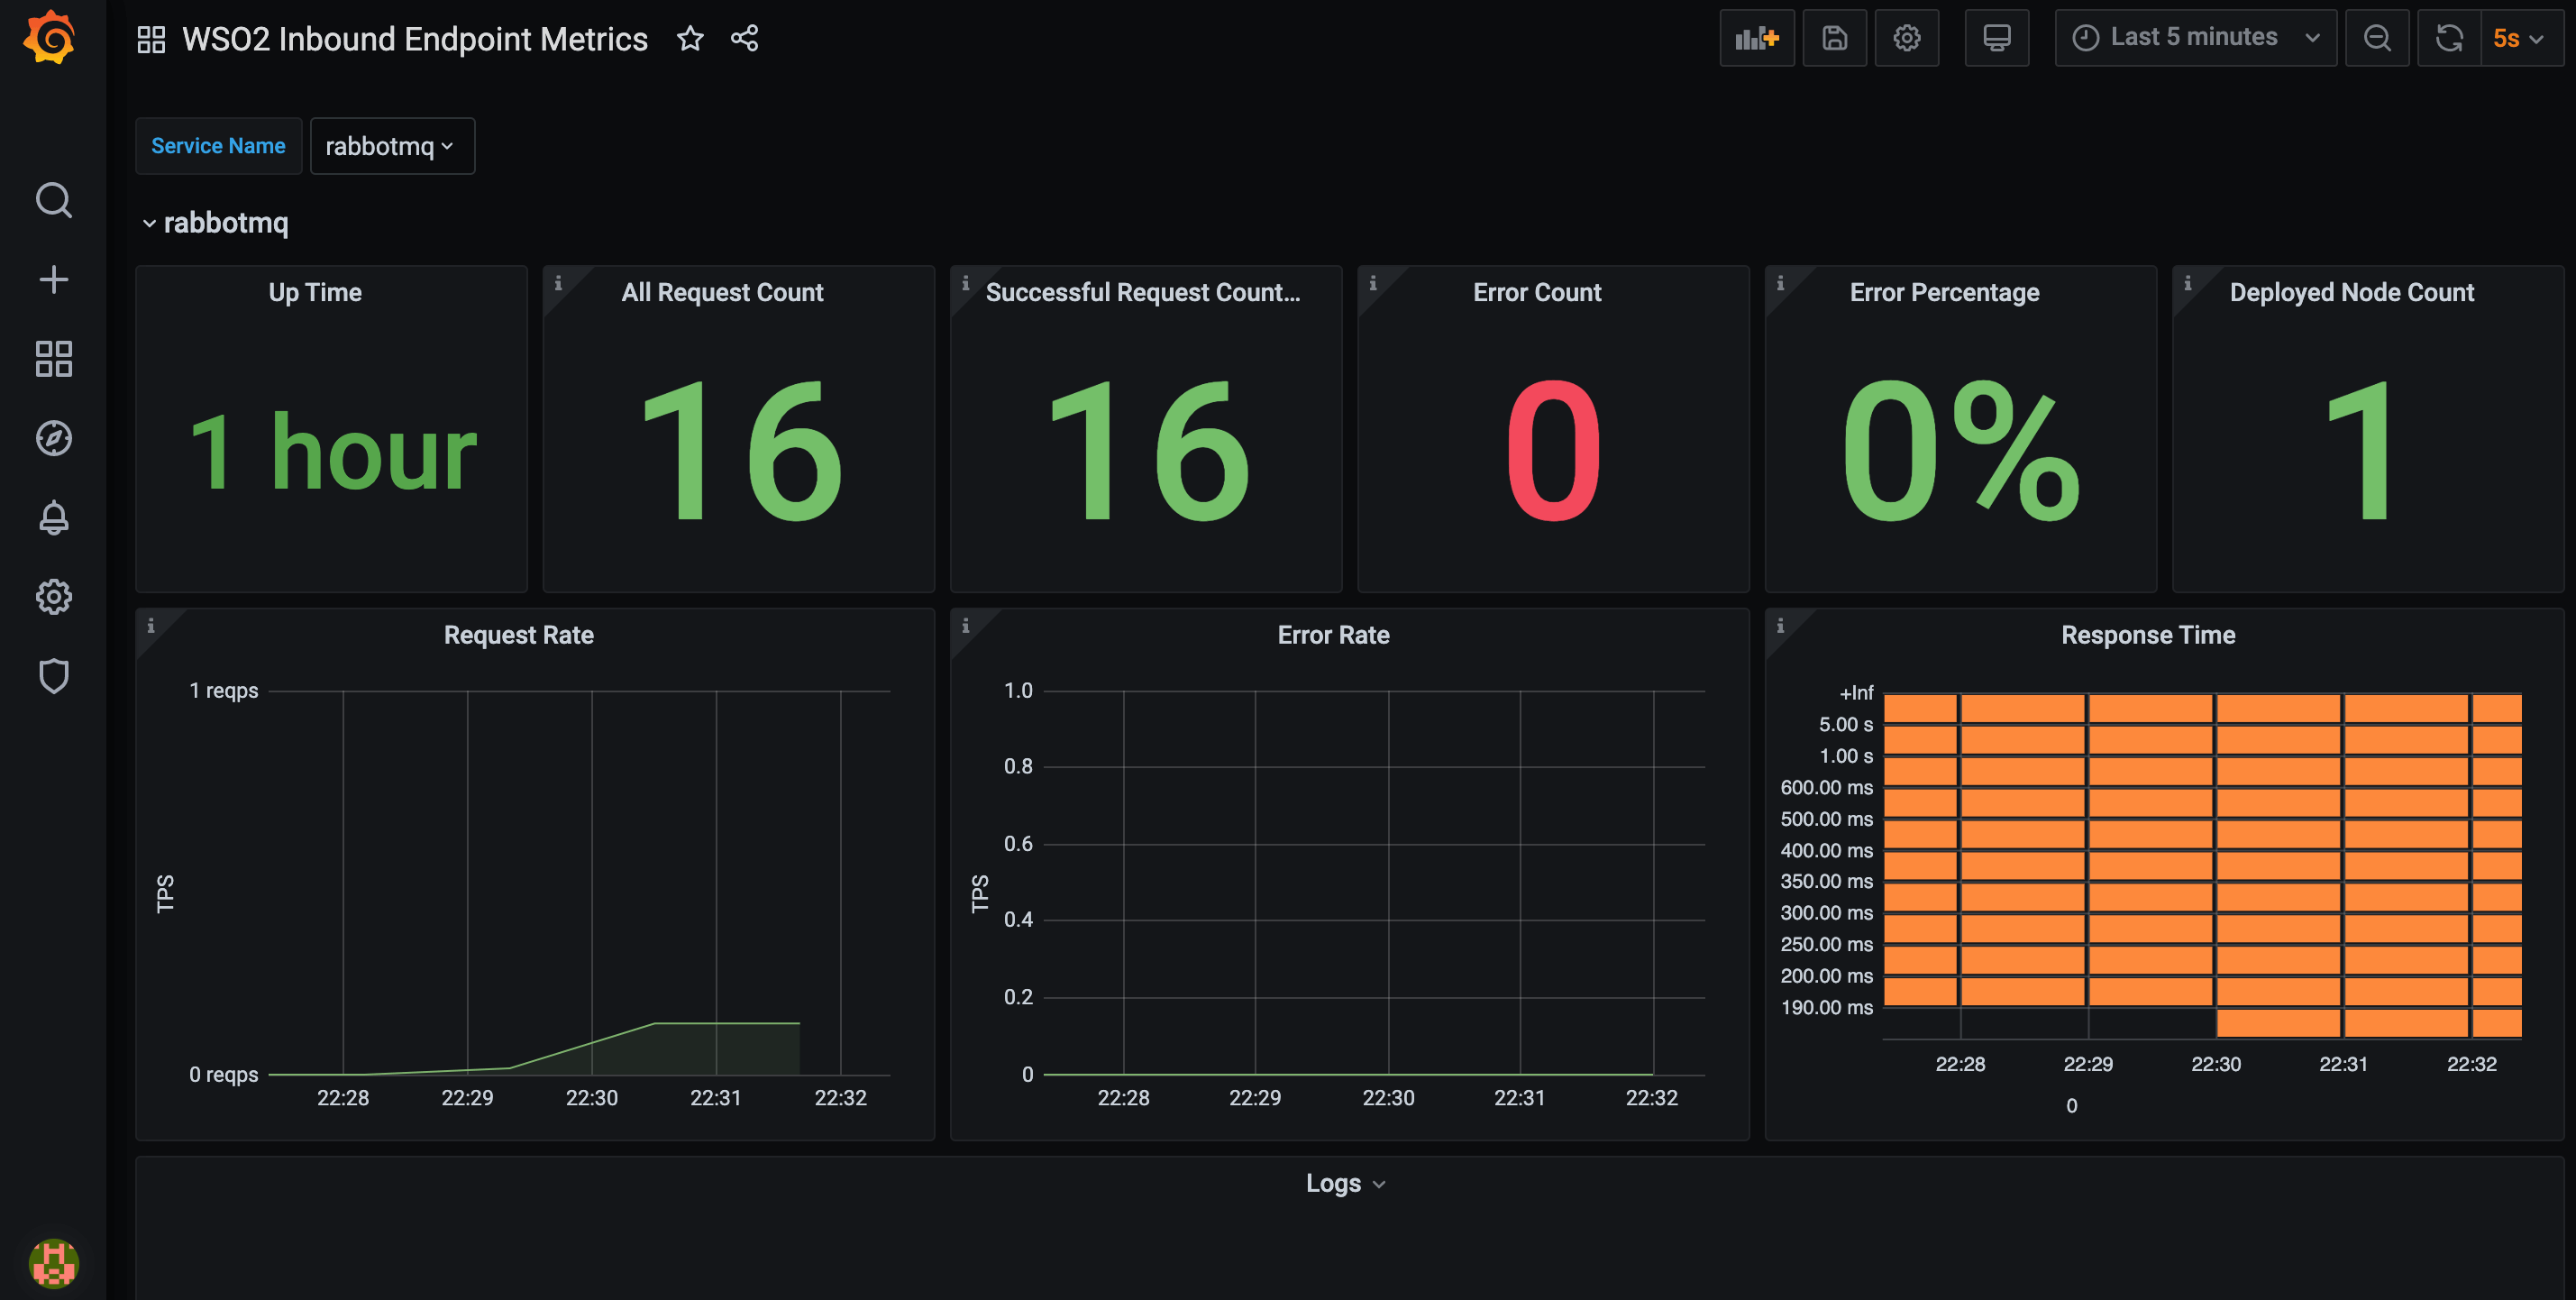
At a given time, the Inbound endpoint dashboard displays the overall statistics related to a selected endpoint. You can view information related to a specific Inbound endpoint. We can download this dashboard from here. In this dashboard, it will show us Up Time, All Request Count, Successful Request Count, Error Count, Error Percentage, Deployed Node Count, Request Rate, Error Rate and Response Time.
Downloading the dashboard
You can download the dashboard from the Grafana Labs - WSO2 Inbound Endpoint Metrics.
Statistic types
The following is the list of widgets displayed in this dashboard.
| Widget | Description |
|---|---|
| Up Time | The time duration that has elapsed since the inbound endpoint became active during the current session. |
| All Request Count | The total number of requests received and handled by the inbound endpoint during the selected time interval. |
| Successful Request Count | The total number of requests that were successfully executed by the inbound endpoint during the selected time interval. |
| Error Count | The total number of requests handled by the inbound endpoint during the selected time interval that have resulted in errors. |
| Error Percentage | The requests handled by the inbound endpoint during the selected time interval that have resulted in errors, as a percentage of the total number of requests received by the endpoint during that same time interval. |
| Deployed Node Count | The number of nodes in which the inbound endpoint is deployed. |
| Request Rate | A visualization of the total number of requests handled by the inbound endpoint during the selected time interval. |
| Error Rate | A visualization of the total number of errors that have occurred for the inbound endpoint during the selected time interval. |
| Response Time | A visualization of the time taken by the inbound endpoint to respond to requests during the selected time interval. |
