Publishing Analytics Events to External Systems
Introduction
Instead of publishing analytics events to the cloud, It is also possible to log the same events and publish them to external systems. This guide will explain the steps required to do it. For demonstration purposes, we have selected ELK as the external system.
This section will cover the steps required to create a sample, configure the created sample with WSO2 API-M or Choreo Connect, and then publish it to an external System (ELK).
Creating the Sample
You have to create a new Java/Maven project.
With the use of WSO2 Analytics Publisher extension which is available at WSO2 nexus repository it is possible to create the sample. Created sample can be used to log and publish analytics events to external systems.
There is an already created sample and if you wish to use that sample instead of developing the sample from scratch, then you can ignore the steps of creating the sample and start from here.
This section will cover how to configure the pom.xml, class implementations and building the created sample.
Configuring pom.xml
Add wso2-nexus repository to pom.xml,
<repository>
    <id>wso2-nexus</id>
    <name>WSO2 internal Repository</name>
    <url>https://maven.wso2.org/nexus/content/groups/wso2-public/</url>
    <releases>
        <enabled>true</enabled>
        <updatePolicy>daily</updatePolicy>
        <checksumPolicy>ignore</checksumPolicy>
    </releases>
</repository>
Add dependency,
<dependency>
    <groupId>org.wso2.am.analytics.publisher</groupId>
    <artifactId>org.wso2.am.analytics.publisher.client</artifactId>
    <version>1.0.1</version>
</dependency>
Implementing Required Classes
CounterMetric Implementation Class
Accumulated analytics data can be logged with the use of a class of type CounterMetric. Therefore, it is required to implement a class from the CounterMetric interface. By overriding the incrementCount method it is possible to log analytics data.
In order to achieve this behavior, create a class implementing the CounterMetric Interface of org.wso2.am.analytics.publisher.reporter and override its methods.
Implementation of this class should look something similar to this.
MetricReporter Implementation Class
Analytics data can be published to outside only through a class of type MetricReporter.
Therefore, it is required to implement a class from MetricReporter Interface.
By overriding the createCounterMetric Method of MetricReporter interface it is possible to return an instance of CounterMetercImplClass created with the above step. This gives the opportunity to log analytics data accumulated.
In order to achieve this behavior, create a class implementing the MetricReporter Interface of org.wso2.am.analytics.publisher.reporter and override its methods.
Implementation of this class should look something similar to this.
Build the Project
Build the project using,
mvn clean installConfiguring the Sample
This section will cover the steps required to configure WSO2 API-M Gateway and Choreo Connect for the sample created above. The steps covered are adding the .jar file, configuring the deployment.toml file, and enabling the logs.
Warning
Note that WSO2 API Manager 3.0.0, 3.1.0, 3.2.0, and 4.0.0 are affected by the Log4j2 zero-day vulnerability, which has been reported to WSO2 on 10th December 2021. You can mitigate this vulnerability in your product by following our instructions and guidelines.
i) Adding the .jar file.

    Place the created .jar file inside the `wso2am-4.0.0/repository/components/lib` directory.

ii) Configuring the deployment.toml file.

    Edit `apim.analytics` configurations in the `deployment.toml` file located inside `wso2am-4.0.0/repository/conf` with the following configuration.

        [apim.analytics]
        enable = true
        properties."publisher.reporter.class" = "<FullyQualifiedClassNameOfMetricReporterImplClass>"
        logger.reporter.level = "INFO"

iii) Enabling Logs

    To enable logging for a reporter, edit `log4j2.properties` file located inside `wso2am-4.0.0/repository/conf` directory.

    a) Add a reporter to the loggers list:

        loggers = reporter, ...(list of other available loggers)

    b) Add the following configurations after the loggers:

        logger.reporter.name = <PackageName>
        logger.reporter.level = INFO
i) Adding the .jar file.

    Place the created .jar file inside the `choreo-connect-1.0.0/docker-compose/resources/enforcer/dropins` directory,

ii) Configuring config.toml

    Edit `analytics` configurations in the `config.toml` located inside `choreo-connect-1.0.0/docker-compose/choreo-connect-with-apim/conf` with the following configuration.

    [analytics]
        enabled = true
        [analytics.enforcer]
        [analytics.enforcer.configProperties]
            authURL = "$env{analytics_authURL}"
            authToken = "$env{analytics_authToken}"
            "publisher.reporter.class" = "org.wso2.am.analytics.publisher.sample.reporter.CustomReporter"

iii) Enabling Logs

    To enable logging for a reporter, edit `log4j2.properties` file located inside `choreo-connect-1.0.0/docker-compose/choreo-connect-with-apim/conf`.

    a) Add an appender to the appenders list:

        appenders = ENFORCER_ANALYTICS, ...(list of other available appenders)

    b) Add the following configurations after the appenders:

        appender.ENFORCER_ANALYTICS.type = RollingFile
        appender.ENFORCER_ANALYTICS.name = ENFORCER_ANALYTICS
        appender.ENFORCER_ANALYTICS.fileName = logs/enforcer_analytics.log
        appender.ENFORCER_ANALYTICS.filePattern = /logs/enforcer_analytics-%d{MM-dd-yyyy}.log
        appender.ENFORCER_ANALYTICS.layout.type = PatternLayout
        appender.ENFORCER_ANALYTICS.layout.pattern = [%d] - %m%ex%n
        appender.ENFORCER_ANALYTICS.policies.type = Policies
        appender.ENFORCER_ANALYTICS.policies.time.type = TimeBasedTriggeringPolicy
        appender.ENFORCER_ANALYTICS.policies.time.interval = 1
        appender.ENFORCER_ANALYTICS.policies.time.modulate = true
        appender.ENFORCER_ANALYTICS.policies.size.type = SizeBasedTriggeringPolicy
        appender.ENFORCER_ANALYTICS.policies.size.size=10MB
        appender.ENFORCER_ANALYTICS.strategy.type = DefaultRolloverStrategy
        appender.ENFORCER_ANALYTICS.strategy.max = 20
        appender.ENFORCER_ANALYTICS.filter.threshold.type = ThresholdFilter
        appender.ENFORCER_ANALYTICS.filter.threshold.level = DEBUG

    c) Add a reporter to the loggers list:

        loggers = reporter, ...(list of other available loggers)

    d) Add the following configurations after the loggers:

        logger.reporter.name = org.wso2.am.analytics.publisher.sample.reporter
        logger.reporter.level = INFO
        logger.reporter.additivity = false
        logger.reporter.appenderRef.rolling.ref = ENFORCER_ANALYTICS
Visualizing Logs
WSO2 API-M logs are structured in a way that we can easily plug them into a log visualization tool in order to visualize them. As a result, this gives the capability to monitor analytics traffic for a particular API. For this purpose, ELK is selected.
Configuring ELK
Installing Elasticsearch
Install Elasticsearch according to your operating system.
Make sure Elasticsearch is up and running.
Installing Kibana
Install Kibana according to your operating system.
Launch the Kibana web interface.
Installing Filebeat
Install Filebeat according to your operating system.
Connect to Elastic Stack.
Collecting Log Data
Add bellow configurations to feed WSO2 API-M logs in to Filebeat,
Replace `<API-M HOME>` with the location of your `API-M Home` directory.

    filebeat.inputs:
    - type: log
    enabled: true
    paths:
- /<API-M HOME>/repository/logs/wso2carbon.logLog data is available in `enforcer_analytics.log`
filebeat.inputs:
- type: log
enabled: true
paths:
- /home/wso2/logs/enforcer_analytics.logSet up assets
In case of a failure with the above command, use below to set up assets,
filebeat -eStart Filebeat
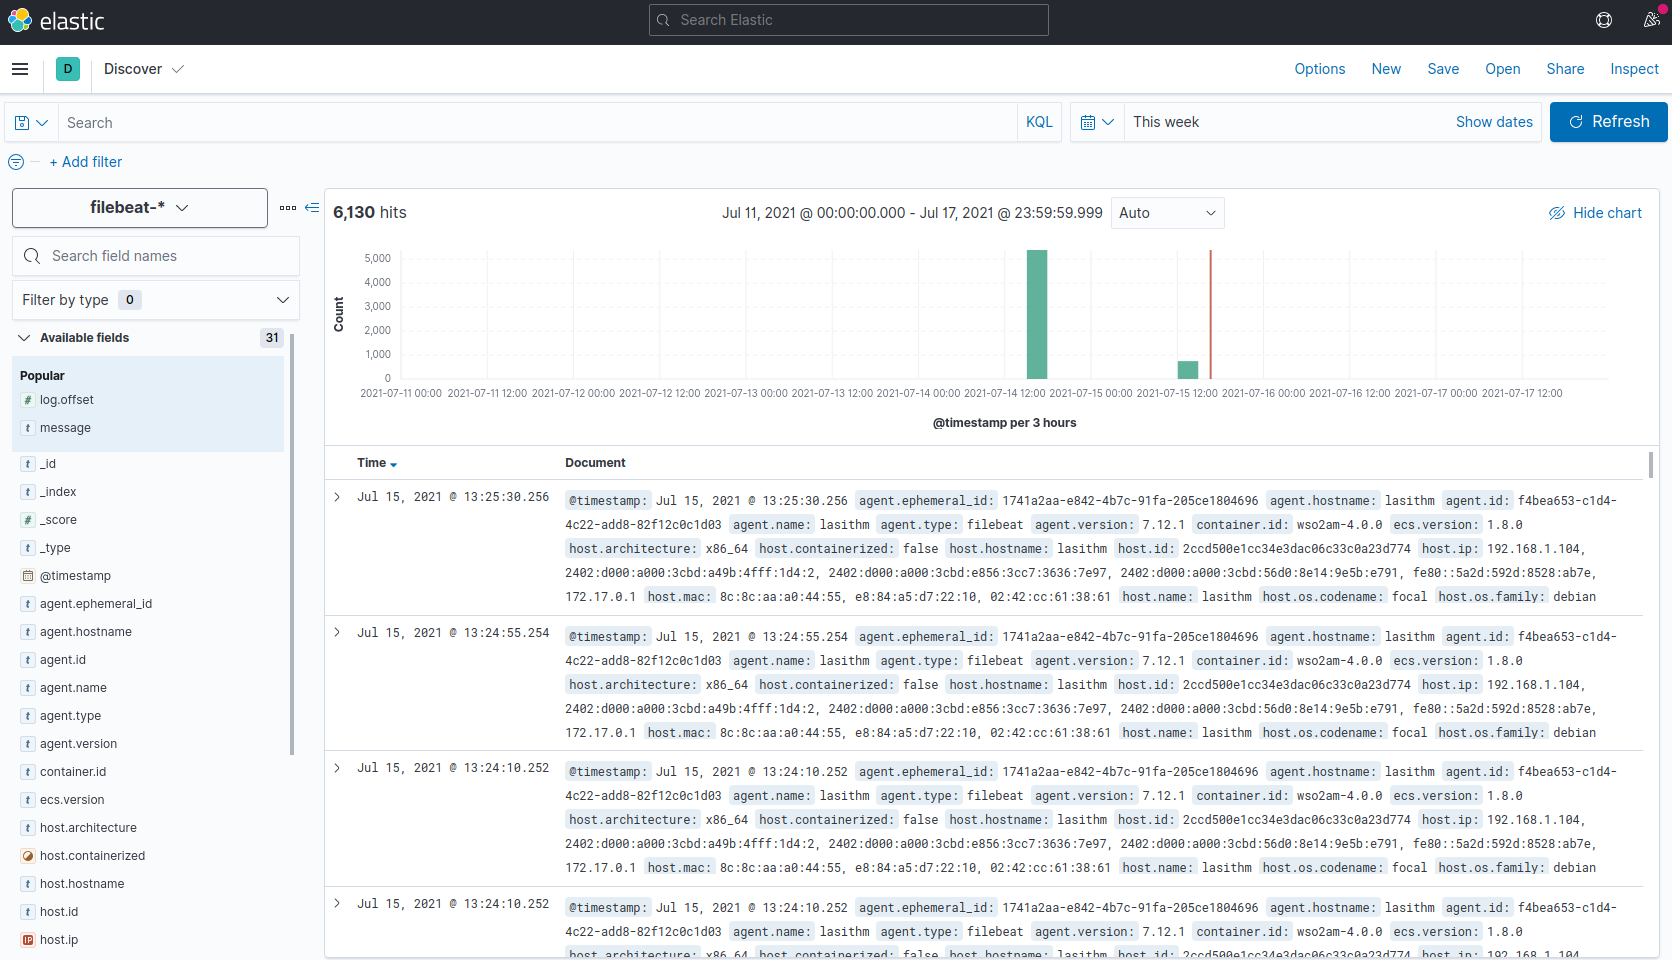
View Data on Kibana
Filebeat comes with pre-built Kibana dashboards and UIs for visualizing log data.
Launch Kibana and discover log data.
Once you have followed and completed the above steps successfully, you will be able to visualize log data as shown below,
Filtering Total Analytics Traffic
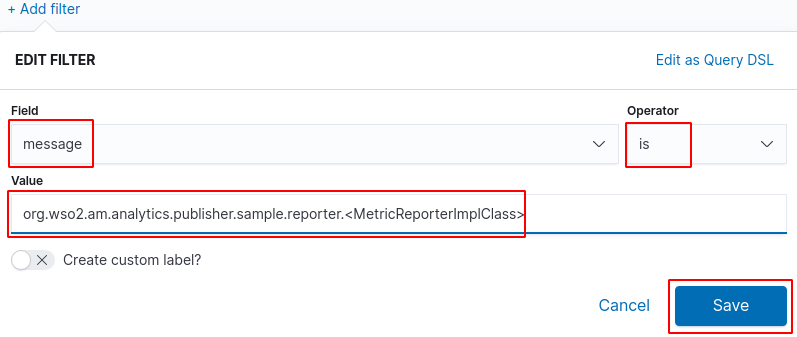
It is possible to view the analytics traffic by applying a filter as shown below,
Replace <MetricReporterImplClass> with the class name given to the MetricReporter implementation class that you have created with your sample.
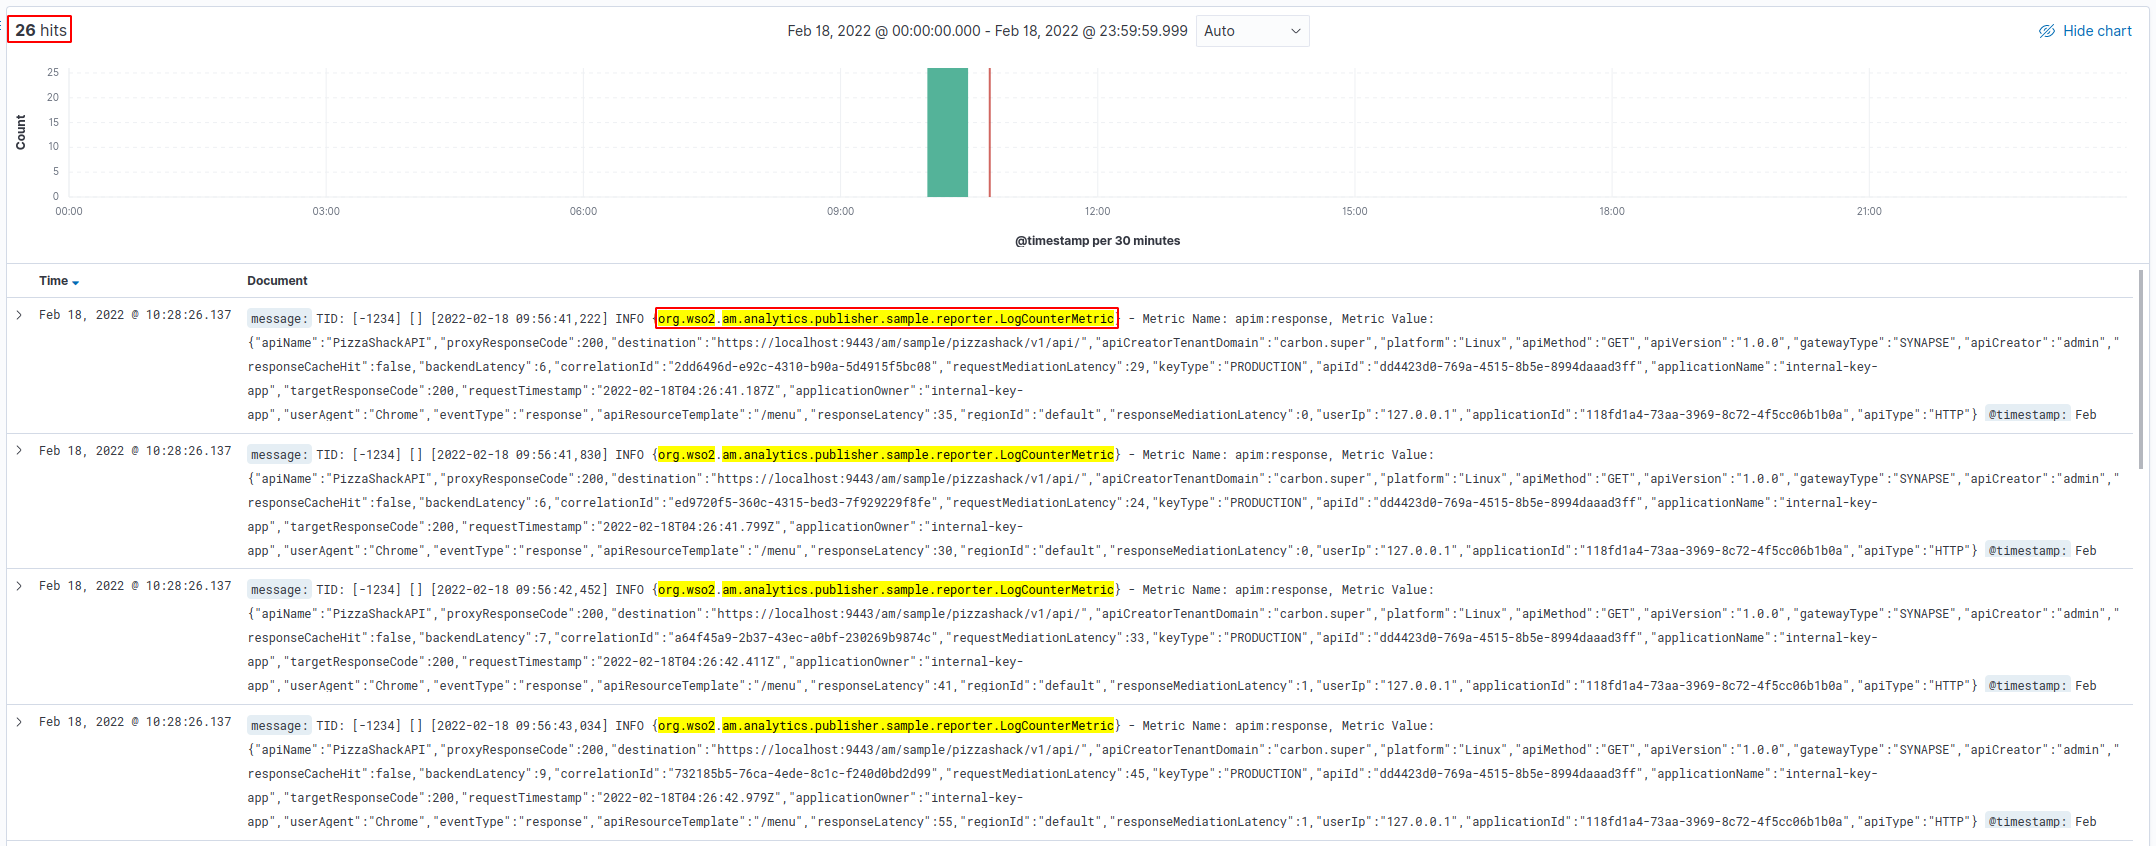
Once this filter is applied you will be able to visualize analytics traffic as shown below,
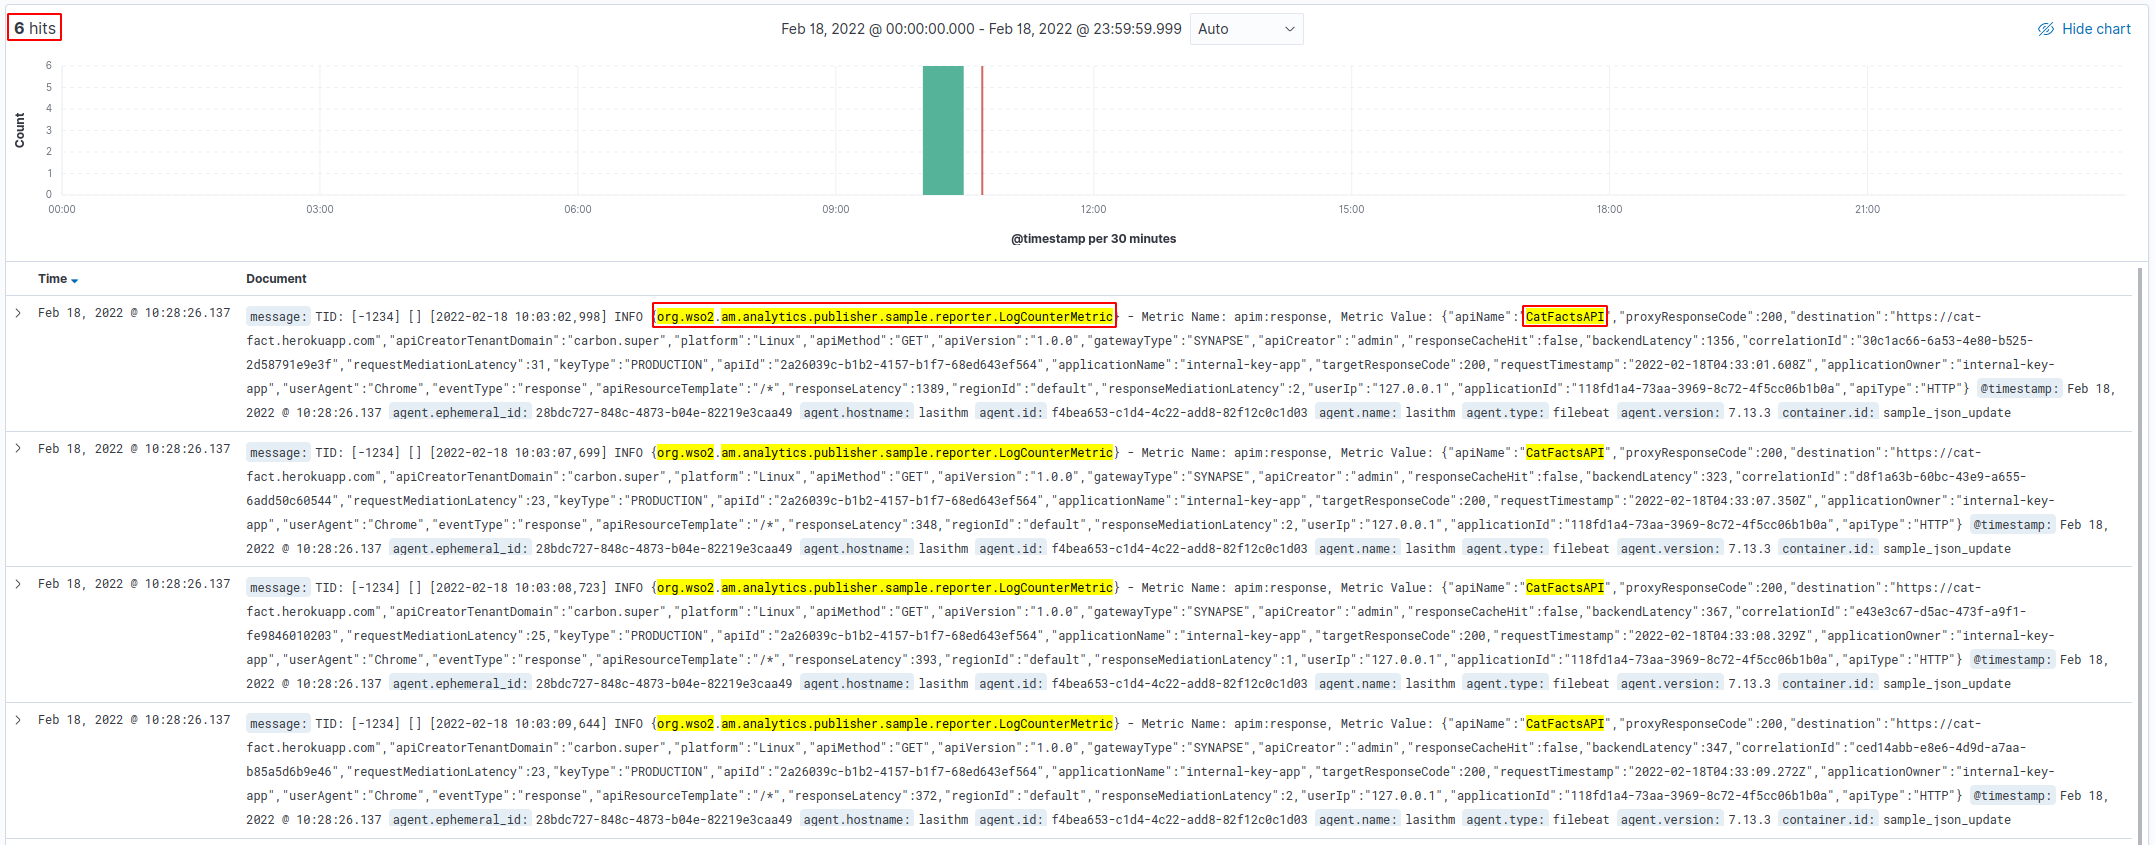
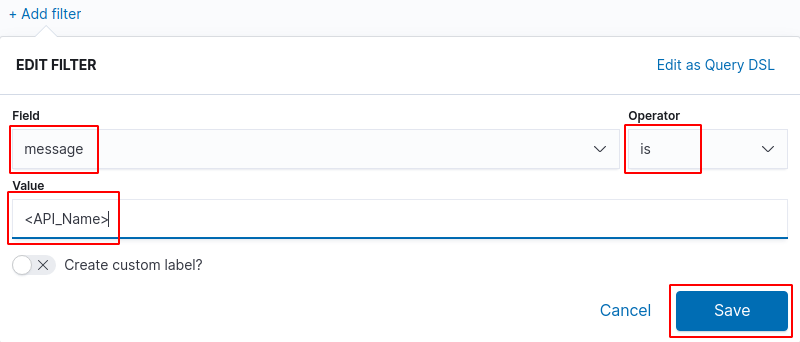
Filtering Analytics Traffic for a Specific API
It is possible to view the analytics traffic for a specific API by applying a filter on top of the above filter as shown below,
Replace <API_Name> with the name of the API in which you want to visualize traffic.
Once this filter is applied you will be able to visualize analytics traffic for a specific API as shown below. And you can notice that both the filters are applied on logs.