Performance Test Results for Router with One CPU
These test results were obtained considering a Choreo Connect deployment with default values. Therefore the concurrency level used for the tests was two. Below table shows resource allocations for the Choreo Connect components.
| Container Name | Requesting Memory Amount (Mi) | Requesting CPU Amount (m) | Limiting Memory Amount (Mi) | Limiting CPU Amount (m) |
|---|---|---|---|---|
| Adapter | 500 | 500 | 500 | 500 |
| Enforcer | 1000 | 1000 | 1000 | 1000 |
| Router | 500 | 1000 | 500 | 1000 |
| Netty Backend | 4096 | 2000 | 6114 | 2000 |
Below graphs depict performance test results considering different test parameters.
Comparison of results
Throughput (requests/sec) vs. concurrent users
The following graph illustrates the throughput against the number of concurrent users.
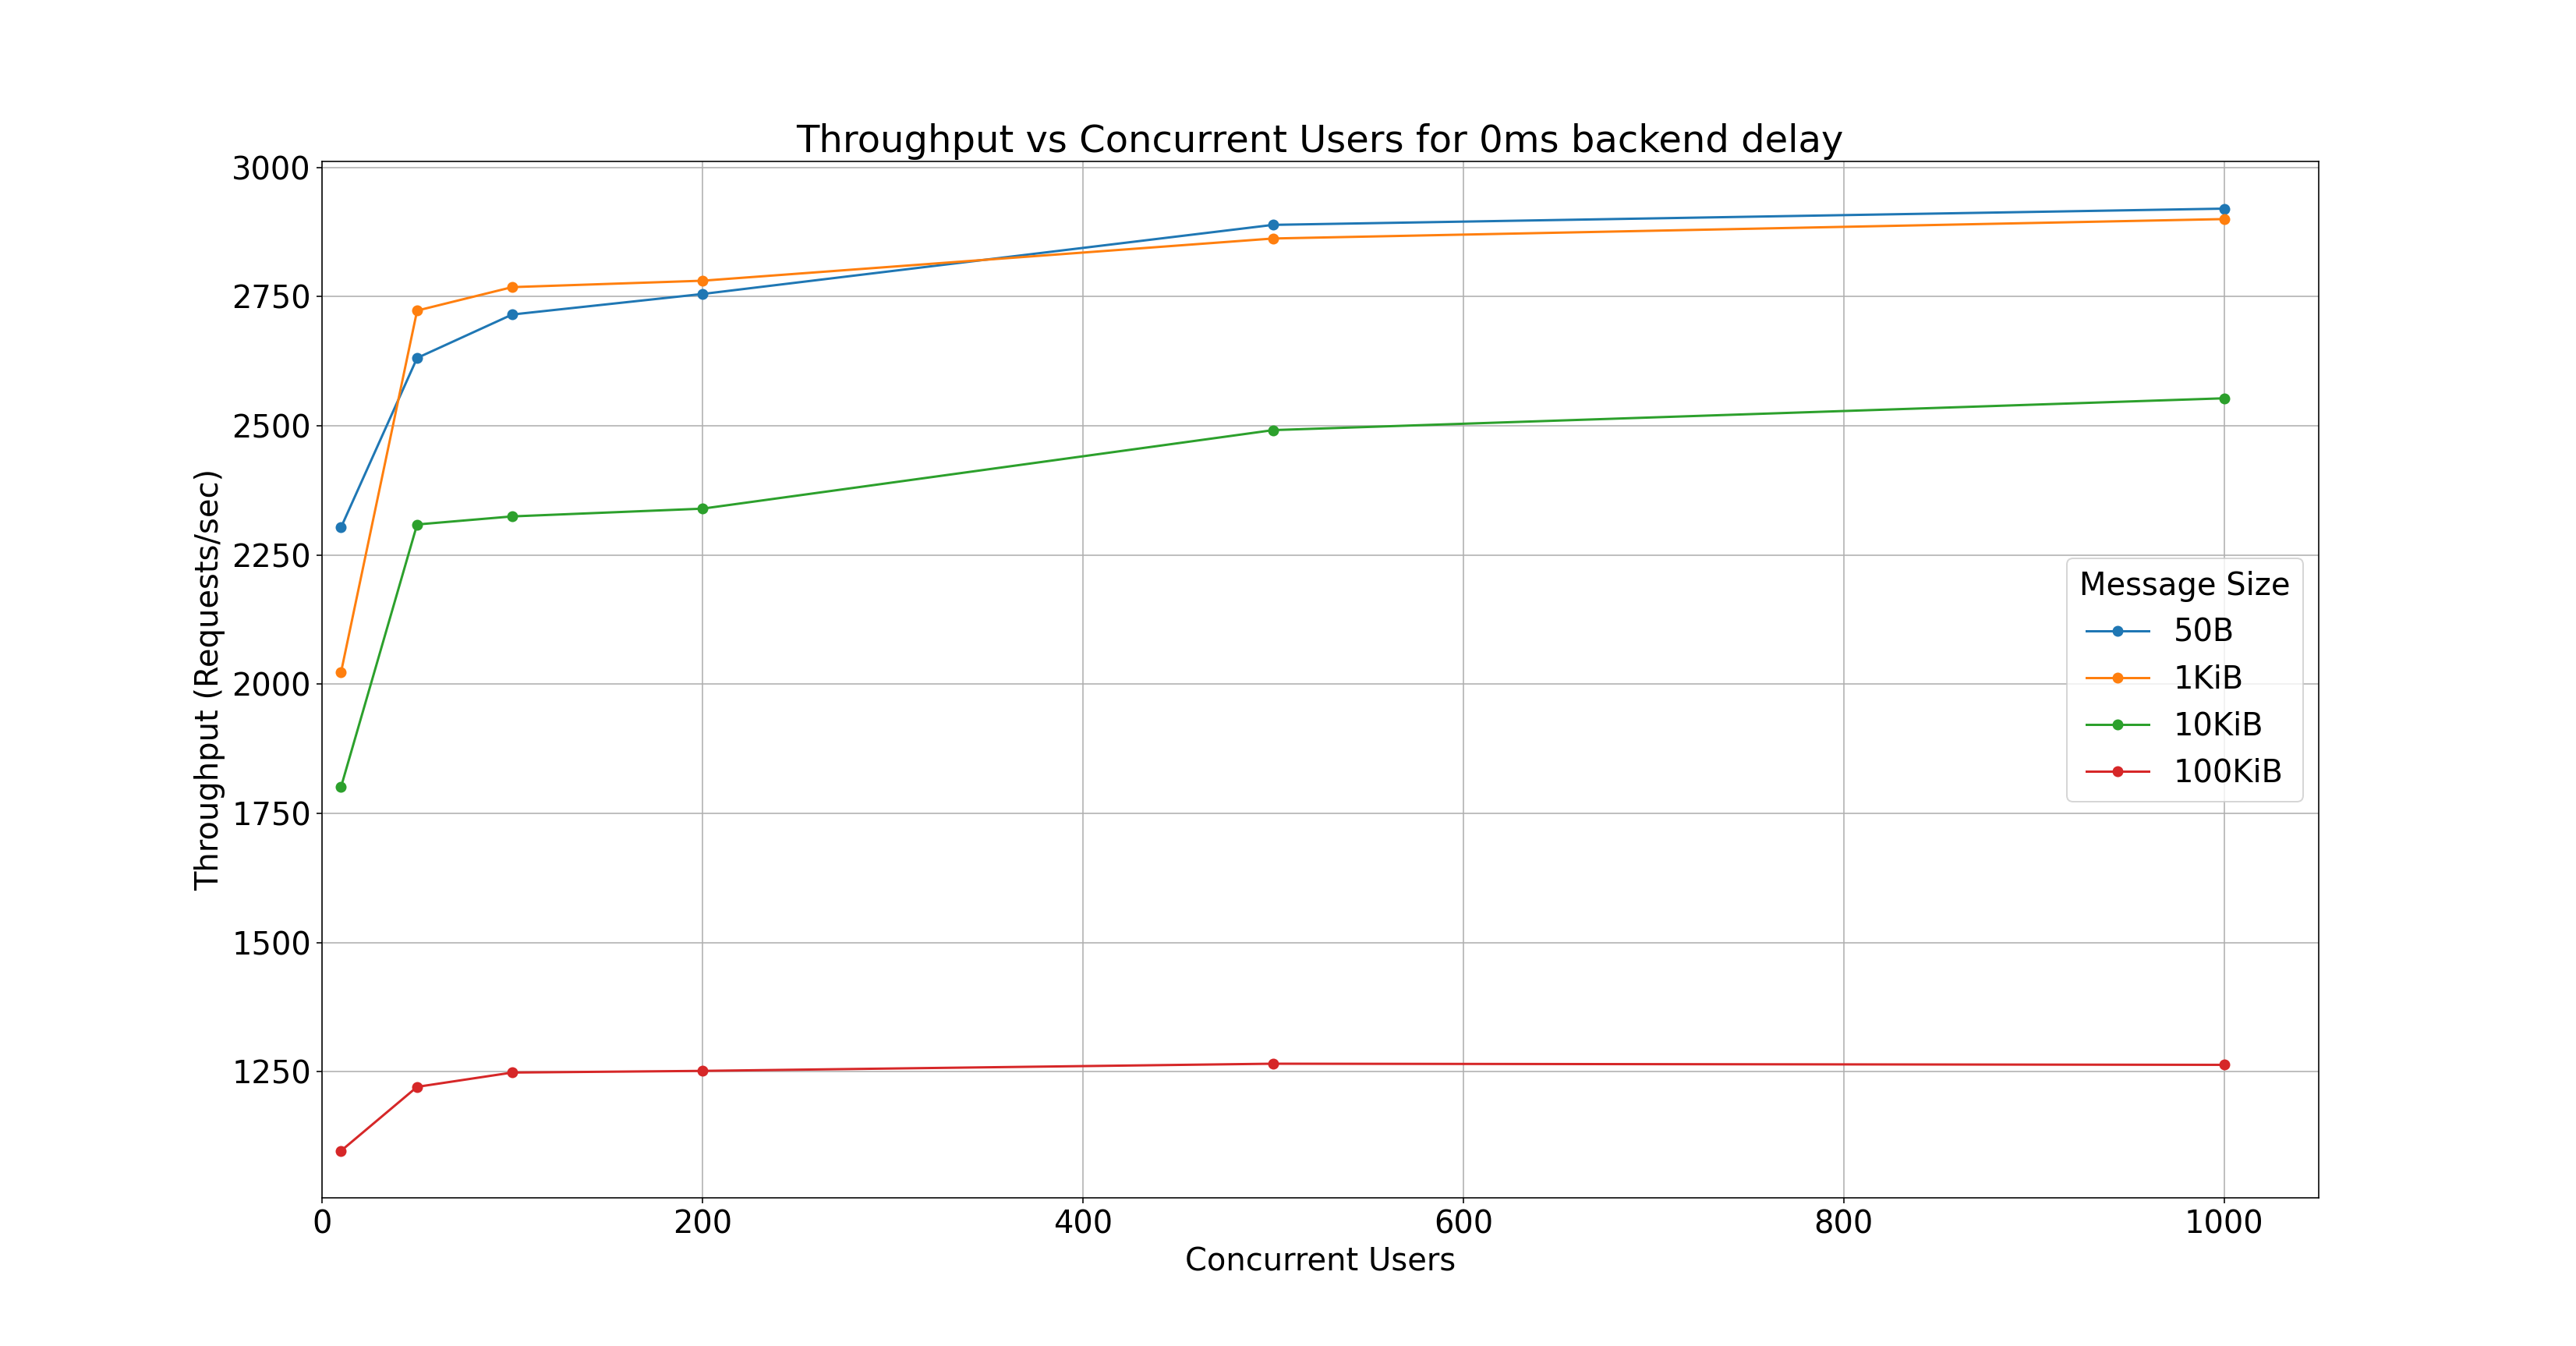
Key observations:
- More concurrent users mean more requests to the Choreo Connect. For a given payload size, Choreo Connect provides a most likely consistent throughput level. But for large payload sizes you will get a low throughput value when compared to the small payload sizes.
Average Response time (ms) vs. concurrent users
Backend delay is assigned as zero milliseconds when obtaining test results. The below graph shows how response time varied for different concurrent user counts. Also, the same graph shows the impact of the payload size considering the same two parameters.
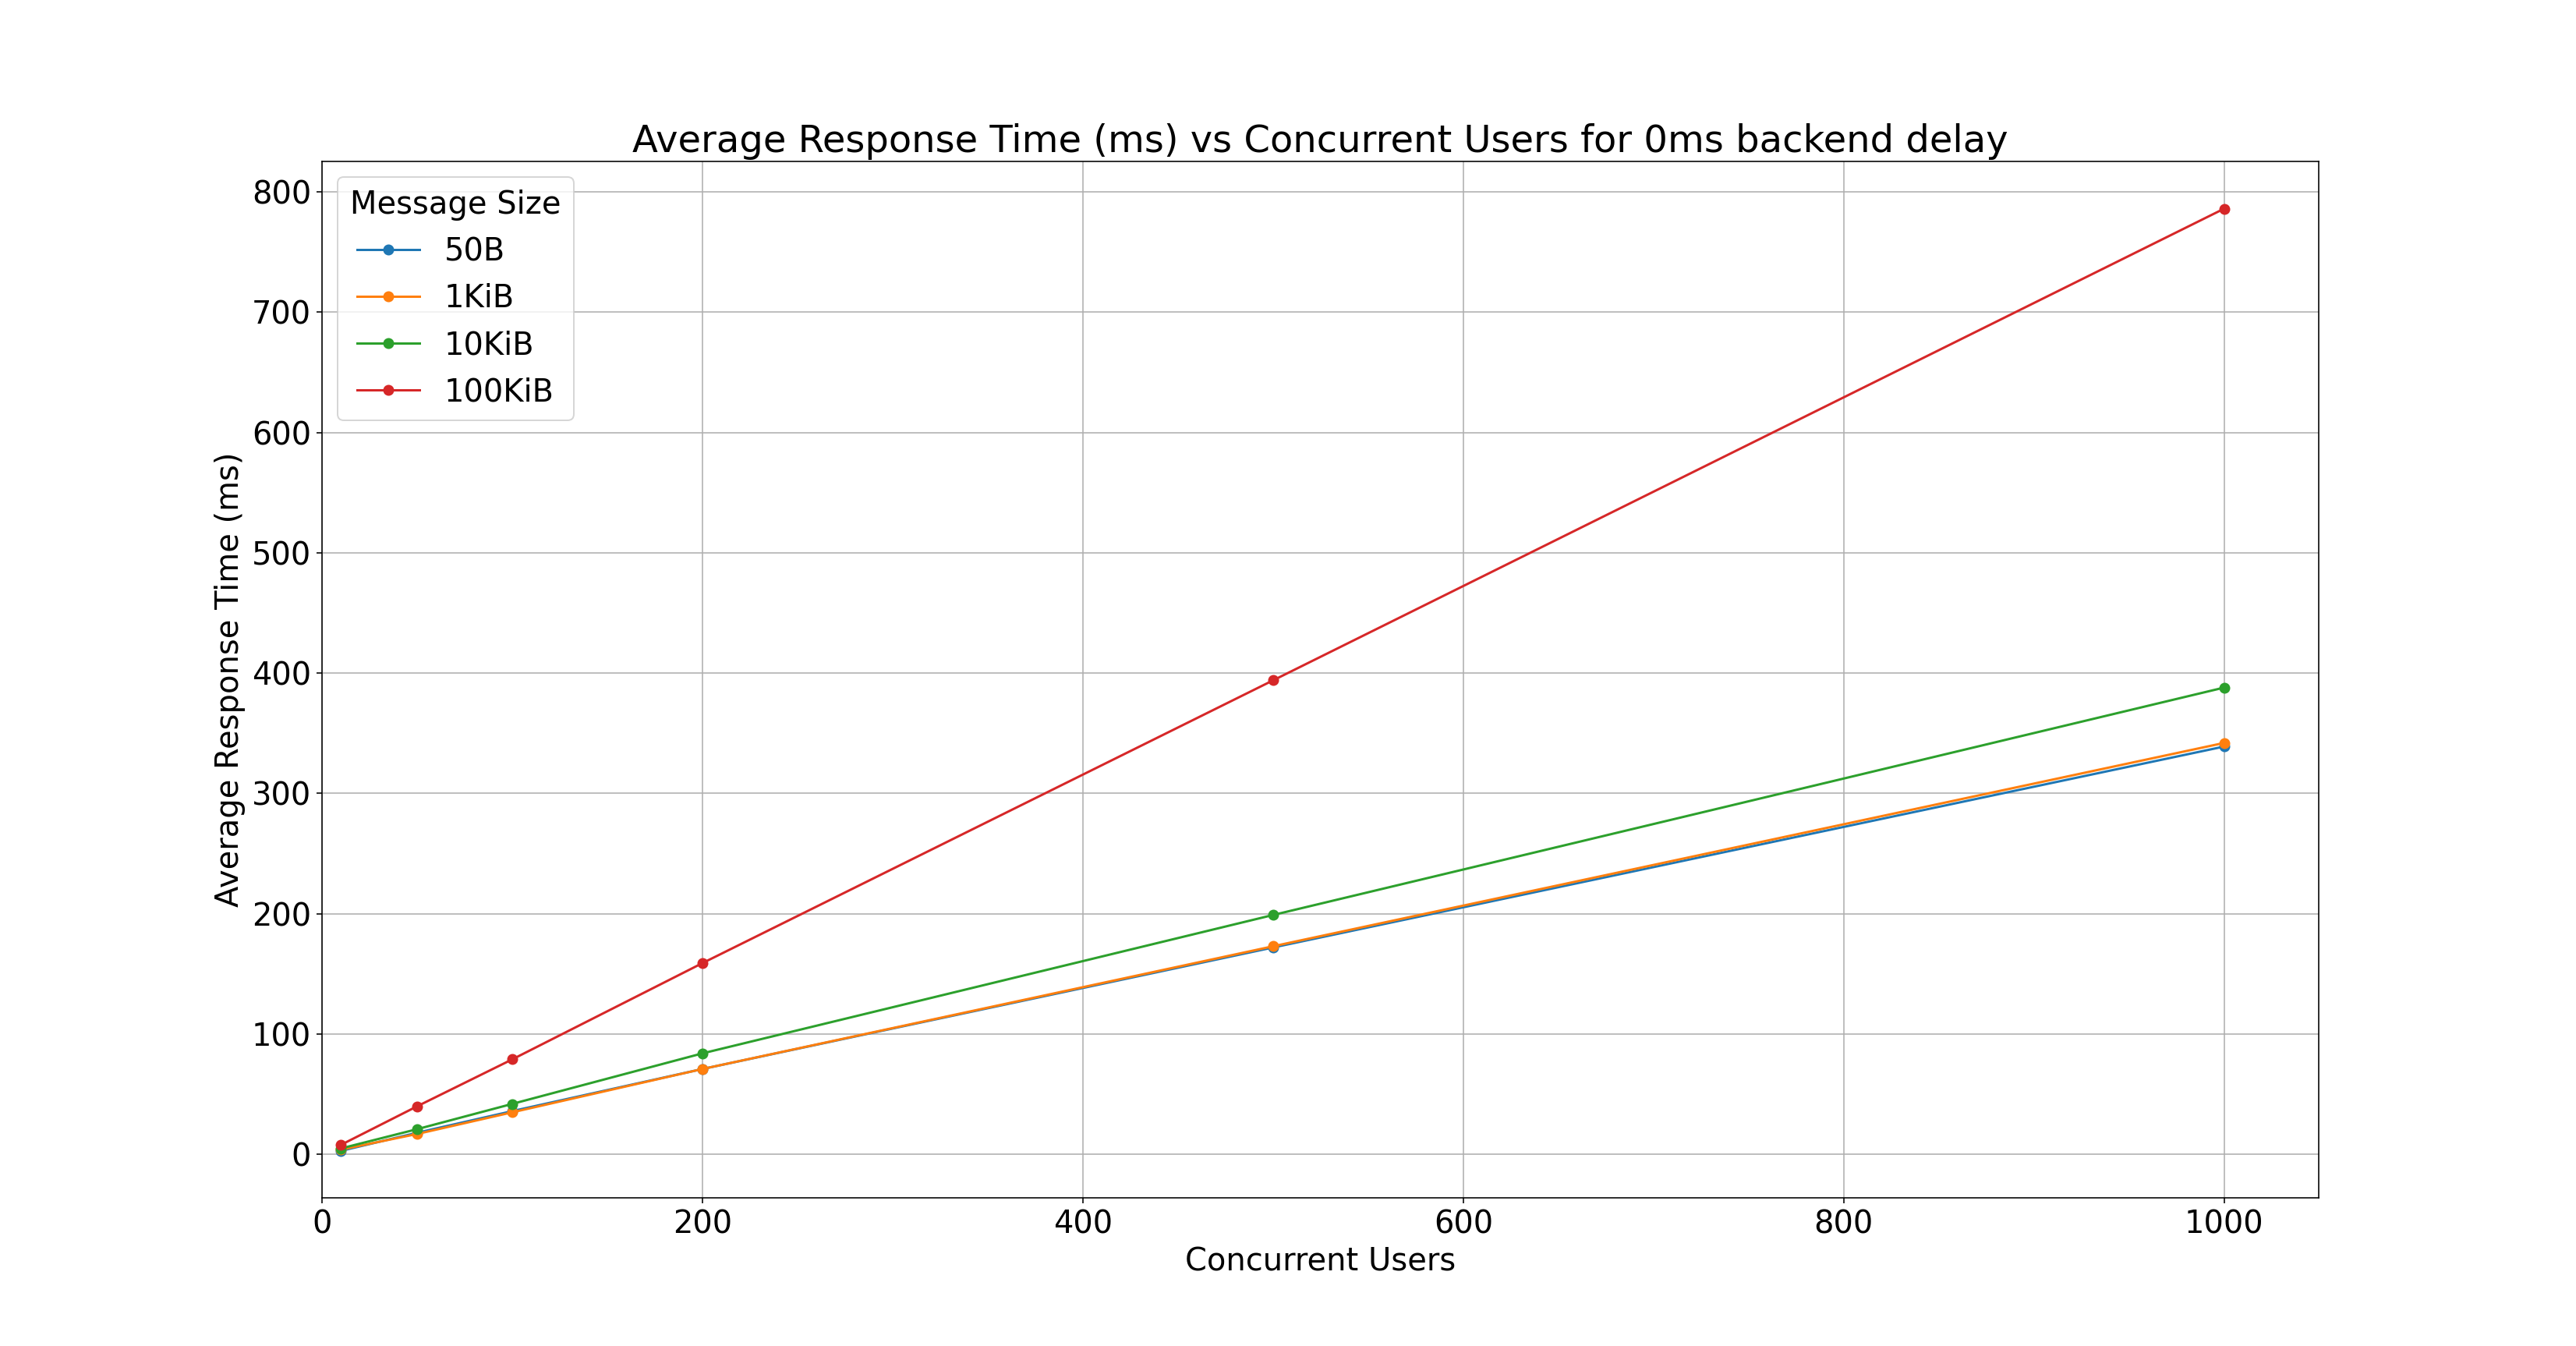
Key observations:
- When increasing concurrent users for given payload size, Choreo Connect consumes steady growth for the response time. But when considering the same user count for large payloads, response time is high compared to the small payloads.
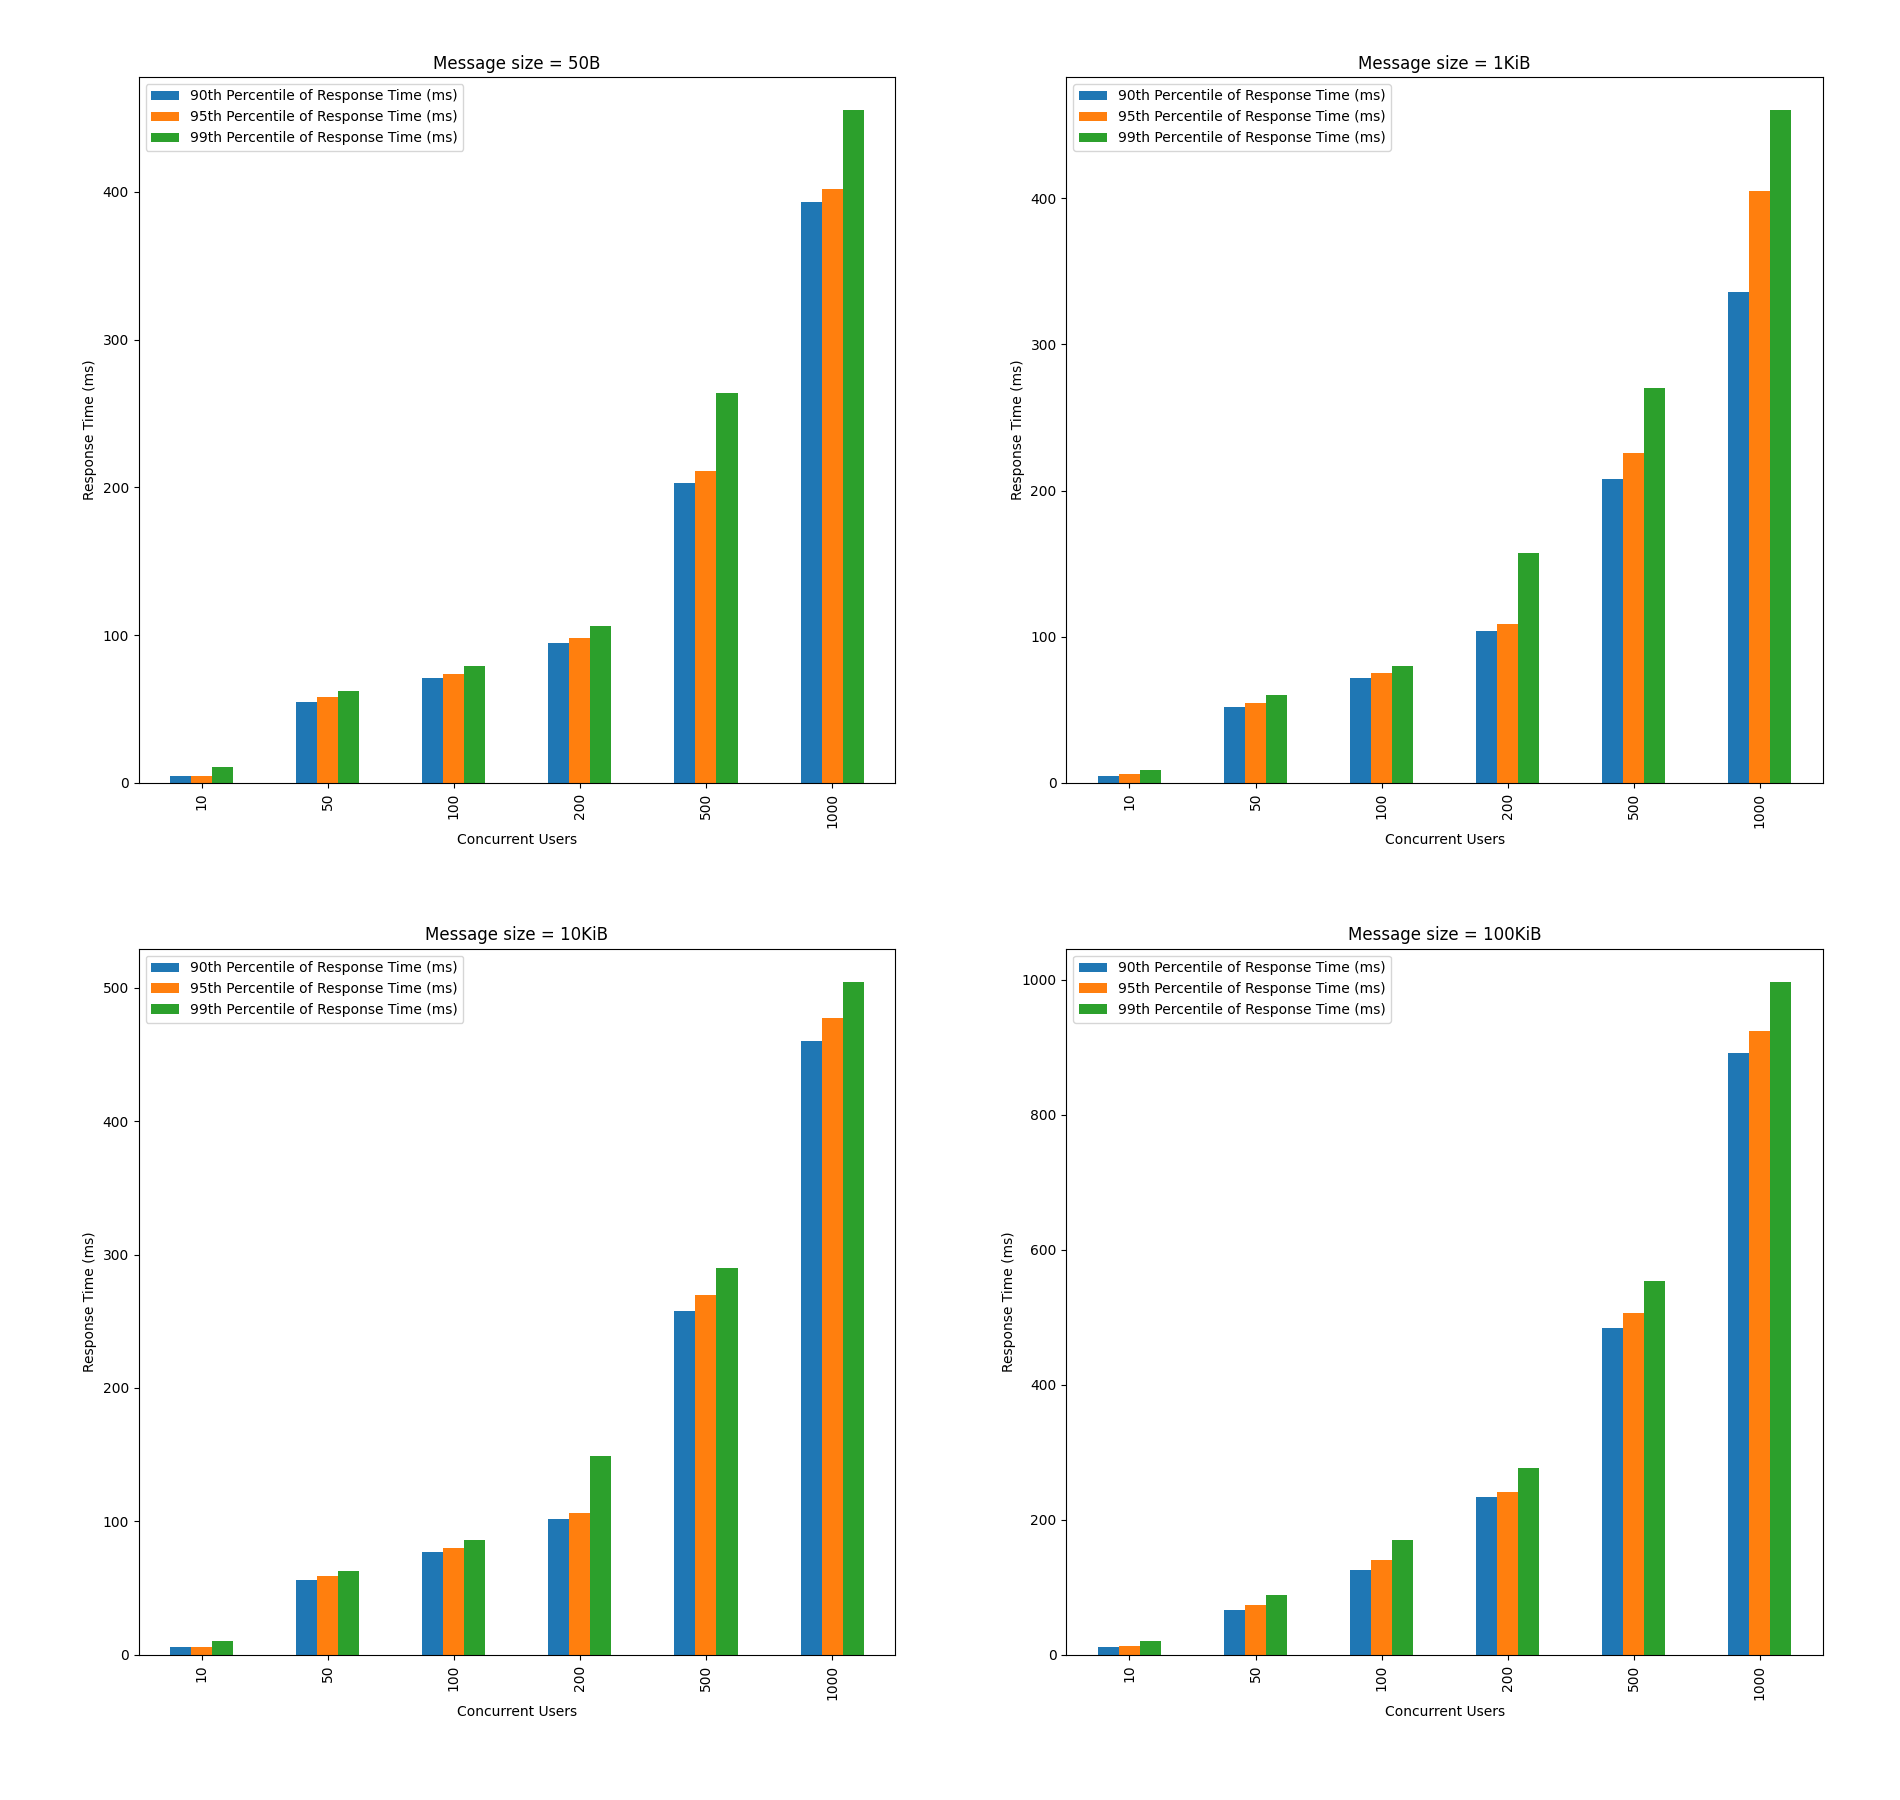
Response time percentiles vs. concurrent users
Below graphs show 90th, 95th, and 99th Response Time percentiles for 0ms backend delay. This is useful to measure the percentage of requests that exceeded the response time value for a given percentile. A percentile can also tell the percentage of requests completed below the particular response time value.
Test scenario results in CSV format are available here.
Top