Distributed Tracing
Performance issues, errors, and exceptions are unfortunate events that may occur in a production environment. In order to identify such an event, observing the production environment is essential. Choreo Connect provides the ability to observe how the requests are handled via an OpenTelemetry based distributed tracing implementation. By connecting Choreo Connect to one of the supported distributed tracing systems, users are able to easily debug and identify production issues.
Supported distributed tracing systems,
- Jaeger
- Zipkin
- Azure Application Insights
Configure Distributed Tracing
Note
If you are trying out tracing capabilities of Choreo Connect and do not have an actual deployment of Jaeger or Zipkin, you can start Choreo Connect together with Jaeger/Zipkin by adding one of the below containers to the product docker-compose file.
jaeger:
  image: jaegertracing/all-in-one:1.27
  environment:
    - COLLECTOR_ZIPKIN_HOST_PORT=9411
  ports:
    - "5775:5775"
    - "16686:16686"
- "14268:14268"zipkin:
image: openzipkin/zipkin
container_name: zipkin
ports:
- "9411:9411"Jaeger
When using Jaeger for tracing, the format is same as for Zipkin to publish spans from Choreo Connect. Therefore, the tracer type is configured as zipkin. Follow these steps to configure Choreo Connect with Jaeger.
-
Set the following environment variable to
jaegercontainer/pod.COLLECTOR_ZIPKIN_HOST_PORT=94111. Open the Choreo Connect configuration file according to the deployment type you are using.Click here to see the configuration file location for your Choreo Connect deployment.
Navigate to the correct folder path and open the
config.tomlorconfig-toml-configmap.yamlfile based on your Choreo Connect deployment.Deployment Mode File name Directory Docker Compose Choreo Connect as a Standalone Gateway config.toml<CHOREO-CONNECT_HOME>/docker-compose/choreo-connect/conf/Docker Compose Choreo Connect with WSO2 API Manager as a Control Plane config.toml<CHOREO-CONNECT_HOME>/docker-compose/choreo-connect-with-apim/conf/Kubernetes Choreo Connect as a Standalone Gateway config-toml-configmap.yaml<CHOREO-CONNECT_HOME>/k8s-artifacts/choreo-connect/Kubernetes Choreo Connect with WSO2 API Manager as a Control Plane config-toml-configmap.yaml<CHOREO-CONNECT_HOME>/k8s-artifacts/choreo-connect-with-apim/ -
Add the following configuration.
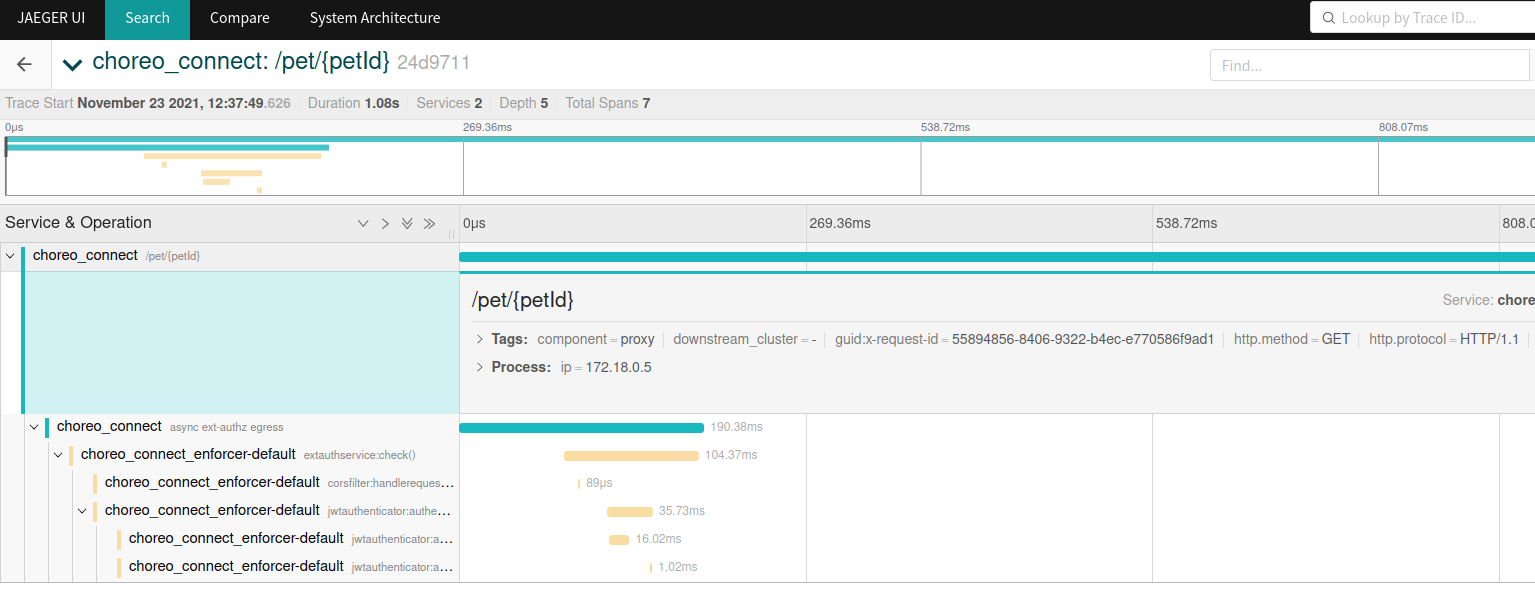
1. Start Choreo Connect. 1. Create and Deploy an API. 1. Invoke the newly created API and open Jaeger UI to view the traces. Navigate to http://localhost:16686 if you have updated the Docker Compose file with an instance of Jaeger as mentioned at the beginning.[tracing] enabled = true type = "zipkin" [tracing.configProperties] host = "jaeger" port = "9411" endpoint = "/api/v2/spans" instrumentationName = "CHOREO-CONNECT" maximumTracesPerSecond = "2" maxPathLength = "256"
You will be able to browse through the request traces and expand each trace to view complete details of the trace.
Zipkin
Follow these steps to configure WSO2 Choreo Connect with Zipkin.
-
Open the Choreo Connect configuration file according to the deployment type you are using.
Click here to see the configuration file location for your Choreo Connect deployment.
Navigate to the correct folder path and open the
config.tomlorconfig-toml-configmap.yamlfile based on your Choreo Connect deployment.Deployment Mode File name Directory Docker Compose Choreo Connect as a Standalone Gateway config.toml<CHOREO-CONNECT_HOME>/docker-compose/choreo-connect/conf/Docker Compose Choreo Connect with WSO2 API Manager as a Control Plane config.toml<CHOREO-CONNECT_HOME>/docker-compose/choreo-connect-with-apim/conf/Kubernetes Choreo Connect as a Standalone Gateway config-toml-configmap.yaml<CHOREO-CONNECT_HOME>/k8s-artifacts/choreo-connect/Kubernetes Choreo Connect with WSO2 API Manager as a Control Plane config-toml-configmap.yaml<CHOREO-CONNECT_HOME>/k8s-artifacts/choreo-connect-with-apim/ -
Add the following configuration.
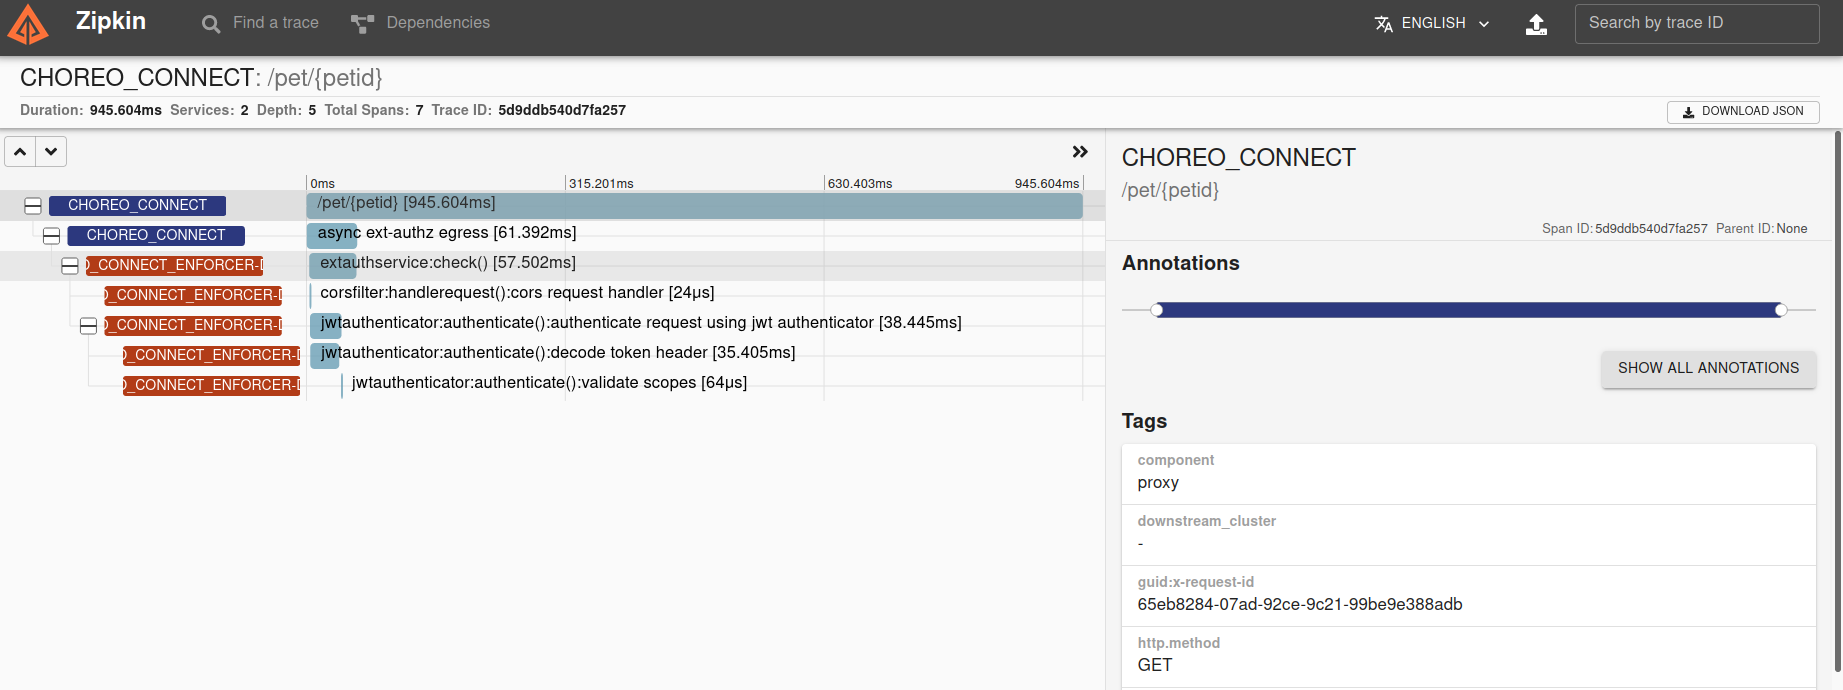
1. Start Choreo Connect. 1. Create and Deploy an API. 1. Invoke the newly created API and open Zipkin UI to view the traces. Navigate to http://localhost:9411 if you have updated the Docker Compose file with an instance of Zipkin as mentioned at the beginning. 1. Filter traces by[tracing] enabled = true type = "zipkin" [tracing.configProperties] host = "zipkin" port = "9411" endpoint = "/api/v2/spans" instrumentationName = "CHOREO-CONNECT" maximumTracesPerSecond = "2" maxPathLength = "256"serviceName=choreo_connectquery.
You will be able to see all traces. A detailed view of the traces will appear as shown below.
Azure Application Insights
Follow these steps to configure WSO2 Choreo Connect with Azure Application Insights.
-
First, you need to obtain the
ConnectionStringfrom the Azure portal.-
Log in to azure portal.
-
Copy the
Connection Stringfrom the overview page ofApplication Insightsresource. E.g.,InstrumentationKey=ab71943f-xxxx-xxxx-xxxx-fb2eb69ae11d;IngestionEndpoint=https://region.applicationinsights.azure.com/. - Open the Choreo Connect configuration file according to the deployment type you are using.
Click here to see the configuration file location for your Choreo Connect deployment.
Navigate to the correct folder path and open the
config.tomlorconfig-toml-configmap.yamlfile based on your Choreo Connect deployment.Deployment Mode File name Directory Docker Compose Choreo Connect as a Standalone Gateway config.toml<CHOREO-CONNECT_HOME>/docker-compose/choreo-connect/conf/Docker Compose Choreo Connect with WSO2 API Manager as a Control Plane config.toml<CHOREO-CONNECT_HOME>/docker-compose/choreo-connect-with-apim/conf/Kubernetes Choreo Connect as a Standalone Gateway config-toml-configmap.yaml<CHOREO-CONNECT_HOME>/k8s-artifacts/choreo-connect/Kubernetes Choreo Connect with WSO2 API Manager as a Control Plane config-toml-configmap.yaml<CHOREO-CONNECT_HOME>/k8s-artifacts/choreo-connect-with-apim/ -
-
Add the following configuration.
[tracing] enabled = true type = "azure" [tracing.configProperties] connectionString = {APPLICATIONINSIGHTS_CONNECTION_STRING} instrumentationName = "CHOREO-CONNECT" maximumTracesPerSecond = "2"[tracing] enabled = true type = "azure" [tracing.configProperties] connectionString = "InstrumentationKey=ab71943f-xxxx-xxxx-xxxx-fb2eb69ae11d;IngestionEndpoint=https://xxxxxx.applicationinsights.azure.com/" instrumentationName = "CHOREO-CONNECT" maximumTracesPerSecond = "2" -
Start Choreo Connect.
- Create and Deploy an API.
- Invoke the newly created API.
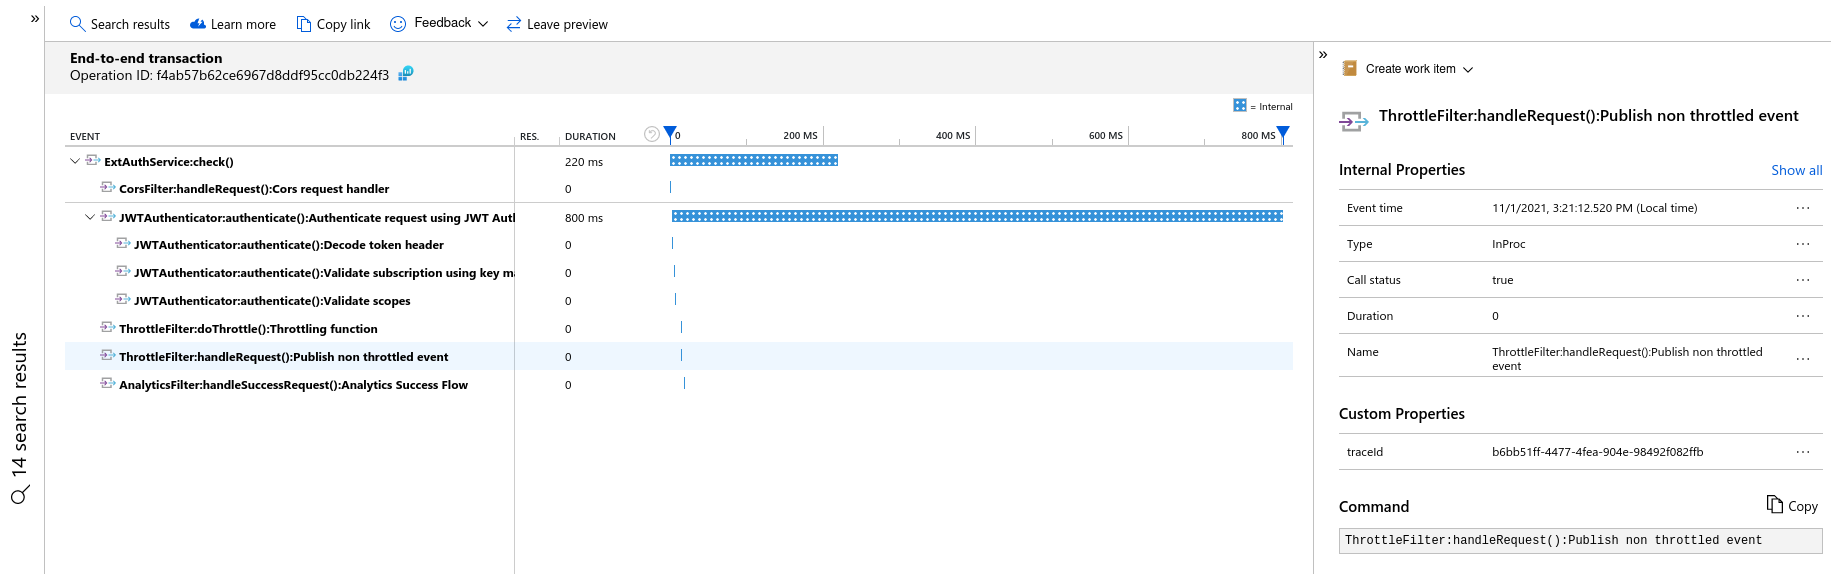
- Now open "Azure Application Insights" Transaction search window and select
Dependencyfor theEvent typesfilter.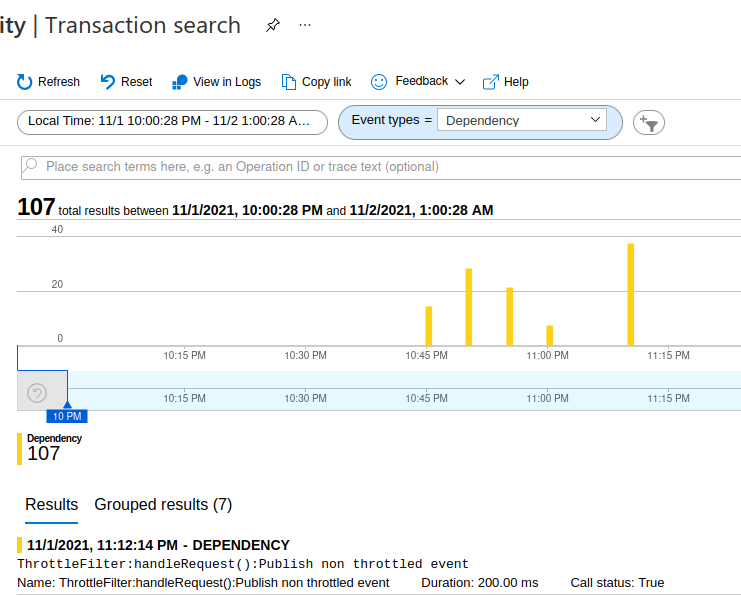
You will be able to see all traces. Detailed trace view will look like below.