Monitoring with OpenTelemetry
Tracing a message in MI is important to debug, observe, and identify possible bottlenecks in a message path. This is known as distributed tracing. OpenTelemetry allows you to enable distributed tracing for WSO2 MI.
OpenTelemetry is a single set of APIs and libraries that standardize how telemetry data such as traces, metrics and logs are collected, transmitted and managed. It provides a secure, vendor-neutral specification for instrumentation and offers a way for developers to follow the thread to trace requests from beginning to end across touchpoints and understand distributed systems at scale. OpenTelemetry will also help to trace the message and identify the latencies that took place in each process or method. Thereby, OpenTelemetry will help you to carry out a time-related analysis.
OpenTelemetry Configurations for MI
Below configurations should be added by the client to enable and view traces through OpenTelemetry.
WSO2 MI supports the following types of ways to retrieve instrumented data.
- Jaeger
- Zipkin
- Log
- OTLP - This type can support APMs such as NewRelic, Elastic, etc.
First add the below configurations to enable statistics collection in the <MI-HOME>/repository/conf/deployment.toml file.
[mediation]
flow.statistics.capture_all= true
stat.tracer.collect_payloads= true
stat.tracer.collect_mediation_properties= true
Then, add the configurations for the specific type of tracing in order to enable OpenTelemetry.
Note
OpenTracing will no longer support WSO2 MI as it is deprecated and OpenTelemetry will be supported to enable distributed tracing. The [opentracing] section that was present in the deployment.toml file of WSO2 MI 4.1.0 - which denoted OpenTracing related configurations has been replaced by the [opentelemetry] section.
Enabling Jaeger Tracing
-
Copy the following configuration into the
deployment.tomlfile.[opentelemetry] enable = true logs = true type = "jaeger" host = "<hostname-of-jaeger-endpoint>" port = "<port-of-jaeger-endpoint>" # instead of ‘host’ and ‘port’, ‘url’ can be used directly in the following way. url = "<url-of-jaeger-endpoint>"[opentelemetry] enable = true logs = true type = "jaeger" host = "localhost" port = 14250 # or url = "http://localhost:14250" -
Start the server. Once that is done, Download Jaeger and start it as mentioned in its Quick Start Guide. Then the traces can be viewed from the Jaeger UI
http://localhost:16686.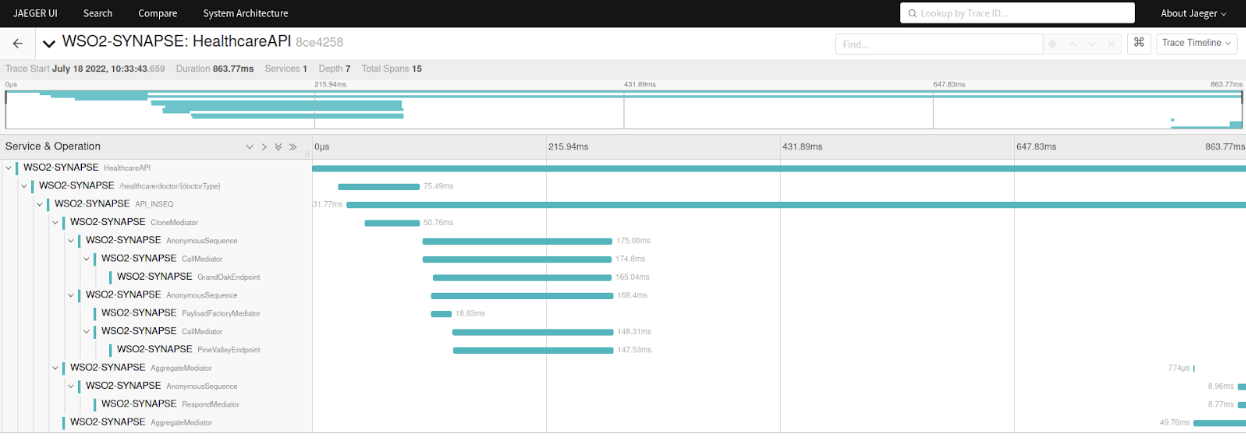
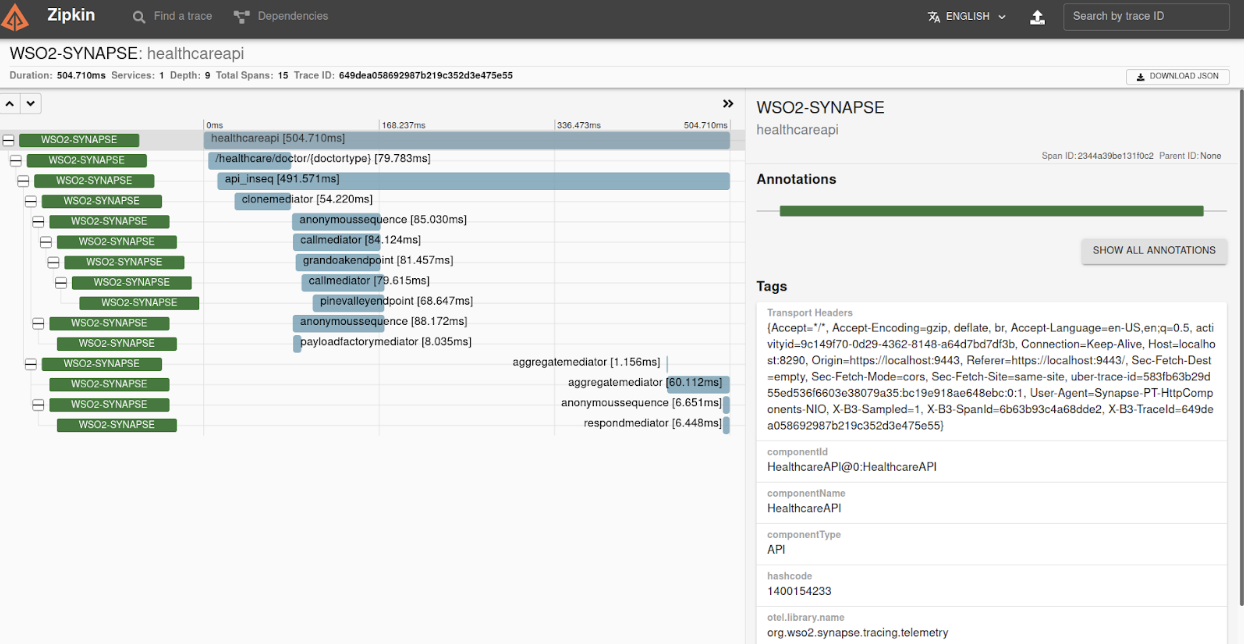
Enabling Zipkin Tracing
-
Copy the following configuration into the
deployment.tomlfile.[opentelemetry] enable = true logs = true type = "zipkin" host = "<hostname-of-zipkin-endpoint>" port = "<port-of-zipkin-endpoint>" # instead of host and port, ‘url’ can be used directly in the following way. url = "<url-of-zipkin-endpoint>"[opentelemetry] enable = true logs = true type = "zipkin" host = "localhost" port = 9411 # or url = "http://localhost:9411" -
Start the server. Once that is done, Download Zipkin and start it as mentioned in its Quick Start Guide. Then the traces can be viewed from Zipkin UI (http://localhost:9411).
Enabling Log Tracing
Log reporter records all the information related to the trace in the form of logs, and appends them to a log file. This is different from Jaeger or Zipkin, as there are no traces visualized, and no need to install anything in order to view the traces.
[opentelemetry]
enable = true
logs = true
type = "log"
After you invoke an artifact you will be able to see tracing data in the wso2-mi-open-telemetry.log in the <MI_HOME>/repository/logs folder.
07-01-2022-11:31:01,716 [-] [BatchSpanProcessor_WorkerThread-1] TRACE {"Span Id":"f960a2c19e696aa7","Trace Id":"9f3d860546d053aa06d55844a7d209a4","Operation":"CloneMediator","Latency":"60ms","Tags":"AttributesMap{data={componentType=Mediator, componentId=HealthcareAPI@3:CloneMediator, threadId=103, Transport Headers={Accept=*/*, Accept-Encoding=gzip, deflate, br, Accept-Language=en-US,en;q=0.5, activityid=24b17154-8f82-4a0e-8ac9-81ae61d95762, Connection=Keep-Alive, Host=localhost:8290, Origin=https://localhost:9443, Referer=https://localhost:9443/, Sec-Fetch-Dest=empty, Sec-Fetch-Mode=cors, Sec-Fetch-Site=same-site, uber-trace-id=12091cfc04f002deb631dee437ef4479:5024662f6c48b6fa:0:1, User-Agent=Synapse-PT-HttpComponents-NIO, X-B3-Sampled=1, X-B3-SpanId=f960a2c19e696aa7, X-B3-TraceId=9f3d860546d053aa06d55844a7d209a4}, componentName=CloneMediator}, capacity=128, totalAddedValues=5}"}
07-01-2022-11:31:01,716 [-] [BatchSpanProcessor_WorkerThread-1] TRACE {"Span Id":"a1ad135b0f7aff6a","Trace Id":"9f3d860546d053aa06d55844a7d209a4","Operation":"/healthcare/doctor/{doctorType}","Latency":"74ms","Tags":"AttributesMap{data={componentType=API Resource, componentId=HealthcareAPI@1:Resource, threadId=103, Transport Headers={Accept=*/*, Accept-Encoding=gzip, deflate, br, Accept-Language=en-US,en;q=0.5, activityid=24b17154-8f82-4a0e-8ac9-81ae61d95762, Connection=Keep-Alive, Host=localhost:8290, Origin=https://localhost:9443, Referer=https://localhost:9443/, Sec-Fetch-Dest=empty, Sec-Fetch-Mode=cors, Sec-Fetch-Site=same-site, uber-trace-id=12091cfc04f002deb631dee437ef4479:5024662f6c48b6fa:0:1, User-Agent=Synapse-PT-HttpComponents-NIO, X-B3-Sampled=1, X-B3-SpanId=f960a2c19e696aa7, X-B3-TraceId=9f3d860546d053aa06d55844a7d209a4}, componentName=/healthcare/doctor/{doctorType}}, capacity=128, totalAddedValues=5}"}
07-01-2022-11:31:01,717 [-] [BatchSpanProcessor_WorkerThread-1] TRACE {"Span Id":"c271d0cce18fcb84","Trace Id":"9f3d860546d053aa06d55844a7d209a4","Operation":"PayloadFactoryMediator","Latency":"30ms","Tags":"AttributesMap{data={componentType=Mediator, componentId=HealthcareAPI@6:PayloadFactoryMediator, threadId=105, Transport Headers={Accept=*/*, Accept-Encoding=gzip, deflate, br, Accept-Language=en-US,en;q=0.5, activityid=24b17154-8f82-4a0e-8ac9-81ae61d95762, Connection=Keep-Alive, Content-Type=application/json, Host=localhost:8290, Origin=https://localhost:9443, Referer=https://localhost:9443/, Sec-Fetch-Dest=empty, Sec-Fetch-Mode=cors, Sec-Fetch-Site=same-site, uber-trace-id=12091cfc04f002deb631dee437ef4479:5024662f6c48b6fa:0:1, User-Agent=Synapse-PT-HttpComponents-NIO, X-B3-Sampled=1, X-B3-SpanId=c271d0cce18fcb84, X-B3-TraceId=9f3d860546d053aa06d55844a7d209a4}, componentName=PayloadFactoryMediator}, capacity=128, totalAddedValues=5}"}
07-01-2022-11:31:01,717 [-] [BatchSpanProcessor_WorkerThread-1] TRACE {"Span Id":"bf4ae2557f179d2e","Trace Id":"9f3d860546d053aa06d55844a7d209a4","Operation":"GrandOakEndpoint","Latency":"104ms","Tags":"AttributesMap{data={componentType=Endpoint, componentId=GrandOakEndpoint@0:GrandOakEndpoint, hashcode=-1832964342, threadId=104, Transport Headers={Accept=*/*, Accept-Encoding=gzip, deflate, br, Accept-Language=en-US,en;q=0.5, activityid=24b17154-8f82-4a0e-8ac9-81ae61d95762, Host=localhost:8290, Origin=https://localhost:9443, Referer=https://localhost:9443/, Sec-Fetch-Dest=empty, Sec-Fetch-Mode=cors, Sec-Fetch-Site=same-site, uber-trace-id=12091cfc04f002deb631dee437ef4479:5024662f6c48b6fa:0:1, X-B3-Sampled=1, X-B3-SpanId=bf4ae2557f179d2e, X-B3-TraceId=9f3d860546d053aa06d55844a7d209a4}, Endpoint={\"method\":\"GET\",\"advanced\":{\"suspendState\":{\"errorCodes\":[],\"maxDuration\":9223372036854775807,\"initialDuration\":-1},\"timeoutState\":{\"errorCodes\":[],\"reties\":0}},\"uriTemplate\":\"http://localhost:9090/grandOak/doctors/\",\"name\":\"GrandOakEndpoint\",\"type\":\"HTTP Endpoint\"}, componentName=GrandOakEndpoint}, capacity=128, totalAddedValues=7}"}
07-01-2022-11:31:01,717 [-] [BatchSpanProcessor_WorkerThread-1] TRACE {"Span Id":"fa85a4860aa84740","Trace Id":"9f3d860546d053aa06d55844a7d209a4","Operation":"CallMediator","Latency":"121ms","Tags":"AttributesMap{data={componentType=Mediator, componentId=HealthcareAPI@4:CallMediator, threadId=104, Transport Headers={Accept=*/*, Accept-Encoding=gzip, deflate, br, Accept-Language=en-US,en;q=0.5, activityid=24b17154-8f82-4a0e-8ac9-81ae61d95762, Host=localhost:8290, Origin=https://localhost:9443, Referer=https://localhost:9443/, Sec-Fetch-Dest=empty, Sec-Fetch-Mode=cors, Sec-Fetch-Site=same-site, uber-trace-id=12091cfc04f002deb631dee437ef4479:5024662f6c48b6fa:0:1, X-B3-Sampled=1, X-B3-SpanId=bf4ae2557f179d2e, X-B3-TraceId=9f3d860546d053aa06d55844a7d209a4}, componentName=CallMediator}, capacity=128, totalAddedValues=5}"}
07-01-2022-11:31:01,718 [-] [BatchSpanProcessor_WorkerThread-1] TRACE {"Span Id":"a61e1a81316aebe5","Trace Id":"9f3d860546d053aa06d55844a7d209a4","Operation":"AnonymousSequence","Latency":"122ms","Tags":"AttributesMap{data={componentType=Sequence, componentId=HashCodeNullComponent, threadId=104, Transport Headers={Accept=*/*, Accept-Encoding=gzip, deflate, br, Accept-Language=en-US,en;q=0.5, activityid=24b17154-8f82-4a0e-8ac9-81ae61d95762, Host=localhost:8290, Origin=https://localhost:9443, Referer=https://localhost:9443/, Sec-Fetch-Dest=empty, Sec-Fetch-Mode=cors, Sec-Fetch-Site=same-site, uber-trace-id=12091cfc04f002deb631dee437ef4479:5024662f6c48b6fa:0:1, X-B3-Sampled=1, X-B3-SpanId=bf4ae2557f179d2e, X-B3-TraceId=9f3d860546d053aa06d55844a7d209a4}, componentName=AnonymousSequence}, capacity=128, totalAddedValues=5}"}
07-01-2022-11:31:01,718 [-] [BatchSpanProcessor_WorkerThread-1] TRACE {"Span Id":"47b80a3714e433eb","Trace Id":"9f3d860546d053aa06d55844a7d209a4","Operation":"PineValleyEndpoint","Latency":"85ms","Tags":"AttributesMap{data={componentType=Endpoint, componentId=PineValleyEndpoint@0:PineValleyEndpoint, hashcode=1891138122, threadId=105, Transport Headers={Accept=*/*, Accept-Encoding=gzip, deflate, br, Accept-Language=en-US,en;q=0.5, activityid=24b17154-8f82-4a0e-8ac9-81ae61d95762, Content-Type=application/json, Host=localhost:8290, Origin=https://localhost:9443, Referer=https://localhost:9443/, Sec-Fetch-Dest=empty, Sec-Fetch-Mode=cors, Sec-Fetch-Site=same-site, uber-trace-id=12091cfc04f002deb631dee437ef4479:5024662f6c48b6fa:0:1, X-B3-Sampled=1, X-B3-SpanId=47b80a3714e433eb, X-B3-TraceId=9f3d860546d053aa06d55844a7d209a4}, Endpoint={\"method\":\"POST\",\"advanced\":{\"suspendState\":{\"errorCodes\":[],\"maxDuration\":9223372036854775807,\"initialDuration\":-1},\"timeoutState\":{\"errorCodes\":[],\"reties\":0}},\"uriTemplate\":\"http://localhost:9091/pineValley/doctors\",\"name\":\"PineValleyEndpoint\",\"type\":\"HTTP Endpoint\"}, componentName=PineValleyEndpoint}, capacity=128, totalAddedValues=7}"}
07-01-2022-11:31:01,718 [-] [BatchSpanProcessor_WorkerThread-1] TRACE {"Span Id":"57f993da8ffe148d","Trace Id":"9f3d860546d053aa06d55844a7d209a4","Operation":"CallMediator","Latency":"87ms","Tags":"AttributesMap{data={componentType=Mediator, componentId=HealthcareAPI@7:CallMediator, threadId=105, Transport Headers={Accept=*/*, Accept-Encoding=gzip, deflate, br, Accept-Language=en-US,en;q=0.5, activityid=24b17154-8f82-4a0e-8ac9-81ae61d95762, Content-Type=application/json, Host=localhost:8290, Origin=https://localhost:9443, Referer=https://localhost:9443/, Sec-Fetch-Dest=empty, Sec-Fetch-Mode=cors, Sec-Fetch-Site=same-site, uber-trace-id=12091cfc04f002deb631dee437ef4479:5024662f6c48b6fa:0:1, X-B3-Sampled=1, X-B3-SpanId=47b80a3714e433eb, X-B3-TraceId=9f3d860546d053aa06d55844a7d209a4}, componentName=CallMediator}, capacity=128, totalAddedValues=5}"}
07-01-2022-11:31:01,718 [-] [BatchSpanProcessor_WorkerThread-1] TRACE {"Span Id":"8b723871e1d1dfcd","Trace Id":"9f3d860546d053aa06d55844a7d209a4","Operation":"AnonymousSequence","Latency":"118ms","Tags":"AttributesMap{data={componentType=Sequence, componentId=HashCodeNullComponent, threadId=105, Transport Headers={Accept=*/*, Accept-Encoding=gzip, deflate, br, Accept-Language=en-US,en;q=0.5, activityid=24b17154-8f82-4a0e-8ac9-81ae61d95762, Content-Type=application/json, Host=localhost:8290, Origin=https://localhost:9443, Referer=https://localhost:9443/, Sec-Fetch-Dest=empty, Sec-Fetch-Mode=cors, Sec-Fetch-Site=same-site, uber-trace-id=12091cfc04f002deb631dee437ef4479:5024662f6c48b6fa:0:1, X-B3-Sampled=1, X-B3-SpanId=47b80a3714e433eb, X-B3-TraceId=9f3d860546d053aa06d55844a7d209a4}, componentName=AnonymousSequence}, capacity=128, totalAddedValues=5}"}
07-01-2022-11:31:01,719 [-] [BatchSpanProcessor_WorkerThread-1] TRACE {"Span Id":"dd4ce497799a0fb2","Trace Id":"9f3d860546d053aa06d55844a7d209a4","Operation":"AggregateMediator","Latency":"2ms","Tags":"AttributesMap{data={componentType=Mediator, Status code=200, componentId=HealthcareAPI@9:AggregateMediator, threadId=107, Transport Headers={Connection=keep-alive, Content-Encoding=gzip, Content-Type=application/json, Transfer-Encoding=chunked, X-B3-Sampled=1, X-B3-SpanId=dd4ce497799a0fb2, X-B3-TraceId=9f3d860546d053aa06d55844a7d209a4}, componentName=AggregateMediator}, capacity=128, totalAddedValues=6}"}
07-01-2022-11:31:01,719 [-] [BatchSpanProcessor_WorkerThread-1] TRACE {"Span Id":"40ba700629e978dc","Trace Id":"9f3d860546d053aa06d55844a7d209a4","Operation":"RespondMediator","Latency":"16ms","Tags":"AttributesMap{data={componentType=Mediator, Status code=200, componentId=HealthcareAPI@10:RespondMediator, threadId=106, Transport Headers={Access-Control-Allow-Headers=, Access-Control-Allow-Methods=GET, Content-Encoding=gzip, Content-Type=application/json, Origin=https://localhost:9443, X-B3-Sampled=1, X-B3-SpanId=40ba700629e978dc, X-B3-TraceId=9f3d860546d053aa06d55844a7d209a4}, componentName=RespondMediator}, capacity=128, totalAddedValues=6}"}
07-01-2022-11:31:01,719 [-] [BatchSpanProcessor_WorkerThread-1] TRACE {"Span Id":"9ef4457c70927019","Trace Id":"9f3d860546d053aa06d55844a7d209a4","Operation":"AnonymousSequence","Latency":"17ms","Tags":"AttributesMap{data={componentType=Sequence, Status code=200, componentId=HashCodeNullComponent, threadId=106, Transport Headers={Access-Control-Allow-Headers=, Access-Control-Allow-Methods=GET, Content-Encoding=gzip, Content-Type=application/json, Origin=https://localhost:9443, X-B3-Sampled=1, X-B3-SpanId=40ba700629e978dc, X-B3-TraceId=9f3d860546d053aa06d55844a7d209a4}, componentName=AnonymousSequence}, capacity=128, totalAddedValues=6}"}
07-01-2022-11:31:01,719 [-] [BatchSpanProcessor_WorkerThread-1] TRACE {"Span Id":"8fac5fc65b6f6369","Trace Id":"9f3d860546d053aa06d55844a7d209a4","Operation":"AggregateMediator","Latency":"117ms","Tags":"AttributesMap{data={componentType=Mediator, Status code=200, componentId=HealthcareAPI@9:AggregateMediator, threadId=106, Transport Headers={Connection=keep-alive, Content-Encoding=gzip, Content-Type=application/json, Transfer-Encoding=chunked, X-B3-Sampled=1, X-B3-SpanId=8fac5fc65b6f6369, X-B3-TraceId=9f3d860546d053aa06d55844a7d209a4}, componentName=AggregateMediator}, capacity=128, totalAddedValues=6}"}
07-01-2022-11:31:01,719 [-] [BatchSpanProcessor_WorkerThread-1] TRACE {"Span Id":"b867784122bbcddb","Trace Id":"9f3d860546d053aa06d55844a7d209a4","Operation":"API_INSEQ","Latency":"963ms","Tags":"AttributesMap{data={componentType=Sequence, componentId=HealthcareAPI@2:API_INSEQ, threadId=106, Transport Headers={Accept=*/*, Accept-Encoding=gzip, deflate, br, Accept-Language=en-US,en;q=0.5, activityid=24b17154-8f82-4a0e-8ac9-81ae61d95762, Connection=Keep-Alive, Host=localhost:8290, Origin=https://localhost:9443, Referer=https://localhost:9443/, Sec-Fetch-Dest=empty, Sec-Fetch-Mode=cors, Sec-Fetch-Site=same-site, uber-trace-id=12091cfc04f002deb631dee437ef4479:5024662f6c48b6fa:0:1, User-Agent=Synapse-PT-HttpComponents-NIO, X-B3-Sampled=1, X-B3-SpanId=f960a2c19e696aa7, X-B3-TraceId=9f3d860546d053aa06d55844a7d209a4}, componentName=API_INSEQ}, capacity=128, totalAddedValues=5}"}
07-01-2022-11:31:01,719 [-] [BatchSpanProcessor_WorkerThread-1] TRACE {"Span Id":"5692e999f708a67d","Trace Id":"9f3d860546d053aa06d55844a7d209a4","Operation":"HealthcareAPI","Latency":"971ms","Tags":"AttributesMap{data={componentType=API, componentId=HealthcareAPI@0:HealthcareAPI, hashcode=1400154233, threadId=106, Transport Headers={Accept=*/*, Accept-Encoding=gzip, deflate, br, Accept-Language=en-US,en;q=0.5, activityid=24b17154-8f82-4a0e-8ac9-81ae61d95762, Connection=Keep-Alive, Host=localhost:8290, Origin=https://localhost:9443, Referer=https://localhost:9443/, Sec-Fetch-Dest=empty, Sec-Fetch-Mode=cors, Sec-Fetch-Site=same-site, uber-trace-id=12091cfc04f002deb631dee437ef4479:5024662f6c48b6fa:0:1, User-Agent=Synapse-PT-HttpComponents-NIO, X-B3-Sampled=1,
X-B3-SpanId=f960a2c19e696aa7, X-B3-TraceId=9f3d860546d053aa06d55844a7d209a4}, componentName=HealthcareAPI}, capacity=128, totalAddedValues=6}"}
Enabling OTLP Tracing
OpenTelemetry protocol(OTLP) is a general-purpose telemetry data delivery protocol used to exchange data between the client and the server. This type can support APMs such as NewRelic, Elastic, etc.
-
Copy the following configuration into the
deployment.tomlfile to use OTLP.[opentelemetry] enable = true logs = true type = "otlp" url = "endpoint-url" [[opentelemetry.properties]] name = "name-of-the-header" value = "key-value-of-the-header"[opentelemetry] enable = true logs = true type = "otlp" url = "https://otlp.nr-data.net:4317/v1/traces" [[opentelemetry.properties]] name = "api-key" value = "<your-insight-insert-key>"Note
Above example illustrates the OpenTelemetry configurations for NewRelic APM.
It is recommended to use OTLP to view the traces through NewRelic APM. But still you can use zipkin format traces to view the traces through NewRelic in the following way.
[opentelemetry]
enable = true
logs = true
type = "zipkin"
url = "https://trace-api.newrelic.com/trace/v1?Api-Key=<Place
_your_Insight_Insert_key_here>&Data-Format=zipkin&Data-Format-Version=2"
Note
To configure the API key in Newrelic:
-
Go to Profile -> API keys -> Insights Insert key -> Insert keys to create an account in New Relic.
For other vendors, please consult the respective documentations.
Using the Custom Tracer Implementation
By using a custom tracer implementation in WSO2 MI, you can publish tracing data from WSO2 MI to any tracing server. Let's implement a custom tracer which simply prints the logs via the System.out in WSO2 MI using the instructions given below:
-
Implement the
org.apache.syanpse.flow.statistics.tracing.opentelemetry.management.OpenTelemetryManagerinterface and add your implementation. -
The
initmethod should contain the generation of theTracerinstance by configuring the endpoint URL, headers,SdkTraceProviderandOpenTelemetryinstance. -
Then the
handlerattribute can be defined using initialized tracer and opentelemetry instances. -
The
getTelemetryTracermethod should return the tracer with the given instrumentation name. -
The close method should close the initialized
SdkTraceProviderinstance to shutdown the SDK cleanly at JVM exit. -
The
getServiceNamemethod should return the service name. -
Finally, the
getHandlermethod should return the above initialized handler.
The following are the components involved in building your custom tracer:
-
An implementation of
SpanExporter- Publishes the spans. -
An implementation of
OpenTelemetryManager- Coordinates the span, and the relevantSpanExporter.
If you are building without an already available SpanExporter, then you should create one. In the below example, let’s create a SysoutExporter) as below by implementing the SpanExporter interface, which will simply output the logs to the standard output.
public class SysOutExporter implements SpanExporter {

   private final Log log = LogFactory.getLog(TelemetryConstants.TRACER);
   private final JsonFactory jsonFactory = new JsonFactory();

   public static SysOutExporter create() {

       return new SysOutExporter();
   }

   @Override
   public CompletableResultCode export(Collection<SpanData> spans) {

       Iterator iterator = spans.iterator();
       while (iterator.hasNext()) {
           String traceId = null;
           String spanId = null;
           SpanData span = (SpanData) iterator.next();
           try {
               StringWriter writer = new StringWriter();
               JsonGenerator generator = this.jsonFactory.createGenerator(writer);
               generator.writeStartObject();
               traceId = span.getTraceId();
               spanId = span.getSpanId();
               generator.writeStringField(TelemetryConstants.SPAN_ID, spanId);
               generator.writeStringField(TelemetryConstants.TRACE_ID, traceId);
               generator.writeStringField(TelemetryConstants.SPAN_NAME, span.getName());
               generator.writeStringField(TelemetryConstants.LATENCY,
                       ((int) (span.getEndEpochNanos() - span.getStartEpochNanos()) / 1000000) + "ms");
               generator.writeStringField(TelemetryConstants.ATTRIBUTES, String.valueOf(span.getAttributes()));
               generator.writeEndObject();
               generator.close();
               writer.close();
               System.out.println(writer.toString());
           } catch (IOException e) {
               log.error("Error while structuring the log message when exporting Trace ID: " + traceId + ", Span ID:" +
                       " " + spanId, e);
           }
       }

       return CompletableResultCode.ofSuccess();
   }

   @Override
   public CompletableResultCode flush() {

       return CompletableResultCode.ofSuccess();
   }

   @Override
   public CompletableResultCode shutdown() {

       return CompletableResultCode.ofSuccess();
   }
}
Then you can create the class as below.
public class SysoutTelemetryManager implements OpenTelemetryManager {

   private static final Log logger = LogFactory.getLog(SysoutTelemetryManager.class);
   private SdkTracerProvider sdkTracerProvider;
   private OpenTelemetry openTelemetry;
   private TelemetryTracer tracer;
   private SpanHandler handler;

   @Override
   public void init() {
       SysOutExporter sysoutExporter = SysOutExporter.create();

       if (logger.isDebugEnabled()) {
           logger.debug("Exporter: " + sysoutExporter + " is configured");
       }

       Resource serviceNameResource = Resource.create(Attributes.of(ResourceAttributes.SERVICE_NAME,
               TelemetryConstants.SERVICE_NAME));

       sdkTracerProvider = SdkTracerProvider.builder()
               .addSpanProcessor(BatchSpanProcessor.builder(sysoutExporter).build())
               .setResource(Resource.getDefault().merge(serviceNameResource))
               .build();

       openTelemetry = OpenTelemetrySdk.builder()
               .setTracerProvider(sdkTracerProvider)
               .setPropagators(ContextPropagators.create(W3CTraceContextPropagator.getInstance()))
               .build();

       this.tracer = new TelemetryTracer(getTelemetryTracer());
       if (logger.isDebugEnabled()) {
           logger.debug("Tracer: " + this.tracer + " is configured");
       }
       this.handler = new SpanHandler(tracer, openTelemetry, new TracingScopeManager());
   }

   @Override
   public Tracer getTelemetryTracer() {

       return openTelemetry.getTracer(TelemetryConstants.OPENTELEMETRY_INSTRUMENTATION_NAME);
   }

   @Override
   public void close() {

       if (sdkTracerProvider != null) {
           sdkTracerProvider.close();
       }
   }

   @Override
   public String getServiceName() {

       return TelemetryConstants.SERVICE_NAME;
   }

   @Override
   public OpenTelemetrySpanHandler getHandler() {

       return this.handler;
   }
}
-
Build the Apache Maven project and add the JAR file to the
<MI_HOME>/dropinsdirectory. -
Edit the
infer.jsonfile in the<MI_HOME>/repository/resources/conffolder in the following way underopentelemetry.type."sysout": { "synapse_properties.'opentelemetry.class'": "org.apache.synapse.aspects.flow.statistics.tracing.opentelemetry.management.SysoutTelemetryManager" } -
Add the following configuration to the
deployment.tomlfile.[opentelemetry] enable = true logs = true type = "sysout"
If you need more opentelemetry.properties than the developed ones, you can edit the for loop of synapse.properties.j2 file in the <MI_HOME>/repository/resources/conf/templates/conf folder in the following way.
{%for property in opentelemetry.properties %}
opentelemetry.properties.{{property.header}} = {{property.key}}
{% endfor %}
The deployment.toml file entry will be as follows:
[opentelemetry]
enable = true
logs = true
type = "type-name"
url = "endpoint-url"

[[opentelemetry.properties]]
header = "header"
key = "key-of-the-header"
Also, in the custom tracer class, a method should be implemented to return those properties that will be similar to the method getHeaderKeyProperty in OTLPTelemetryManager class and the constant of org.apache.syanpse.flow.statistics.tracing.opentelemetry.management.TelemetryConstants class also needs to be changed according to the name given. For more information, view manually instrumented OTLP tracer.
OpenTelemetry ensured backward compatibility with OpenTracing for Jaeger and Zipkin by testing the below versions.
- Zipkin 2.12.9
- Jaeger 1.14.0
- Jaeger 1.10.0
Therefore, the existing versions can be used without any issue.