Configuring Analytics for Choreo Connect
Choreo Connect is capable of publishing fine-grained analytics events which can then be used to generate reports, dashboards, statistics, and graphs for the APIs deployed on Choreo Connect. Choreo Connect can not only publish analytics data to the Choreo platform but also to platforms that support the ELK stack. The following subsections will explain in detail how you could enable and configure analytics for each platform to gain insights into the services exposed via Choreo Connect.
Tip
To learn more on the analytics-related concepts, see Choreo Connect Analytics - Concepts.
Configure Analytics for Choreo Connect using one of the following methods:
Configuring Choreo Portal Analytics
Follow the instructions below to configure Choreo Portal Analytics for Choreo Connect.
Step 1 - Set up Analytics
Follow the instructions below to configure analytics with Choreo:
- Sign in to https://console.choreo.dev/login/.
- Go to https://console.choreo.dev/user-settings/onpremkeys and generate an on-prem-key.
-
Open the
docker-compose.yamlfile, which based on your setup is located in the<CHOREO-CONNECT_HOME>/docker-compose/choreo-connector<CHOREO-CONNECT_HOME>/docker-compose/choreo-connect-with-apimdirectory.Info
You can configure Choreo Connect to publish Analytics to the Choreo cloud via the standalone mode or via the with Control Plane mode.
-
Locate the environment variables section under the
enforcerand change the following variables.environment: ... analytics_authURL=https://analytics-event-auth.choreo.dev/auth/v1 analytics_authToken=<your-on-prem-key> -
Enable analytics before starting Choreo Connect. First of all, navigate to the configuration file location. Open the Choreo Connect configuration file according to the deployment type you are using.
Click here to see the configuration file location for your Choreo Connect deployment.
Navigate to the correct folder path and open the config.toml or config-toml-configmap.yaml file based on your Choreo Connect deployment.
| Deployment | Mode | File name | Directory |
|---|---|---|---|
| Docker Compose | Choreo Connect as a Standalone Gateway | config.toml |
<CHOREO-CONNECT_HOME>/docker-compose/choreo-connect/conf/ |
| Docker Compose | Choreo Connect with WSO2 API Manager as a Control Plane | config.toml |
<CHOREO-CONNECT_HOME>/docker-compose/choreo-connect-with-apim/conf/ |
| Kubernetes | Choreo Connect as a Standalone Gateway | config-toml-configmap.yaml |
<CHOREO-CONNECT_HOME>/k8s-artifacts/choreo-connect/ |
| Kubernetes | Choreo Connect with WSO2 API Manager as a Control Plane | config-toml-configmap.yaml |
<CHOREO-CONNECT_HOME>/k8s-artifacts/choreo-connect-with-apim/ |
-
Locate the Analytics section.
-
Enable analytics by using the following configurations.
[analytics]
enabled = true
[analytics.adapter]
    bufferFlushInterval = "1s"
    bufferSizeBytes = 16384
    gRPCRequestTimeout = "20s"
[analytics.enforcer]
    [analytics.enforcer.configProperties]
    authURL = "$env{analytics_authURL}"
    authToken = "$env{analytics_authToken}"

    [analytics.enforcer.LogReceiver]
    port = 18090
    maxMessageSize = 1000000000
    maxHeaderLimit = 8192
    #keep alive time of the external authz connection
    keepAliveTime = 600

    [analytics.enforcer.LogReceiver.threadPool]
        coreSize = 10
        maxSize = 100
        #keep alive time of threads in seconds
        keepAliveTime = 600
        queueSize = 1000
Step 2 - Try it out
Follow the instructions below to generate some traffic in order to be able to view the Analytics in the Choreo cloud:
-
Deploy your API.
Deploy your API in API Manager based on your setup.
-
Invoke the API a few times.
For more information, see Invoke the API.
-
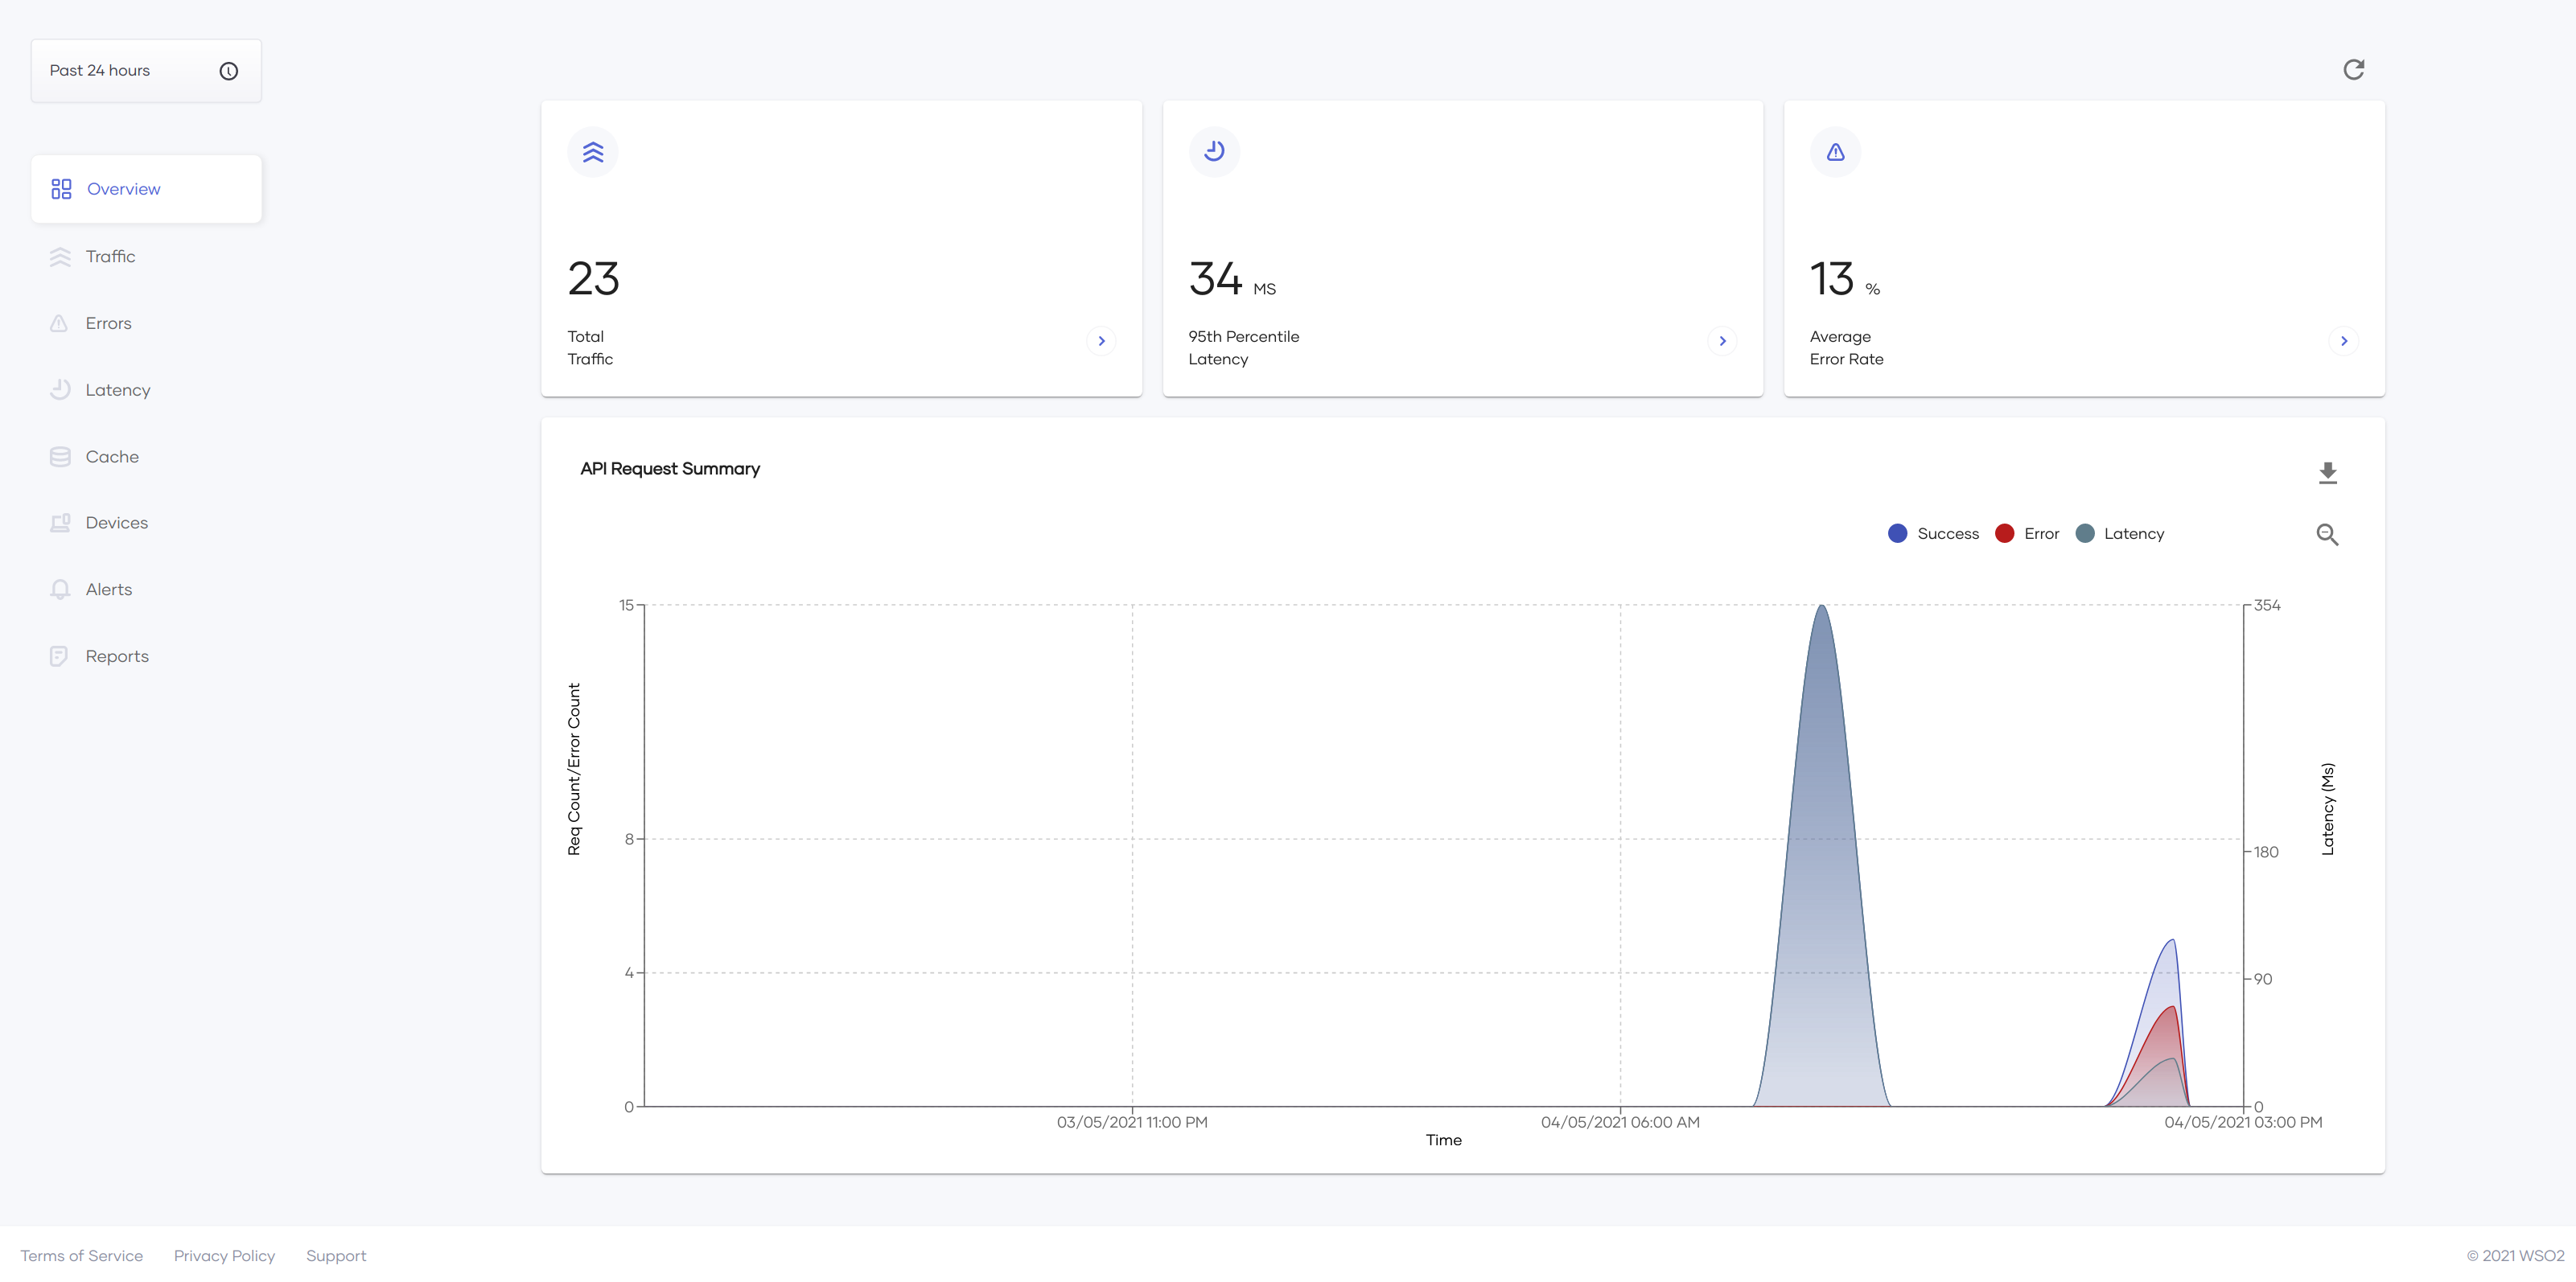
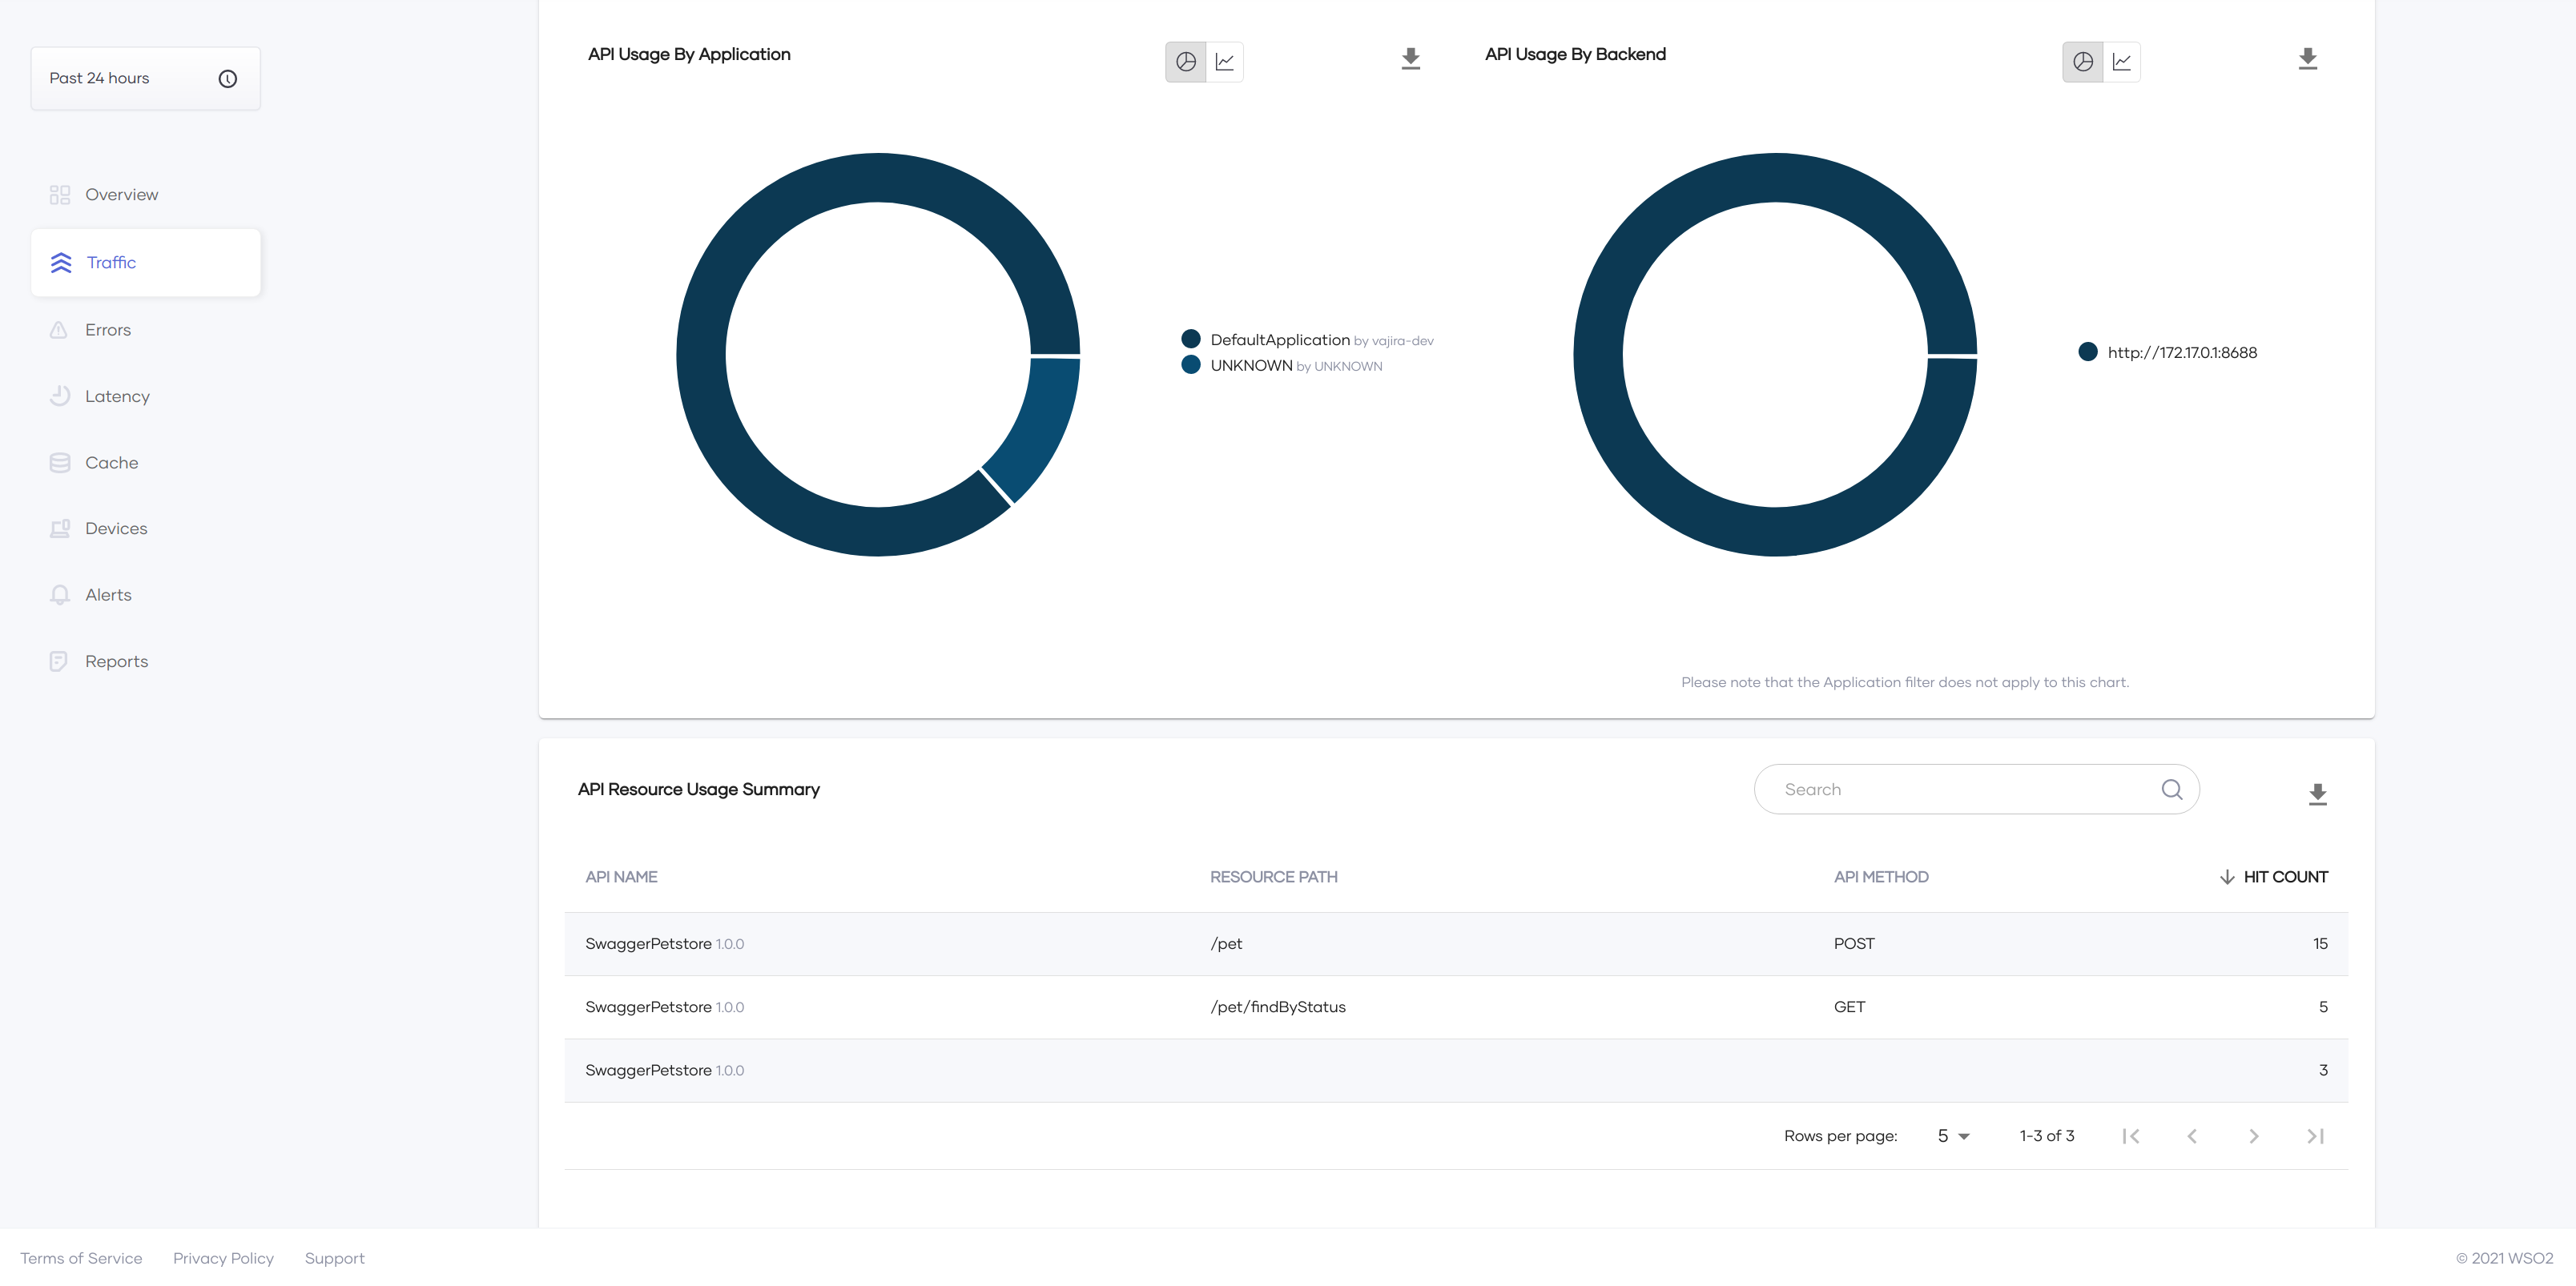
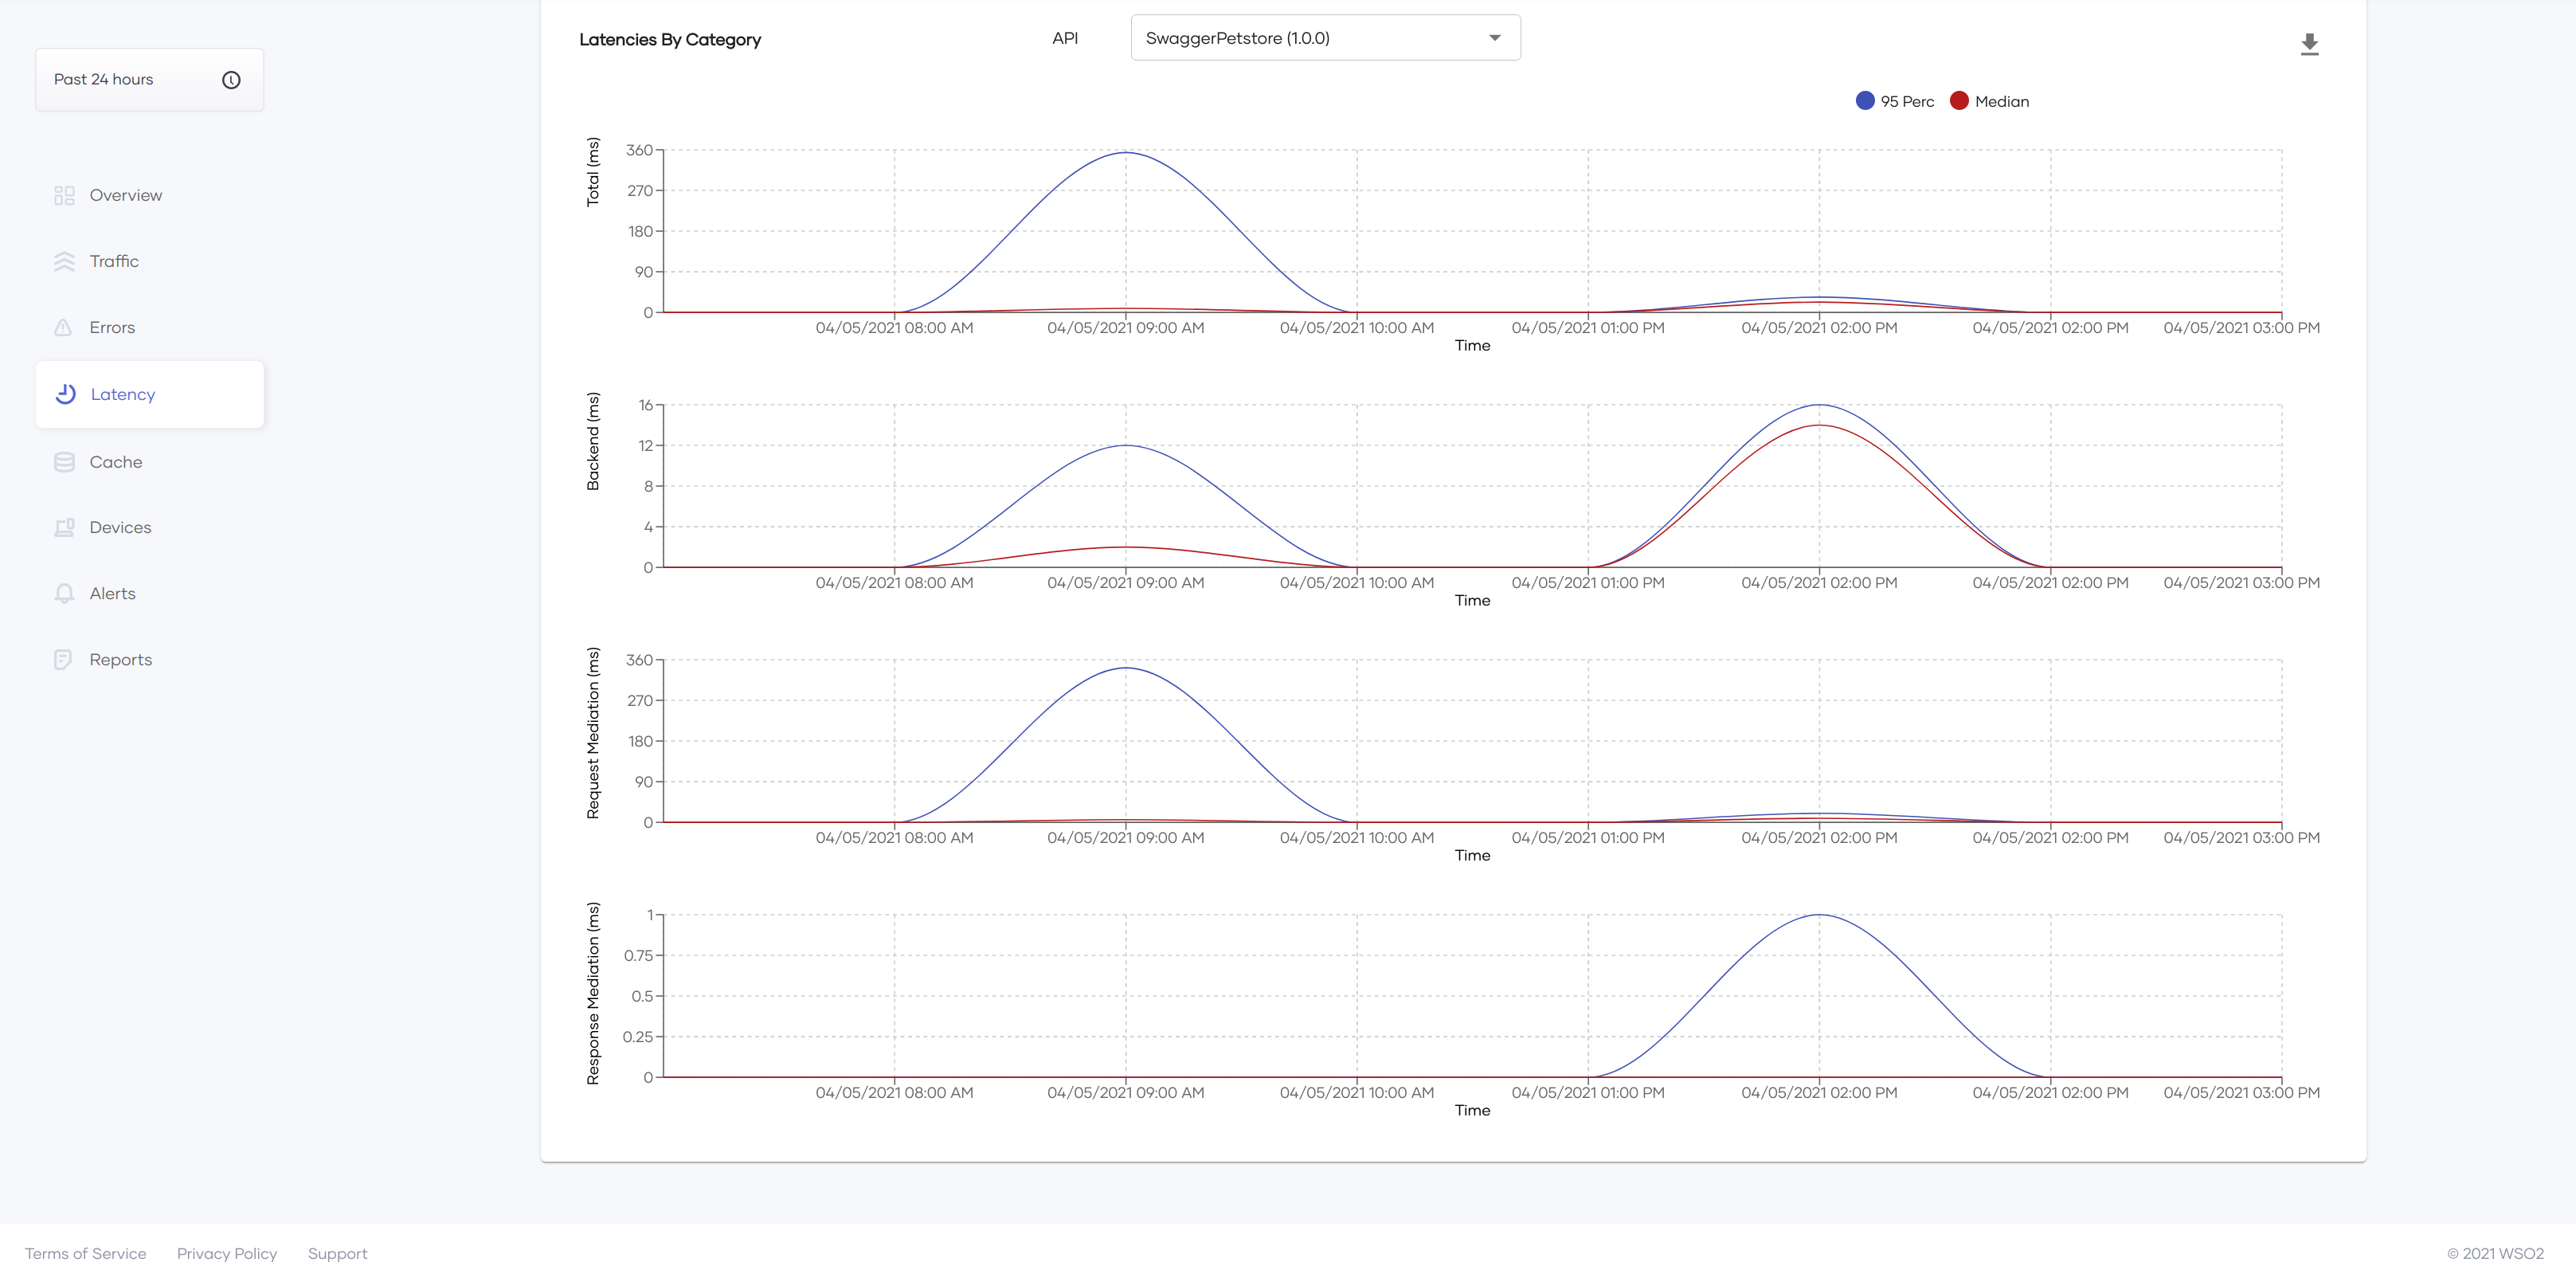
Go to Choreo Insights to view the statistics.
Here are some of the graphs generated in the Choreo cloud.
Configuring ELK Analytics
Follow the instructions below to configure ELK Analytics for Choreo Connect:
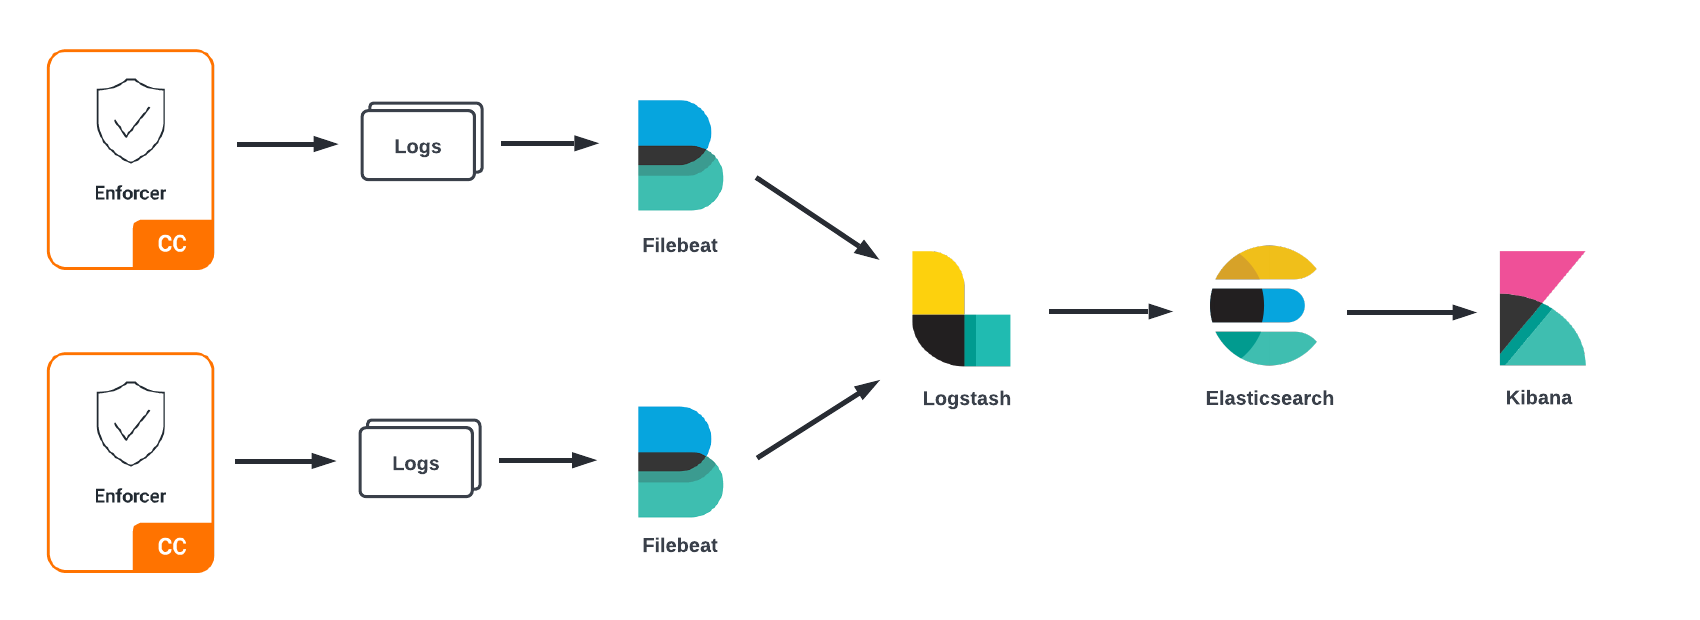
The Enforcer component in Choreo Connect can log analytics-related data to be used by Filebeat in ELK Stack. Data flow for the ELK Analytics can be depicted as given above.
Step 1 - Configure Choreo Connect
Step 1.1 - Configure the config.toml file
- Open the Choreo Connect configuration file according to the deployment type you are using.
Click here to see the configuration file location for your Choreo Connect deployment.
Navigate to the correct folder path and open the config.toml or config-toml-configmap.yaml file based on your Choreo Connect deployment.
| Deployment | Mode | File name | Directory |
|---|---|---|---|
| Docker Compose | Choreo Connect as a Standalone Gateway | config.toml |
<CHOREO-CONNECT_HOME>/docker-compose/choreo-connect/conf/ |
| Docker Compose | Choreo Connect with WSO2 API Manager as a Control Plane | config.toml |
<CHOREO-CONNECT_HOME>/docker-compose/choreo-connect-with-apim/conf/ |
| Kubernetes | Choreo Connect as a Standalone Gateway | config-toml-configmap.yaml |
<CHOREO-CONNECT_HOME>/k8s-artifacts/choreo-connect/ |
| Kubernetes | Choreo Connect with WSO2 API Manager as a Control Plane | config-toml-configmap.yaml |
<CHOREO-CONNECT_HOME>/k8s-artifacts/choreo-connect-with-apim/ |
-
Change the analytics section based on the following configurations.
The following configuration will enable the default reporter class (
org.wso2.am.analytics.publisher.reporter.elk.ELKMetricReporter).[analytics] enabled = true type = "ELK"
If you want to use a custom reporter class
If you want to use any other reporter class, follow the instructions below:
- Compile the new custom reporter implementation as a JAR file.
-
Mount it to the
/home/wso2/lib/dropinsdirectory within the Enforcer by adding the JAR file to the choreo-connect-1.x.x/docker-compose/resources/enforcer/dropins directory.Note
If you use Choreo Connect with Helm Charts, please refer to the documentation here to add a JAR file into the dropins directory.
- Set the value of the
publisher.reporter.classproperty to the class name of the new reporter implementation in theconfig.tomlfile as follows:
[analytics] enabled = true type = "ELK" [analytics.enforcer] [analytics.enforcer.configProperties] "publisher.reporter.class" = "org.wso2.am.analytics.publisher.sample.reporter.CustomReporter" - Set the value of the
Step 1.2 - Enable logs
The following are the two options that are available to retrieve the analytics logs.
Update the choreo-connect-1.x.x/docker-compose/choreo-connect(-with-apim)/conf/log4j2.properties file based on the selected analytics logs retrieval method as follows in order to configure the Filebeat agent.
-
Add a reporter to the loggers list.
loggers = reporter, ... (list of other available loggers) -
Add the following configurations after the loggers.
logger.reporter.name = org.wso2.am.analytics.publisher.reporter.elk
logger.reporter.level = INFO
logger.reporter.additivity = false
logger.reporter.appenderRef.rolling.ref = ENFORCER_CONSOLE
-
Add
ENFORCER_ANALYTICSto the appenders list.appenders = ENFORCER_ANALYTICS, ... (list of other available appenders) -
Add the following configuration after the appenders.
appender.ENFORCER_ANALYTICS.type = RollingFile appender.ENFORCER_ANALYTICS.name = ENFORCER_ANALYTICS appender.ENFORCER_ANALYTICS.fileName = logs/enforcer_analytics.log appender.ENFORCER_ANALYTICS.filePattern = /logs/enforcer_analytics-%d{MM-dd-yyyy}.log appender.ENFORCER_ANALYTICS.layout.type = PatternLayout appender.ENFORCER_ANALYTICS.layout.pattern = [%d] - %m%ex%n appender.ENFORCER_ANALYTICS.policies.type = Policies appender.ENFORCER_ANALYTICS.policies.time.type = TimeBasedTriggeringPolicy appender.ENFORCER_ANALYTICS.policies.time.interval = 1 appender.ENFORCER_ANALYTICS.policies.time.modulate = true appender.ENFORCER_ANALYTICS.policies.size.type = SizeBasedTriggeringPolicy appender.ENFORCER_ANALYTICS.policies.size.size=10MB appender.ENFORCER_ANALYTICS.strategy.type = DefaultRolloverStrategy appender.ENFORCER_ANALYTICS.strategy.max = 20 appender.ENFORCER_ANALYTICS.filter.threshold.type = ThresholdFilter appender.ENFORCER_ANALYTICS.filter.threshold.level = DEBUG -
Add a reporter to the loggers list.
loggers = reporter, ... (list of other available loggers) -
Add the following configurations after the loggers.
logger.reporter.name = org.wso2.am.analytics.publisher.reporter.elk
logger.reporter.level = INFO
logger.reporter.additivity = false
logger.reporter.appenderRef.rolling.ref = ENFORCER_ANALYTICS
Note
If you use a custom reporter class, update the logger.reporter.name property accordingly.
Step 2 - Set up the ELK Stack
-
Configure and setup the following elements in ELK Stack.
- Elasticsearch
- Kibana
- Logstash
- Filebeat
-
Configure the log file input source.
- Open the
filebeat.ymlfile. -
Configure the container log files as the input source.
  filebeat.inputs:
  - type: container
    enabled: true
    paths:
      - /var/lib/docker/containers/*/*.log
    include_lines: ['(apimMetrics):']
- Open the
Step 3 - Publish an API
Publish an API to Choreo Connect either via API Manager or apictl.
Step 4 - Invoke requests
Invoke a few requests (success and failure).
Step 5 - View the dashboards
Check the Kibana dashboard.
You will notice that the populated data appears in different dashboards.