ELK Dashboards for Micro Integrator
Dashboards
Overall Dashboard (wso2-mi-overall)
Gives you an idea about overall analytics.
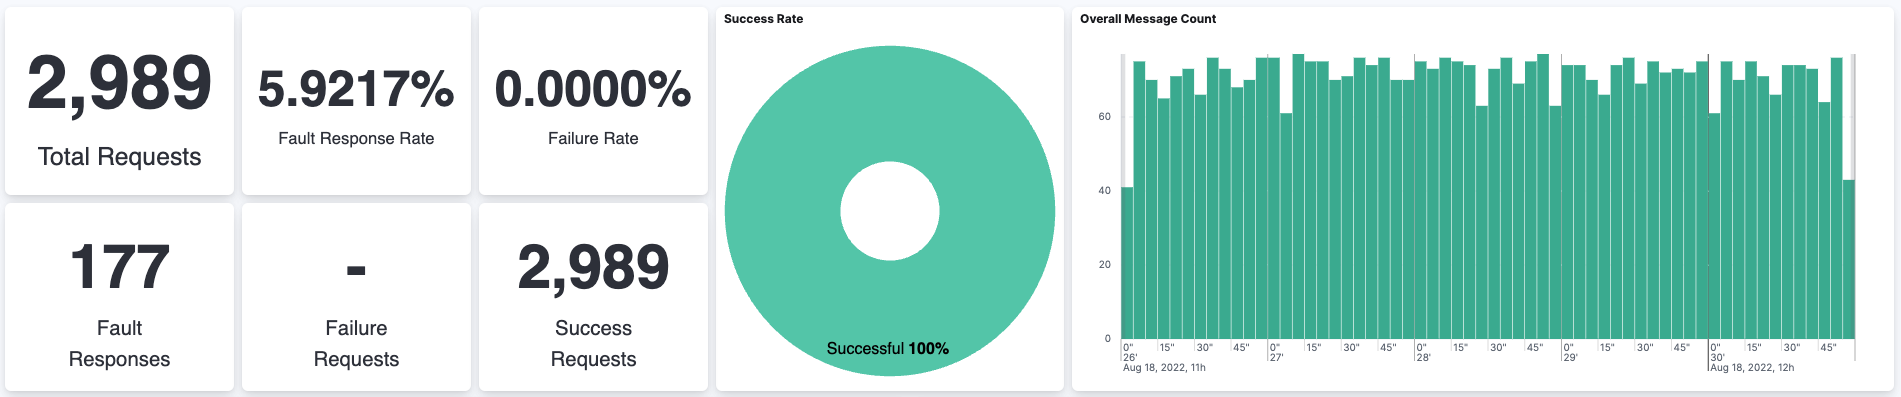
| Total Requests | Total number of requests handled by the Micro Integrator |
|---|---|
| Fault Response Rate | Fault response percentage |
| Failure Rate | Number of failure requests |
| Fault Responses | Total Number of fault responses. (Example HTTP status code 500) |
| Failure Requests | Total Number of requests that failed |
| Success Requests | Total Number of requests that were successful |
| Overall Message Count | Total number of requests received within the time span |
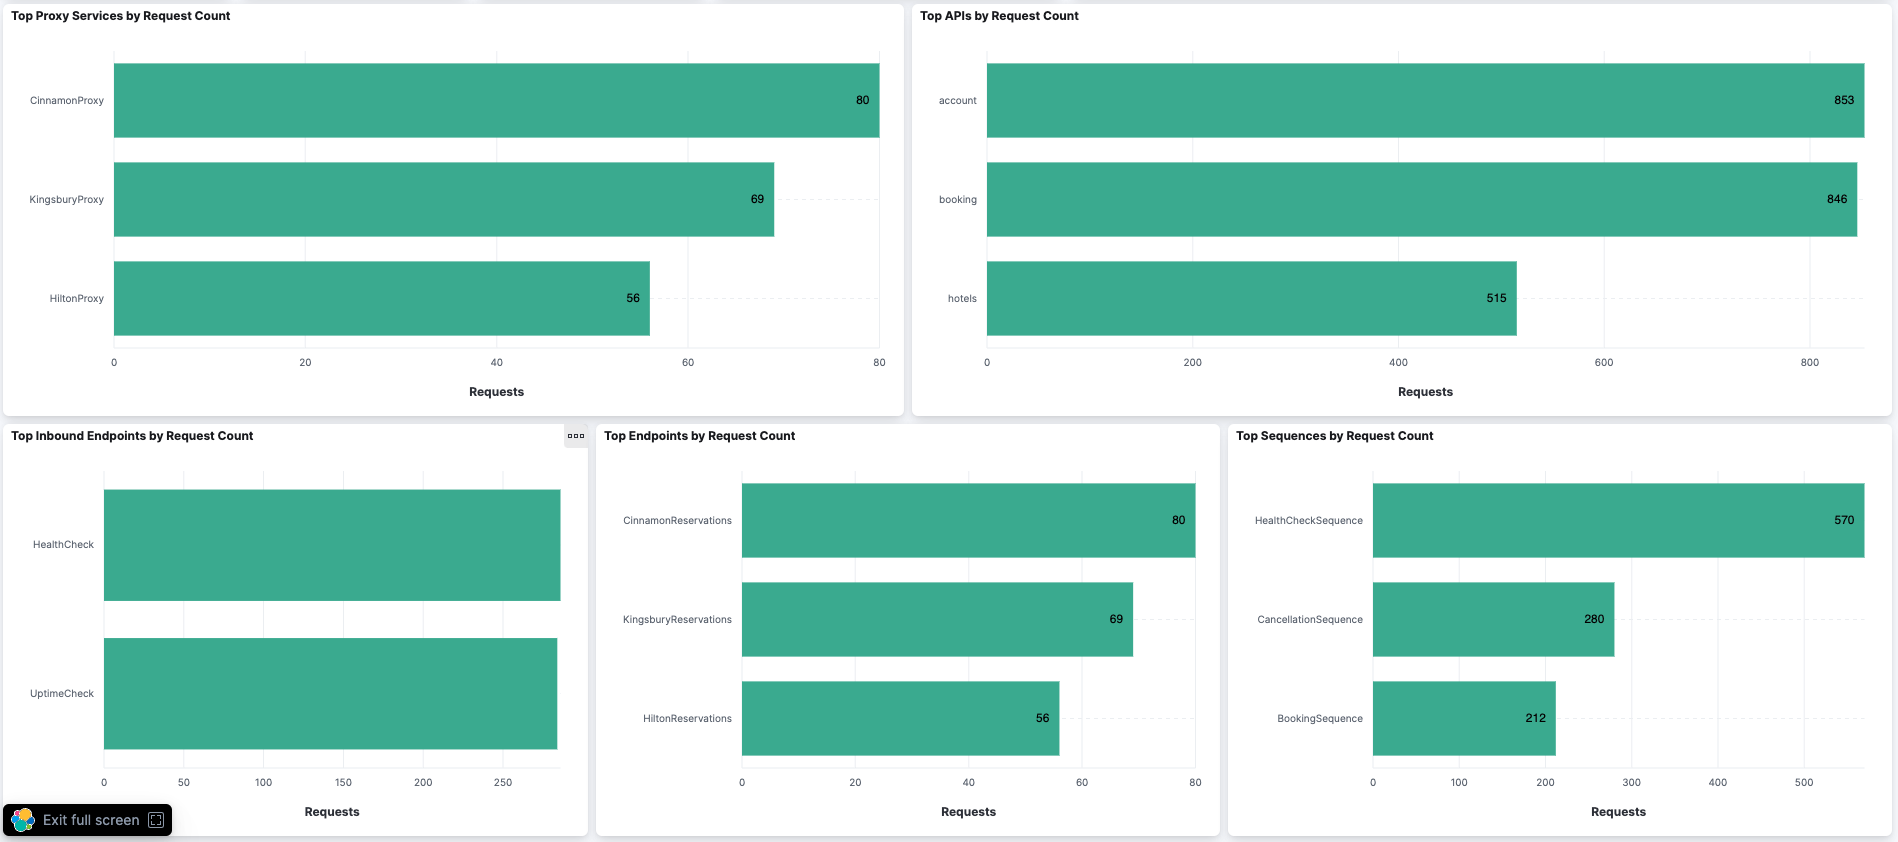
| Top Proxy Services by Request Count | Top Proxy services that served the highest number of requests |
| Top APIs by Request Count | Top APIs that served the highest number of requests |
| Top Inbound Endpoints by Request Count | Top Inbound Endpoints that served the highest number of requests |
| Top Endpoints by Request Count | Top Endpoints that served the highest number of requests |
| Top Sequences by Request Count | Top Endpoints that served the highest number of requests |
API Dashboard (wso2-mi-api)
Gives you an idea about API analytics.
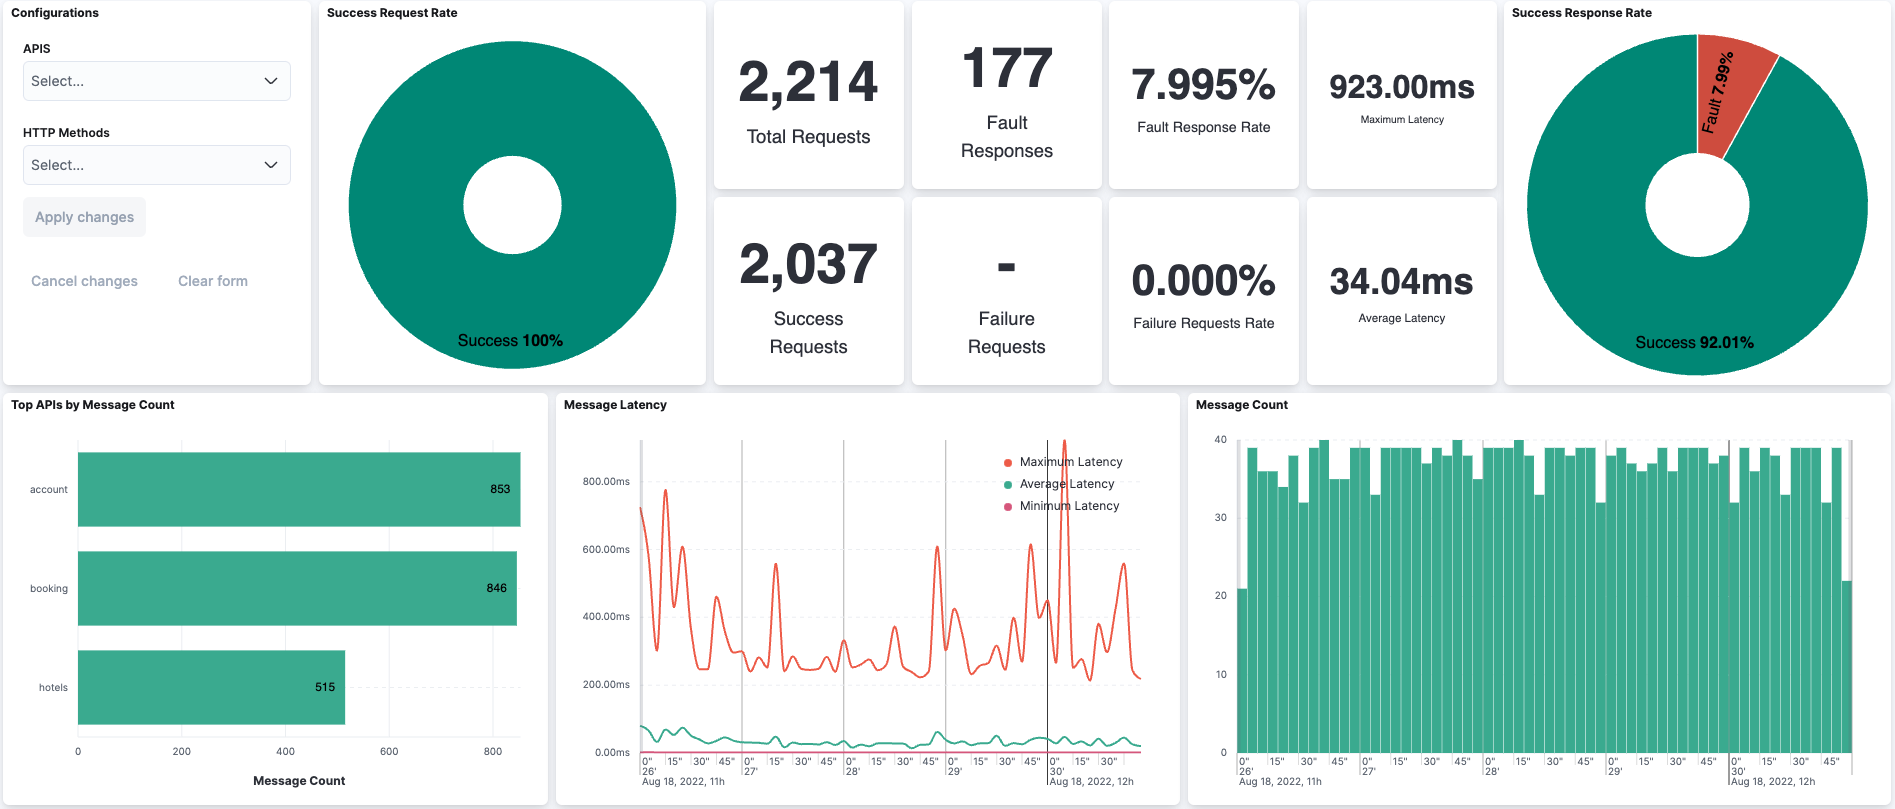
| Total Requests | Total number of requests handled by the APIs |
|---|---|
| Fault Response Rate | Fault response percentage |
| Failure Rate | Number of failure requests |
| Fault Responses | Total Number of fault responses. (Example HTTP status code 500) |
| Failure Requests | Total Number of requests that failed |
| Success Requests | Total Number of requests that were successful |
| Maximum Latency | Maximum latency recorded by a single request |
| Average Latency | Average latency for a request |
| Top APIs by Message Count | Top APIs that served the highest number of requests |
| Message Latency | Maximum, Minimum and Average latency for the messages in the time span |
| Message Count | Total number of requests received within the time span |
Endpoints Dashboard (wso2-mi-endpoints)
Gives you an idea about Endpoints analytics.

| Total Requests | Total number of requests handled by the Endpoints |
|---|---|
| Fault Response Rate | Fault response percentage |
| Failure Rate | Number of failure requests |
| Fault Responses | Total Number of fault responses. (Example HTTP status code 500) |
| Failure Requests | Total Number of requests that failed |
| Success Requests | Total Number of requests that were successful |
| Maximum Latency | Maximum latency recorded by a single request |
| Average Latency | Average latency for a request |
| Top Endpoints by Message Count | Top Endpoints that served the highest number of requests |
| Message Latency | Maximum, Minimum and Average latency for the messages in the time span |
| Message Count | Total number of requests received within the time span |
Inbound Endpoints Dashboard (wso2-mi-inbound-endpoints)
Gives you an idea about Inbound Endpoints analytics.
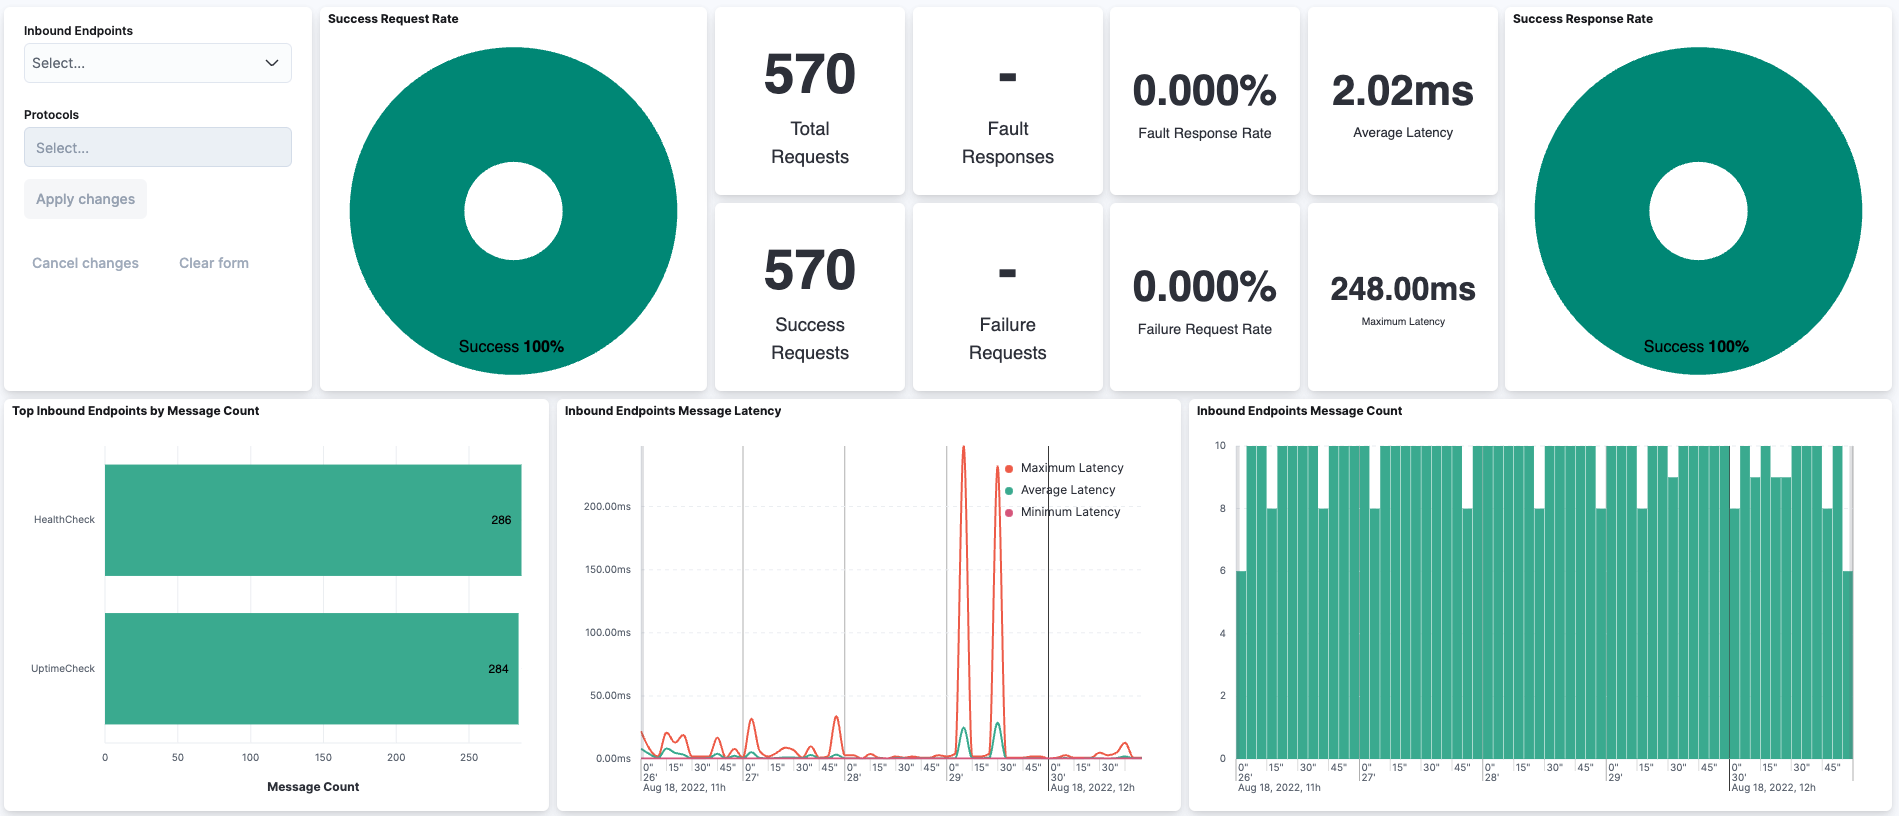
| Total Requests | Total number of requests handled by the Inbound Endpoints |
|---|---|
| Fault Response Rate | Fault response percentage |
| Failure Rate | Number of failure requests |
| Fault Responses | Total Number of fault responses. (Example HTTP status code 500) |
| Failure Requests | Total Number of requests that failed |
| Success Requests | Total Number of requests that were successful |
| Maximum Latency | Maximum latency recorded by a single request |
| Average Latency | Average latency for a request |
| Top Inbound Endpoints by Message Count | Top Inbound Endpoints that served the highest number of requests |
| Message Latency | Maximum, Minimum and Average latency for the messages in the time span |
| Message Count | Total number of requests received within the time span |
Sequences Dashboard (wso2-mi-sequences)
Gives you an idea about Sequences analytics.
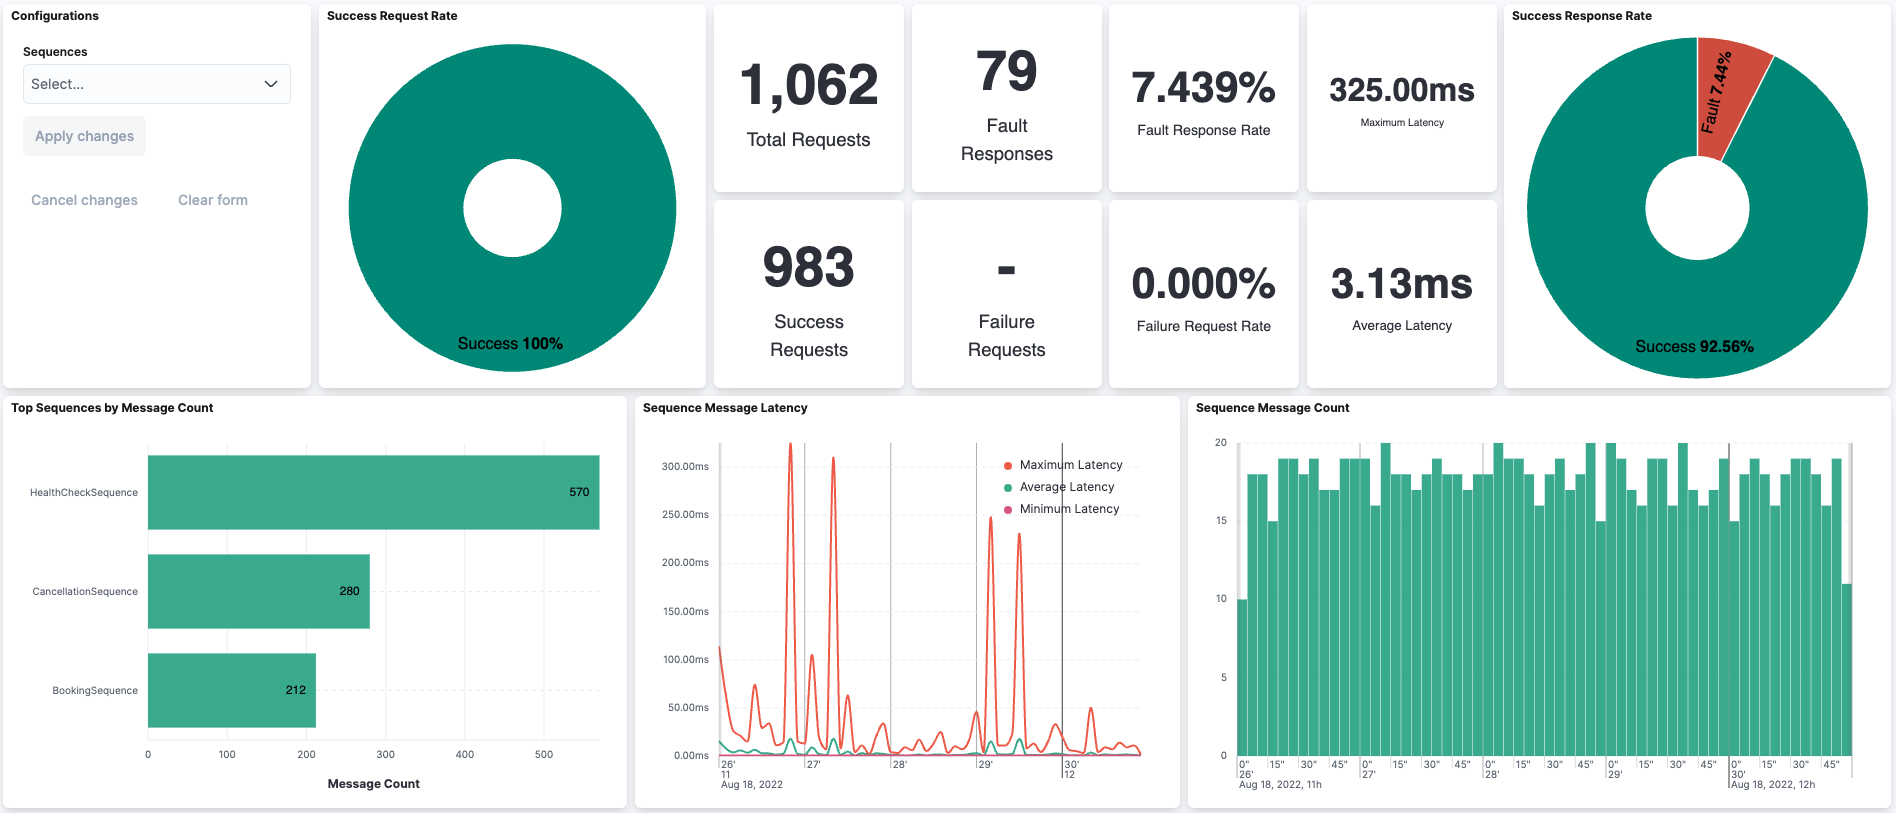
| Total Requests | Total number of requests handled by the Sequences |
|---|---|
| Fault Response Rate | Fault response percentage |
| Failure Rate | Number of failure requests |
| Fault Responses | Total Number of fault responses. |
| Failure Requests | Total Number of requests that failed |
| Success Requests | Total Number of requests that were successful |
| Maximum Latency | Maximum latency recorded by a single request |
| Average Latency | Average latency for a request |
| Top Sequences by Message Count | Top Sequences that served the highest number of requests |
| Message Latency | Maximum, Minimum and Average latency for the messages in the time span |
| Message Count | Total number of requests received within the time span |
Proxy Services Dashboard (wso2-mi-proxy-services)
Gives you an idea about Proxy Services analytics.
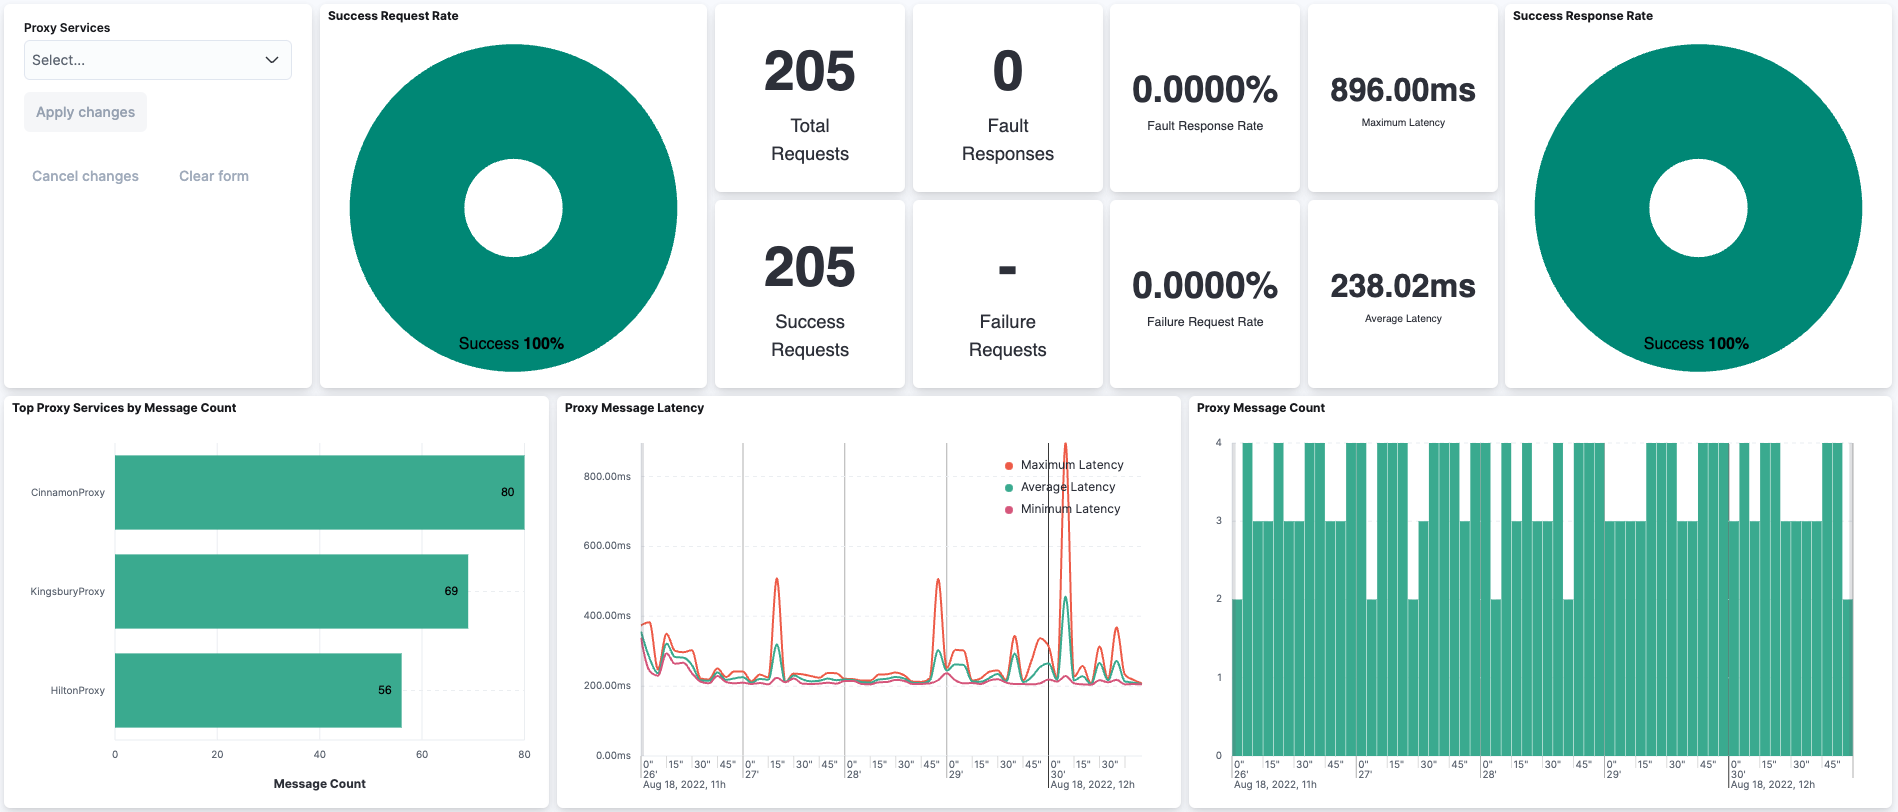
| Total Requests | Total number of requests handled by the Proxy Services |
|---|---|
| Fault Response Rate | Fault response percentage |
| Failure Rate | Number of failure requests |
| Fault Responses | Total Number of fault responses. (Example HTTP status code 500) |
| Failure Requests | Total Number of requests that failed |
| Success Requests | Total Number of requests that were successful |
| Maximum Latency | Maximum latency recorded by a single request |
| Average Latency | Average latency for a request |
| Top Proxy Services by Message Count | Top Proxy Services which served the highest number of requests |
| Message Latency | Maximum, Minimum and Average latency for the messages in the time span |
| Message Count | Total number of requests received within the time span |
Creating Advanced Dashboards
This section will help you to setup advanced dashboards using custom metadata. Use this documentation by Elastic to explore what kind of dashboard widgets you can create.
Assume you have a user registration AP deployed through a WSO2 Micro Integrator, which accepts JSON POST requests, and within that request, the body contains user age and country. You can publish the age and country with API analytics and create a visualization in the Kibana dashboard.
Example API:
<?xml version="1.0" encoding="UTF-8"?>
<api xmlns="http://ws.apache.org/ns/synapse" name="userRegistrationAPI" context="/user">
   <resource methods="POST" uri-template="/signup">
      <inSequence>
         <property name="newUserAge" expression="json-eval($.age)" scope="analytics" type="INTEGER" />
         <property name="newUserLocation" expression="json-eval($.country)" scope="analytics"/>
         <respond/>
      </inSequence>
   </resource>
</api>
To add data into the publishing analytics, you can use the Property Mediator. Any data that you add to the ANALYTICS scope will be published to Elastic Stack. In this example, age and country are being added into the analytics scope as newUserAge and newUserLocation.
{
  "timestamp": "2022-07-20T14:03:16.190979Z",
  "payload": {
    "httpMethod": "POST",
    "entityType": "API",
    "metadata": {
      "newUserAge": 28,
      "newUserLocation": "AU"
    },
    "latency": 1,
    "apiDetails": {
      "method": "POST",
      "apiContext": "/user",
      "subRequestPath": "/signup",
      "api": "userRegistrationAPI",
    },
    "faultResponse": false,
  },
  "serverInfo": { … },
  "schemaVersion": 1
}
These custom data will be published under metadata inside the payload.