Debugging Mediation
Once you deploy and run your integration solution, you may encounter errors and identify the required modifications for your artifacts. Use the mediation debugging feature in WSO2 Integration Studio to troubleshoot errors.
There are two ways to debug a developed mediation flow.
- Instant debugging using the Micro Integrator packaged with WSO2 Integration Studio.
- Deploy artifacts to an external Micro Integrator server and debug.
Above two approaches are discussed in detail below.
Instant debugging using Micro Integrator
-
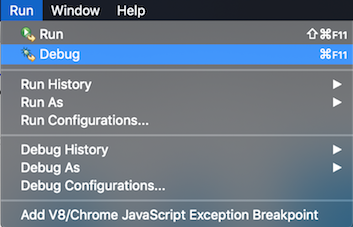
When project artifacts are ready, select the project you want to debug and click Run -> Debug.
-
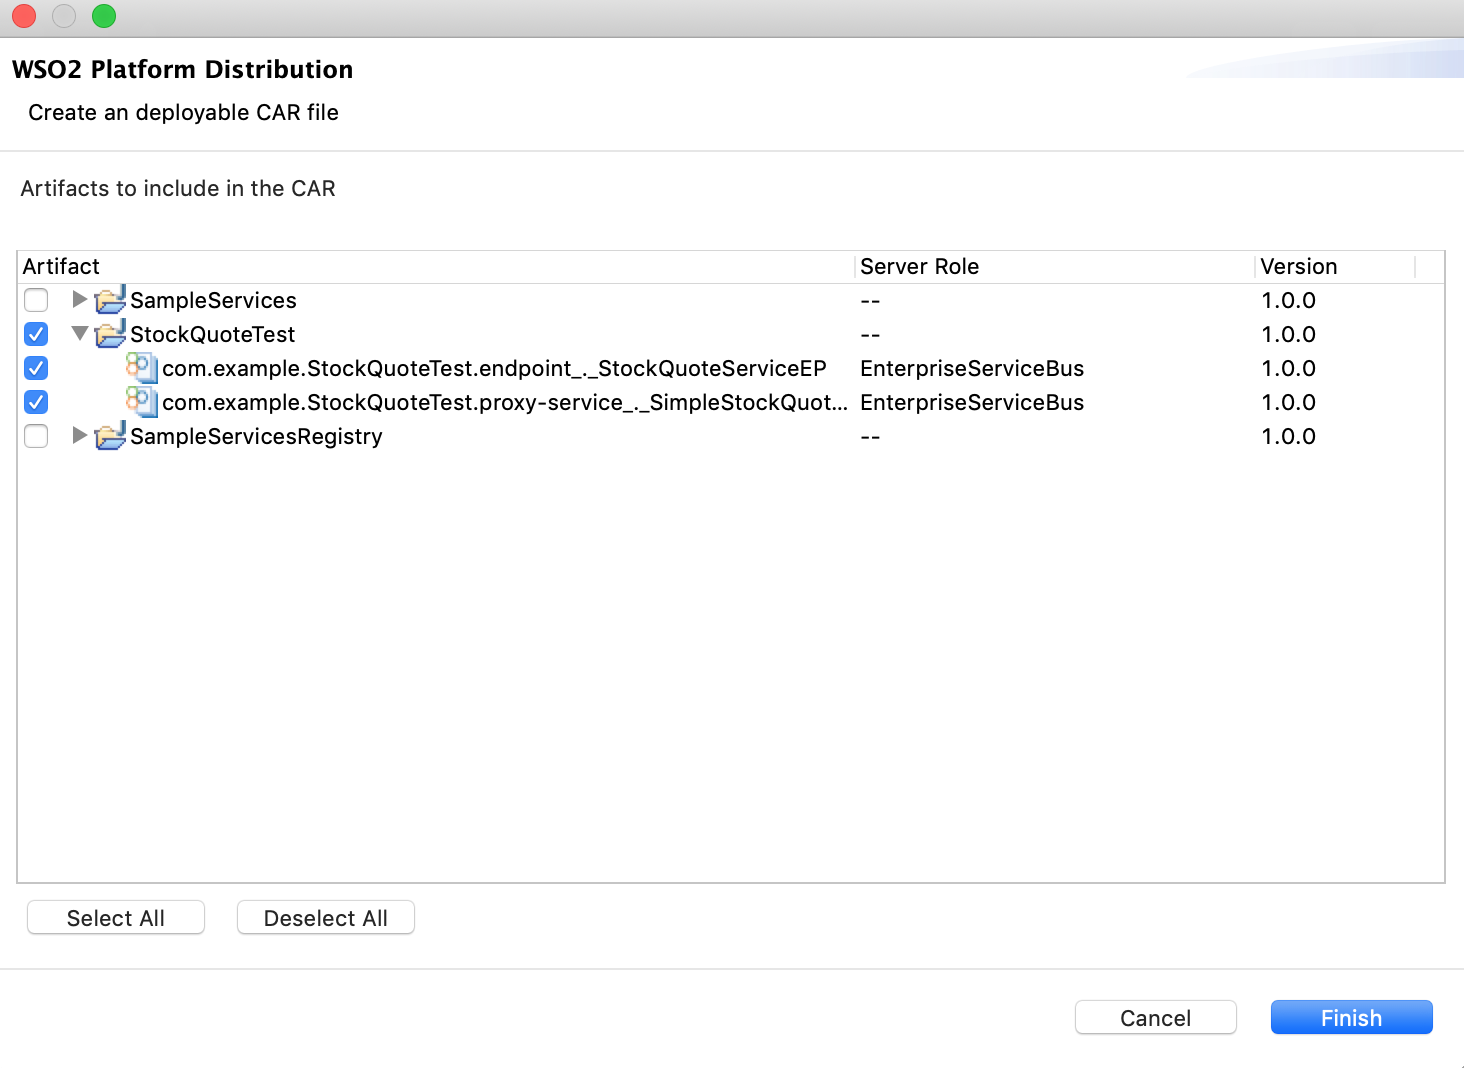
It will ask to choose the artifacts those needs to be deployed to the embedded Micro Integrator. Internally WSO2 Integration Studio will generate a CAR application with chosen artifacts and deploy.
- On the console of WSO2 Integration Studio, notice that Micro Integrator is started with the artifacts deployed. HTTP traffic is listened on the 8290 port.
- Add some breakpoints in the flow as below. You can mark a particular
mediator as a breakpoint.

-
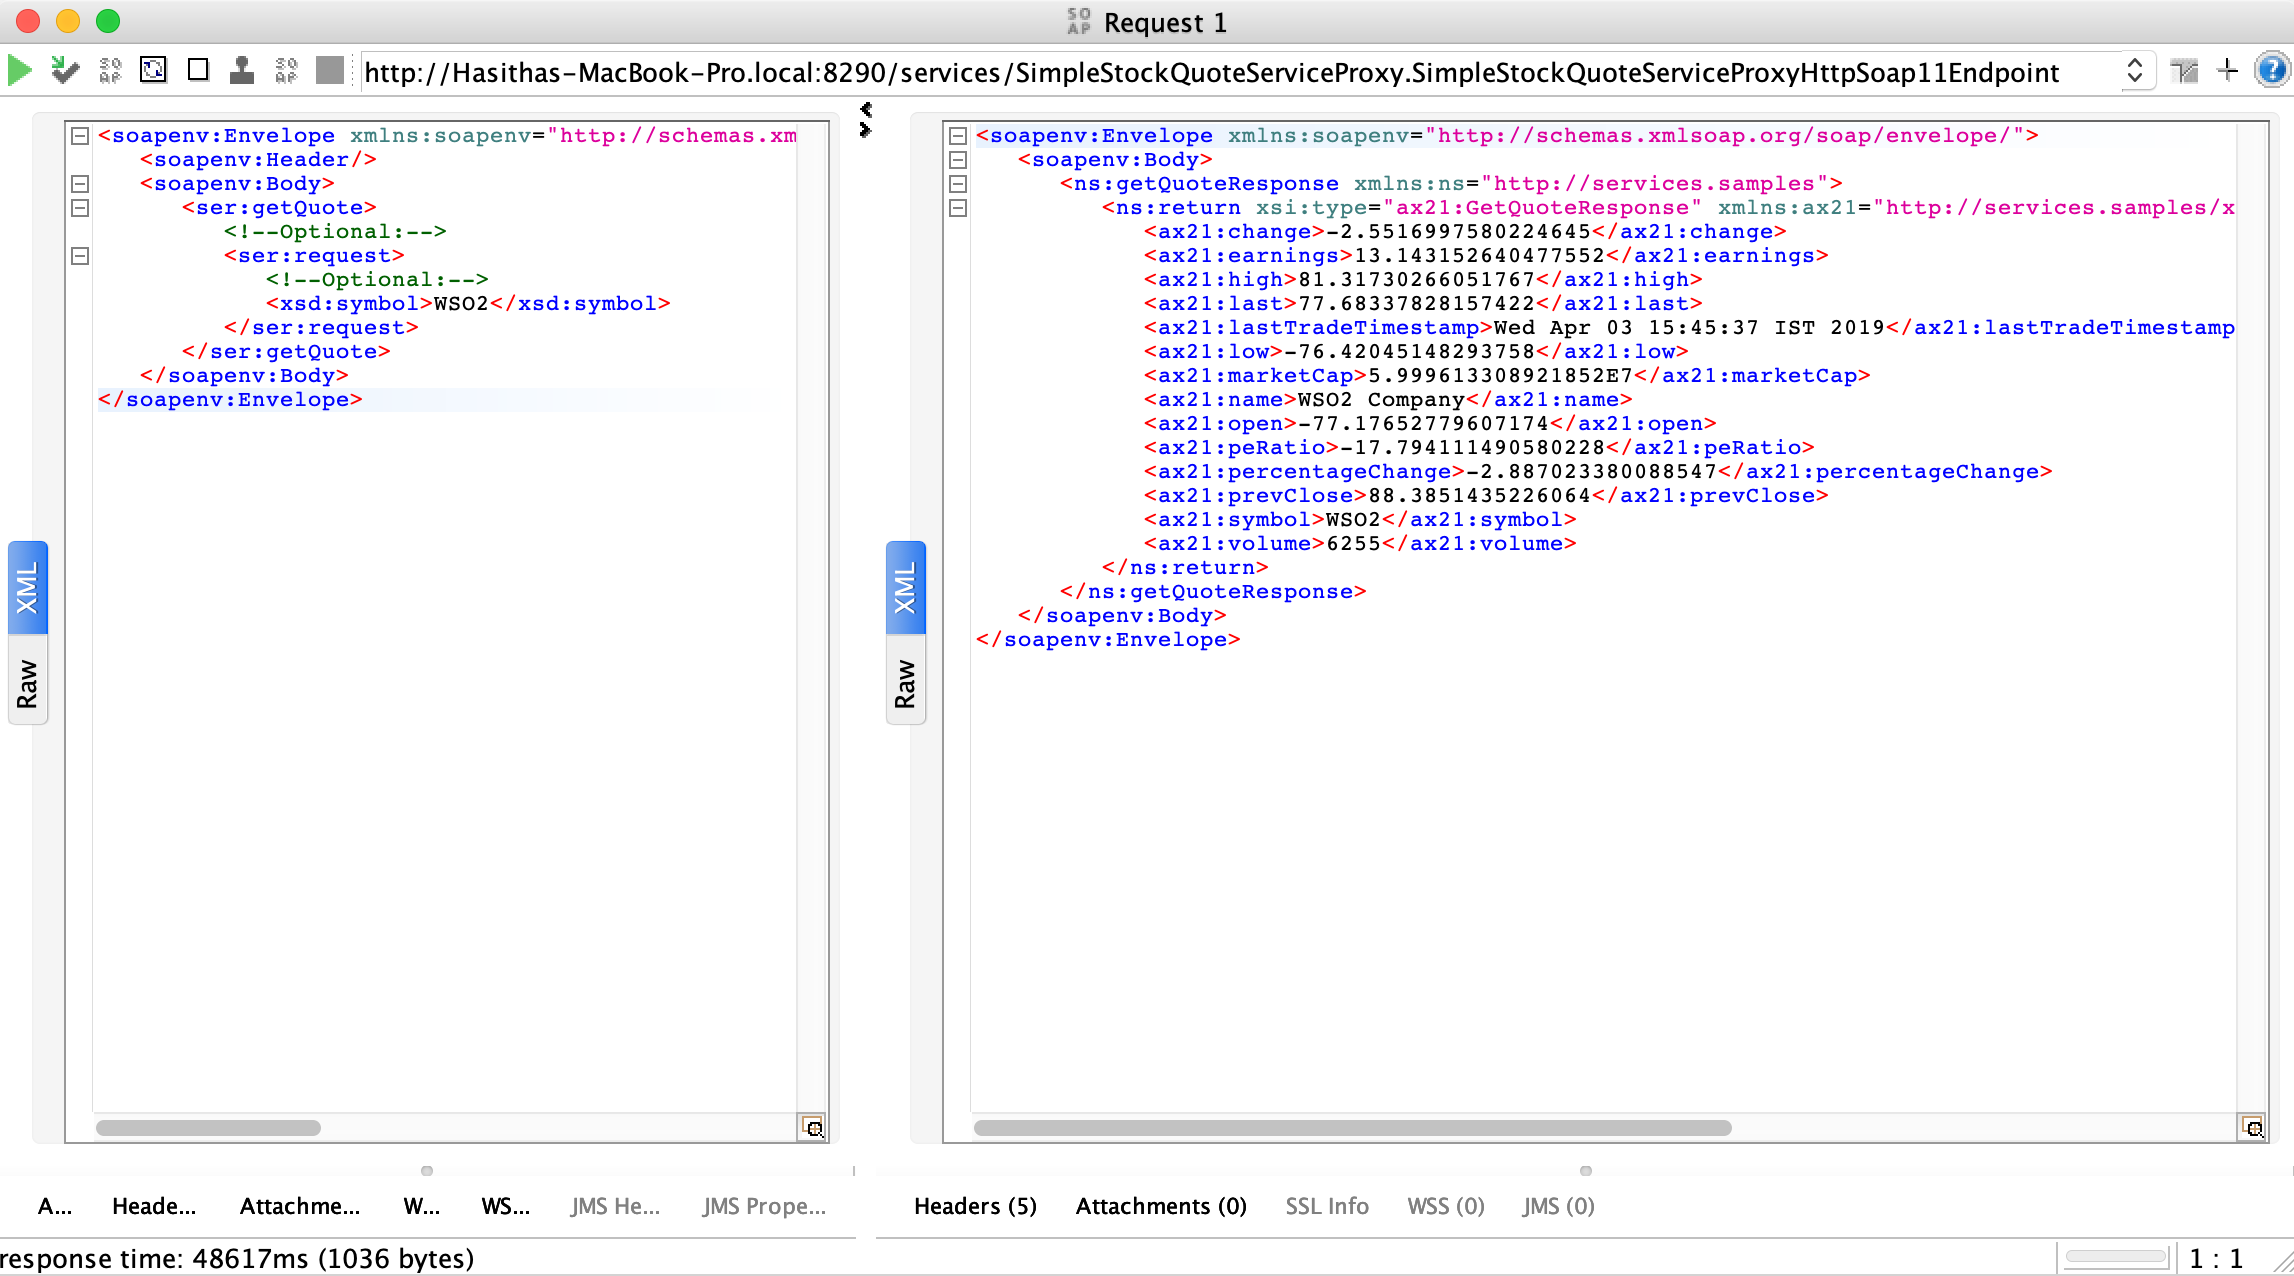
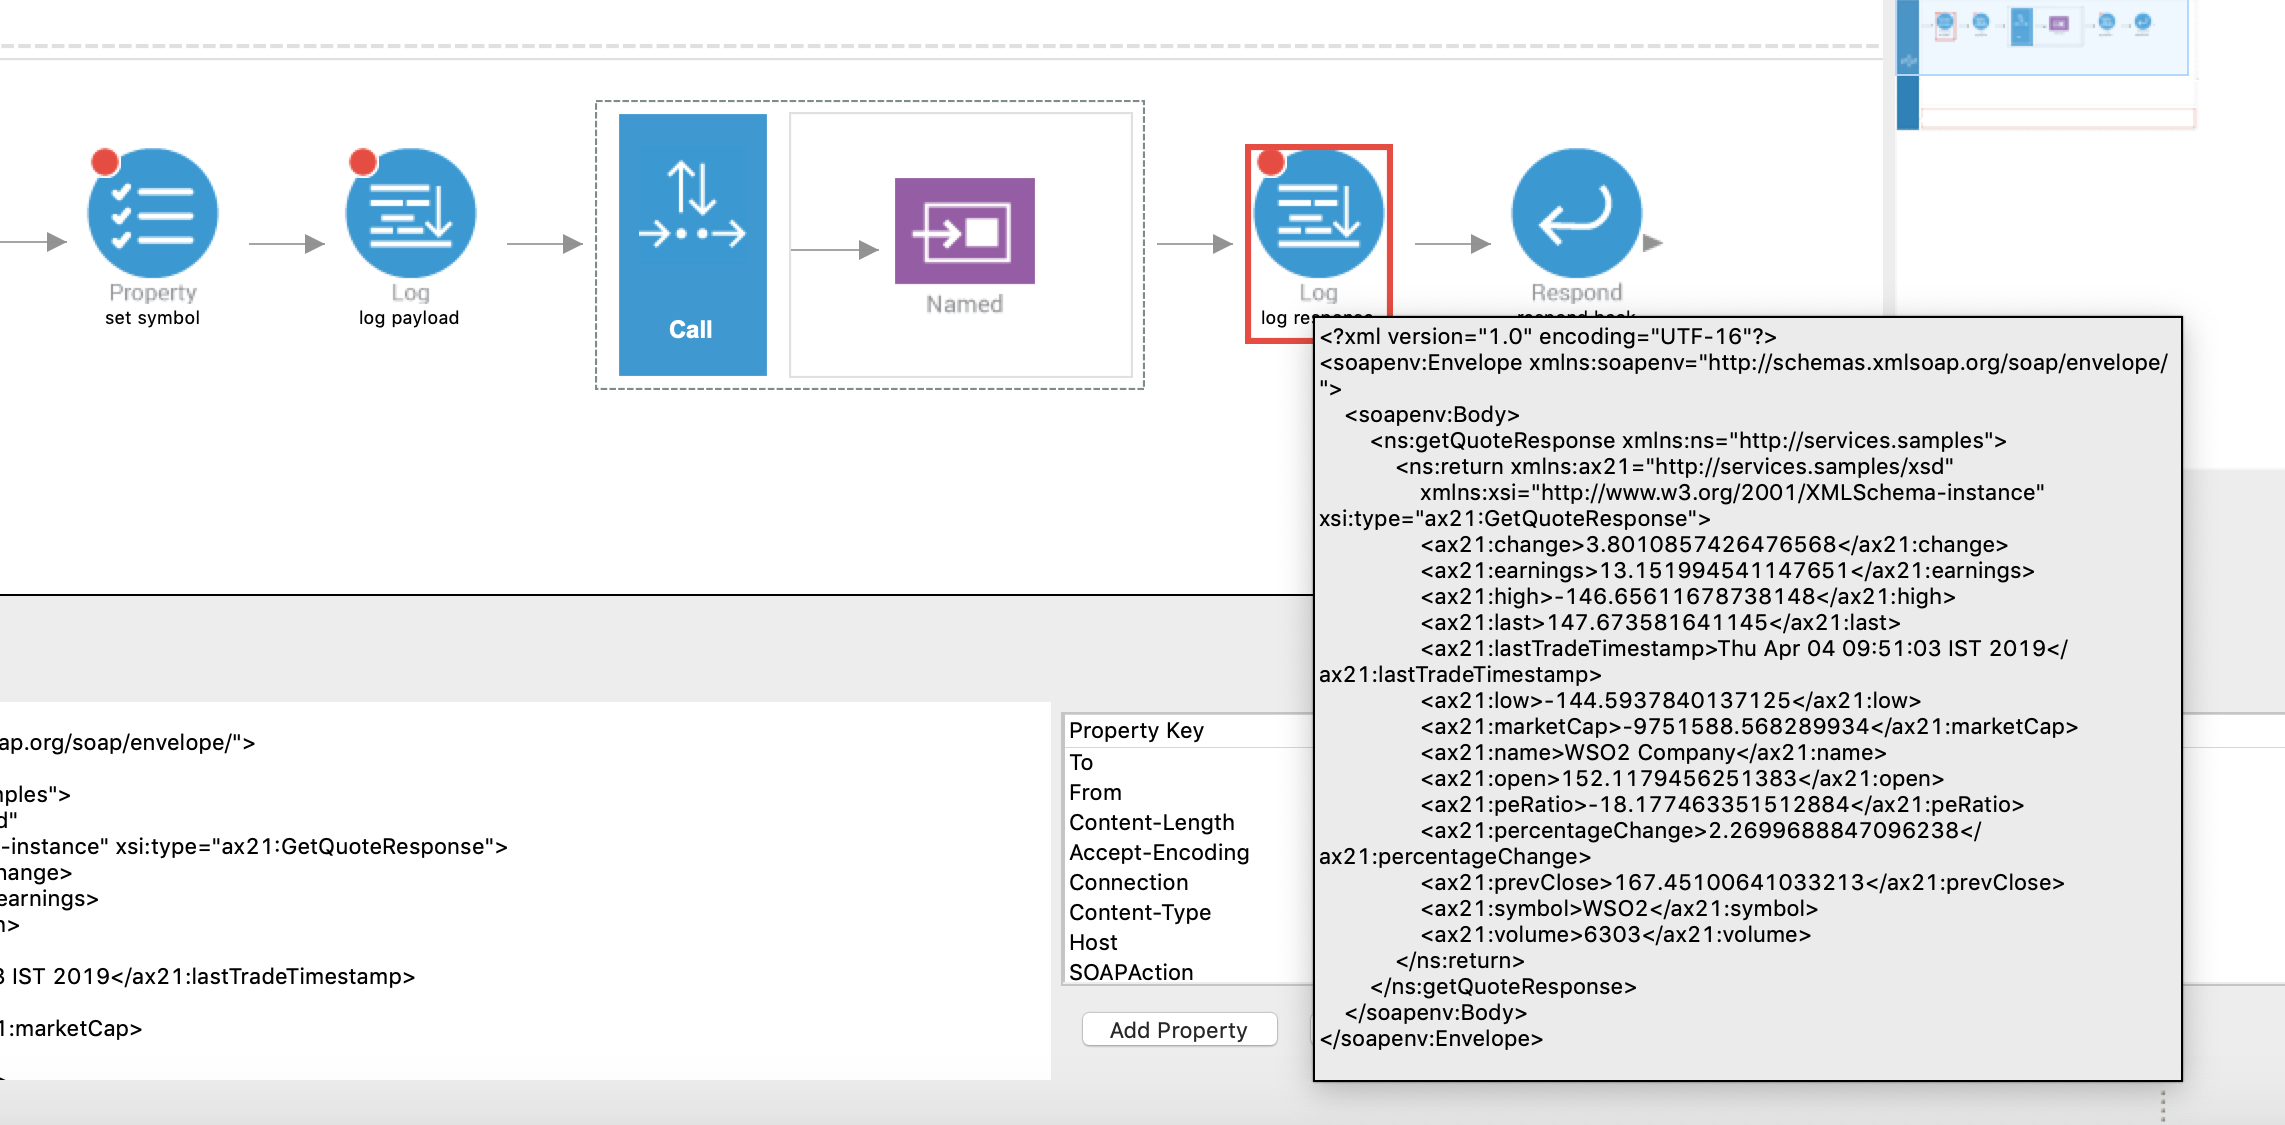
Invoke the service using SOAP UI or some external client. As soon as a request comes to the proxy service, the first break point will be triggered.
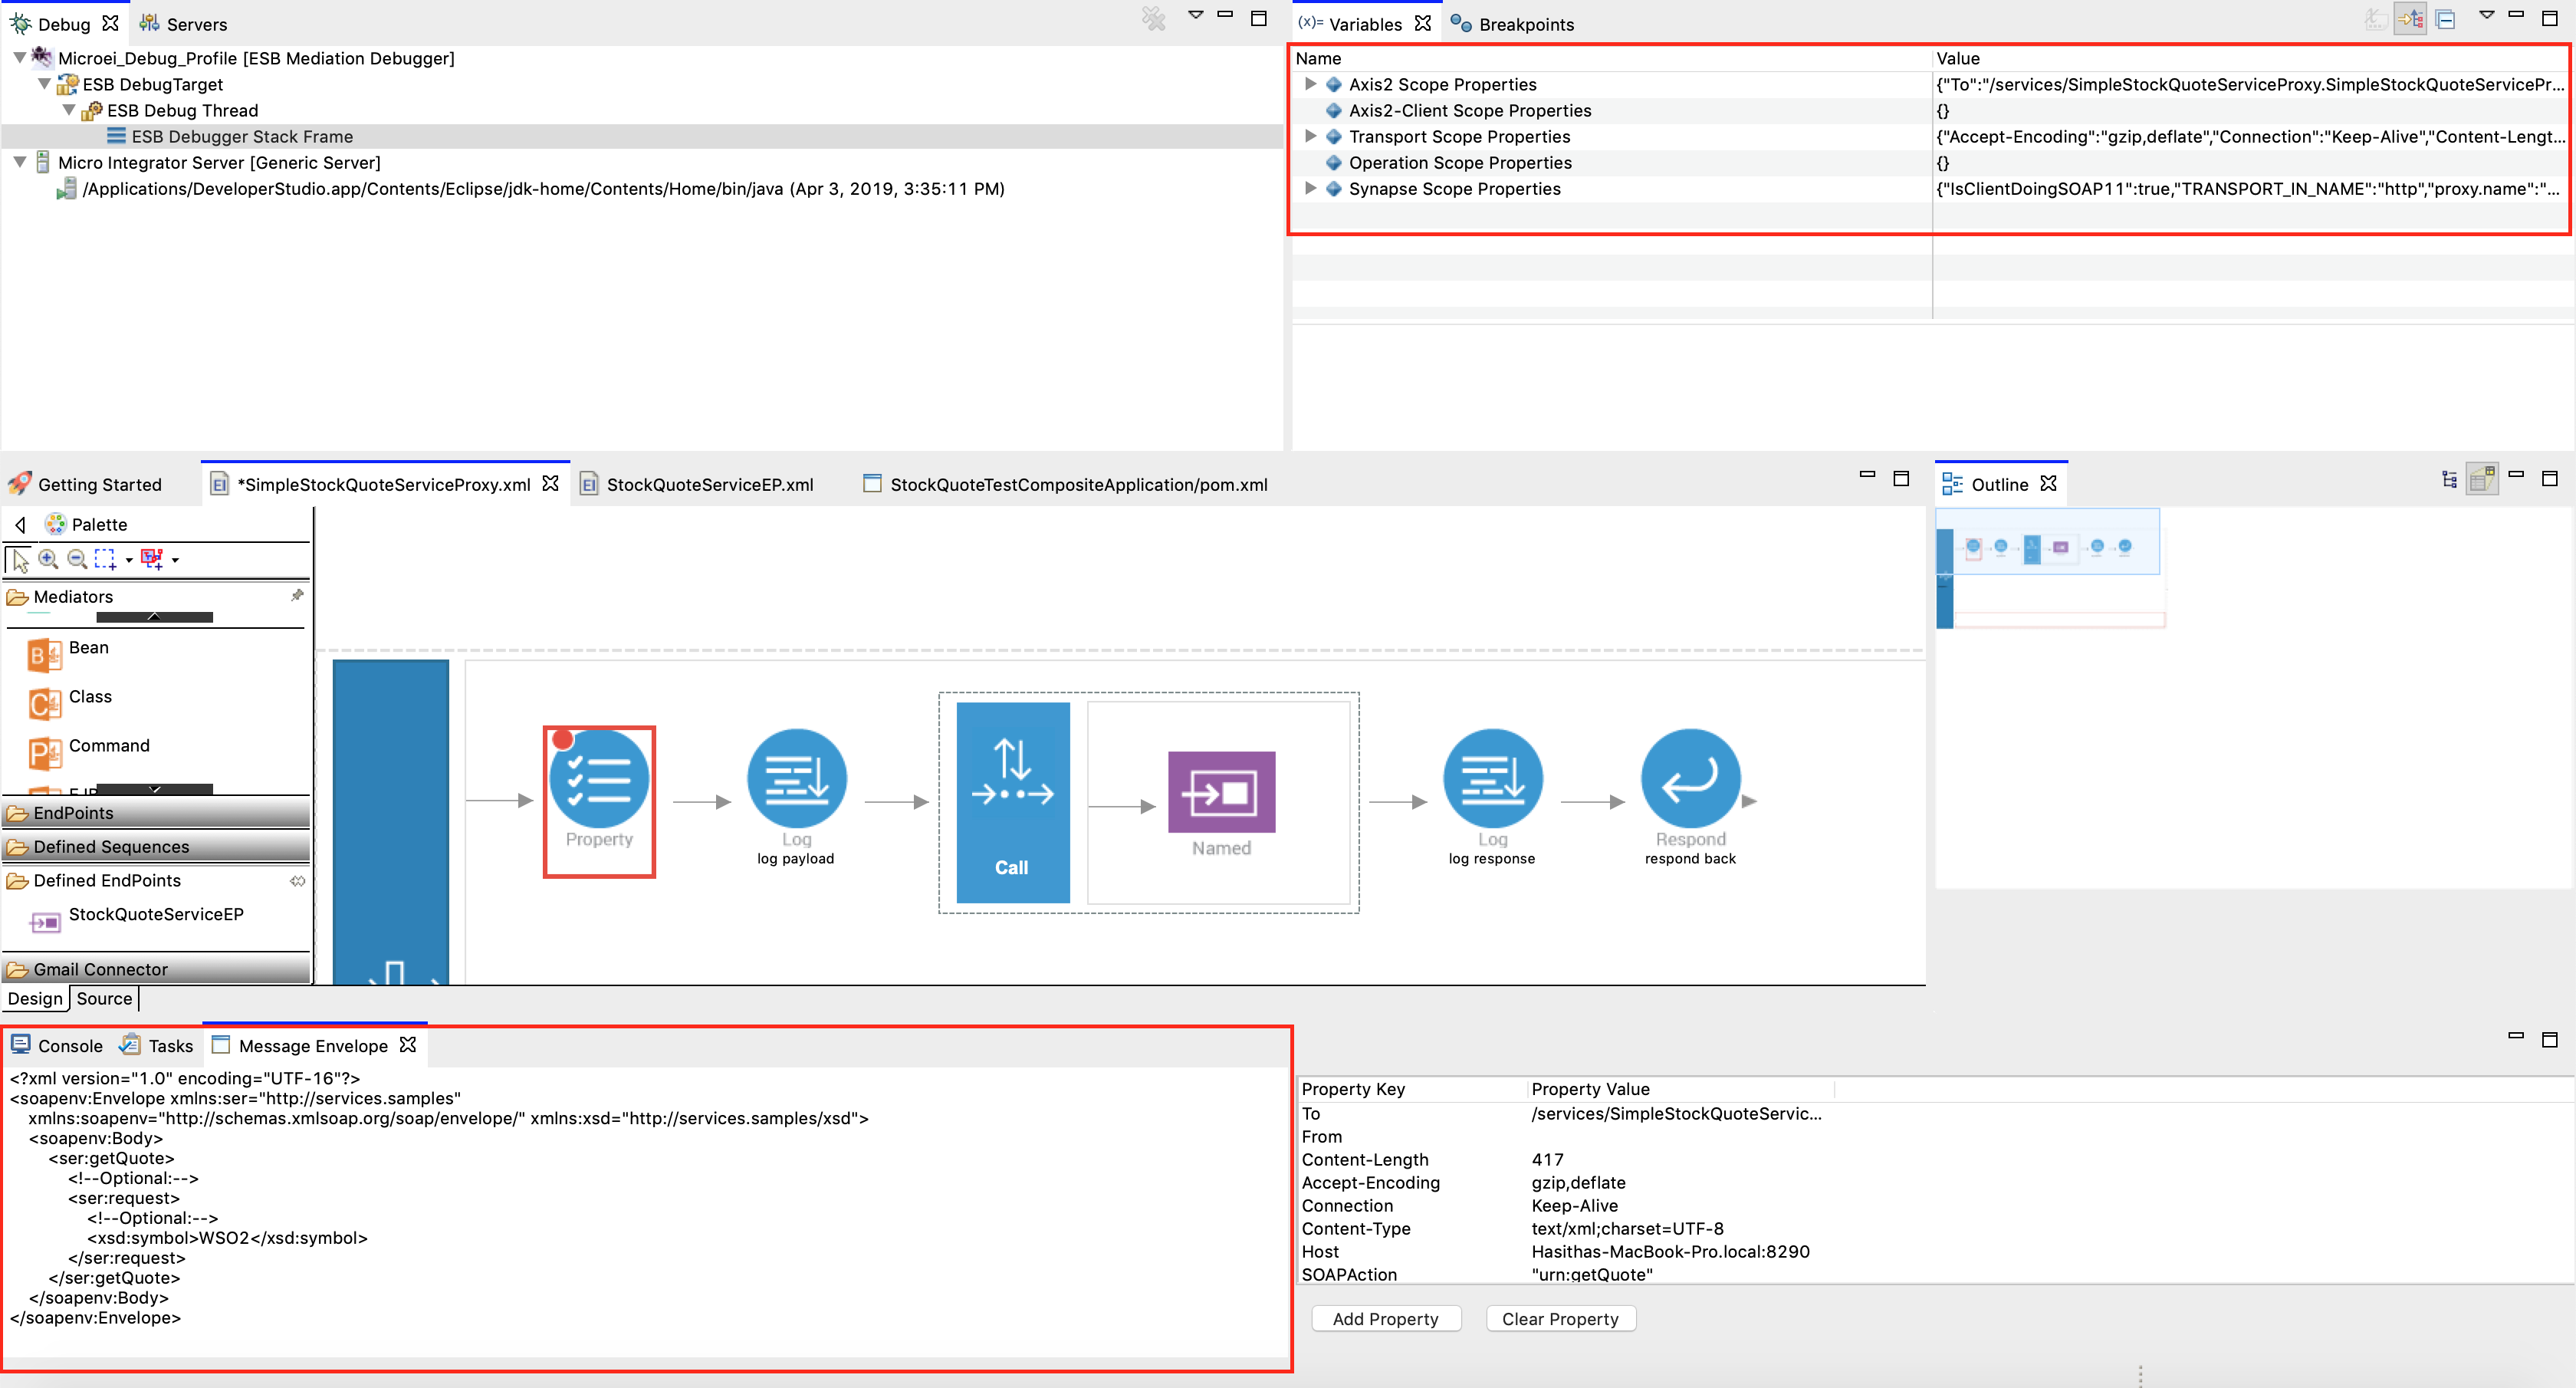 Note that you can view the payload that comes into the mediator and
the properties that you can access on the message context.
Note that you can view the payload that comes into the mediator and
the properties that you can access on the message context. -
Click Continue. Then the message will be sent to the backend by the Call mediator and the next breakpoint (the log mediator) will be triggered.
Note that responses can be viewed on Message Envelope tab. The property set before calling the endpoint is also accessible in the context. 7. Click Continue again. Response will be received by the client.
Debugging with external Micro Integrator
Follow the steps below to enable debugging with respect to mediation.
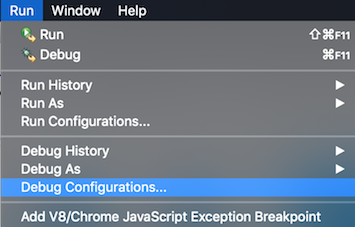
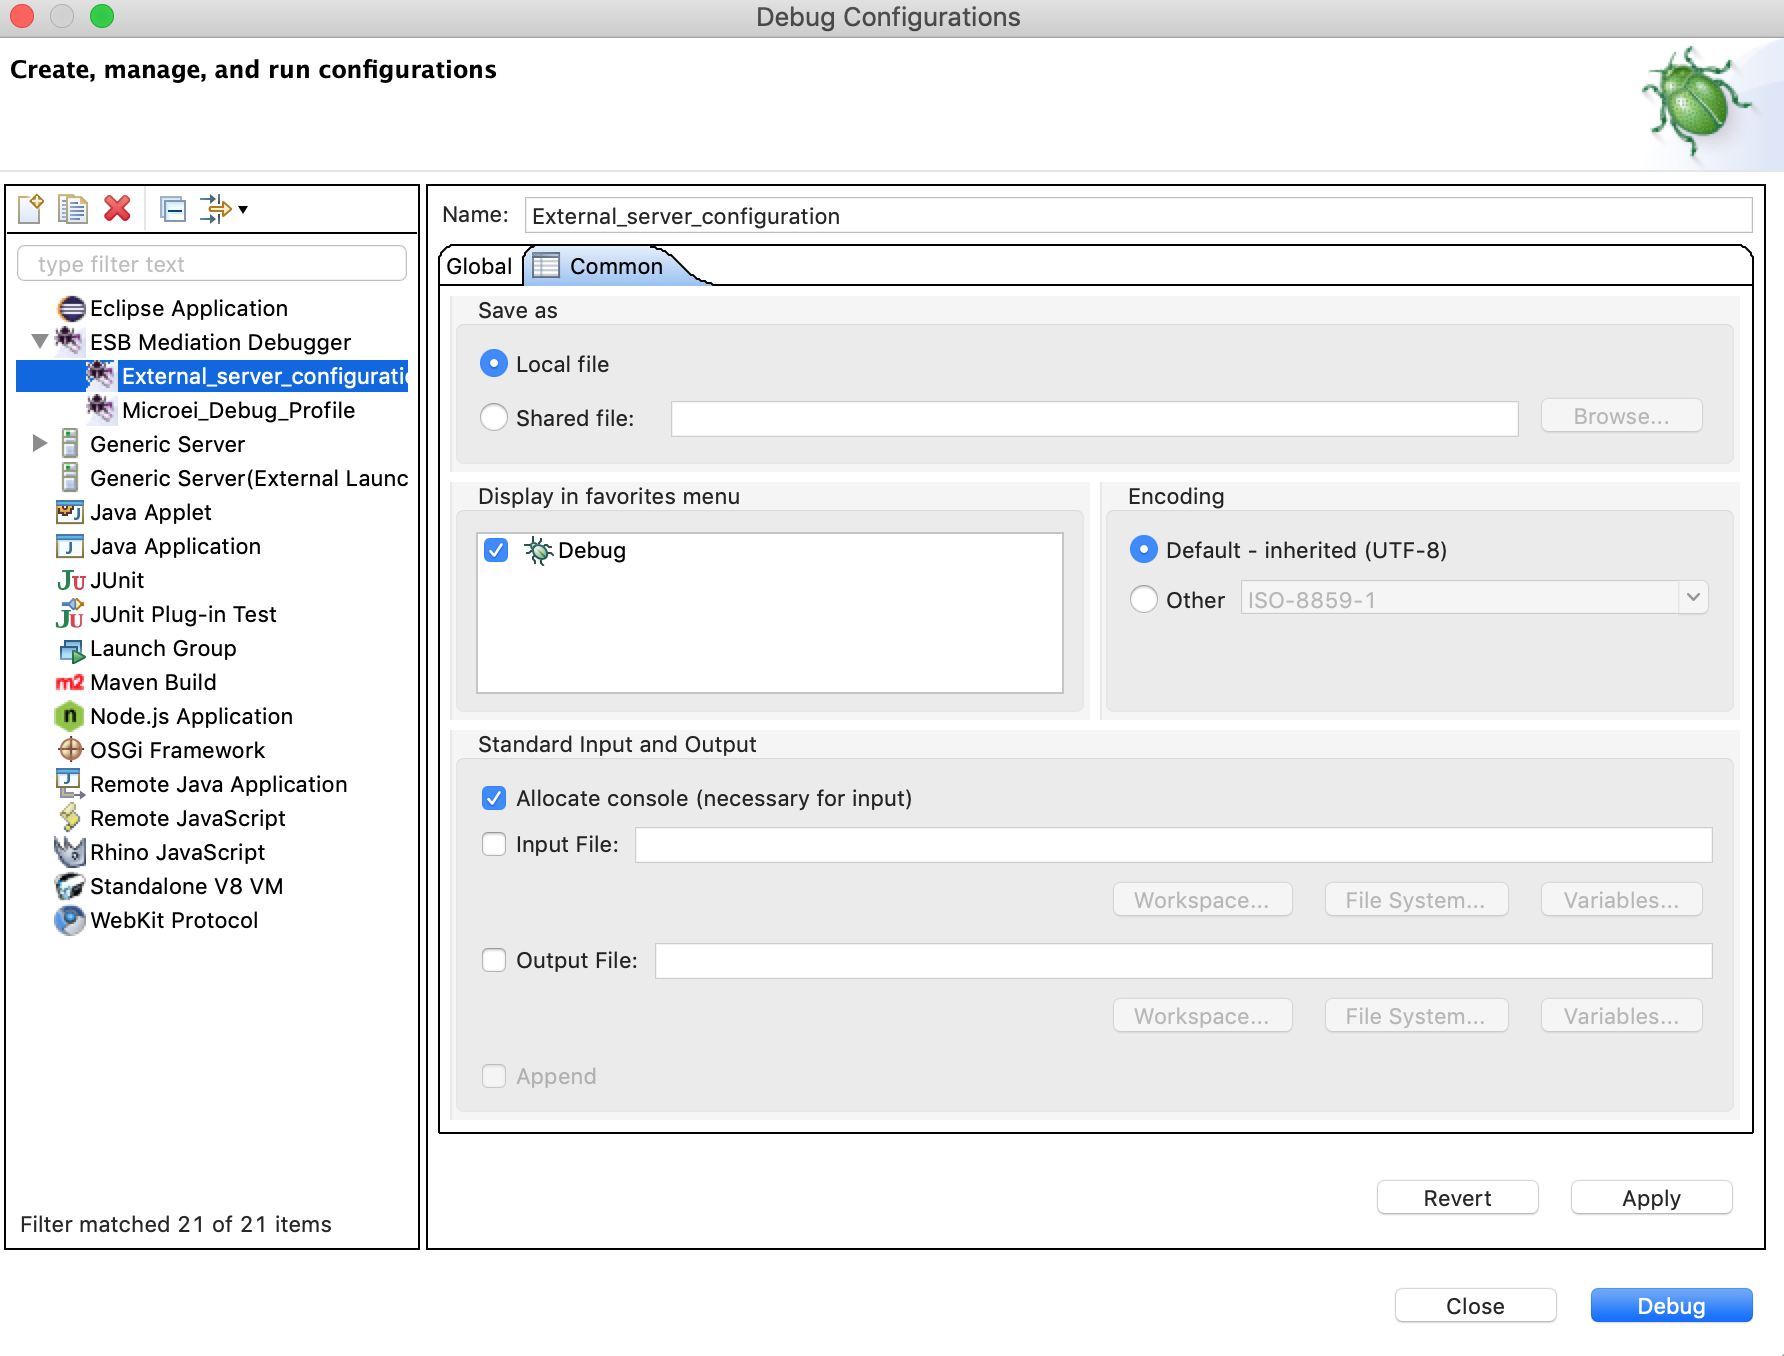
- Click Run in the top menu of the WSO2 Integration Studio, and
then click Debug Configurations .
-
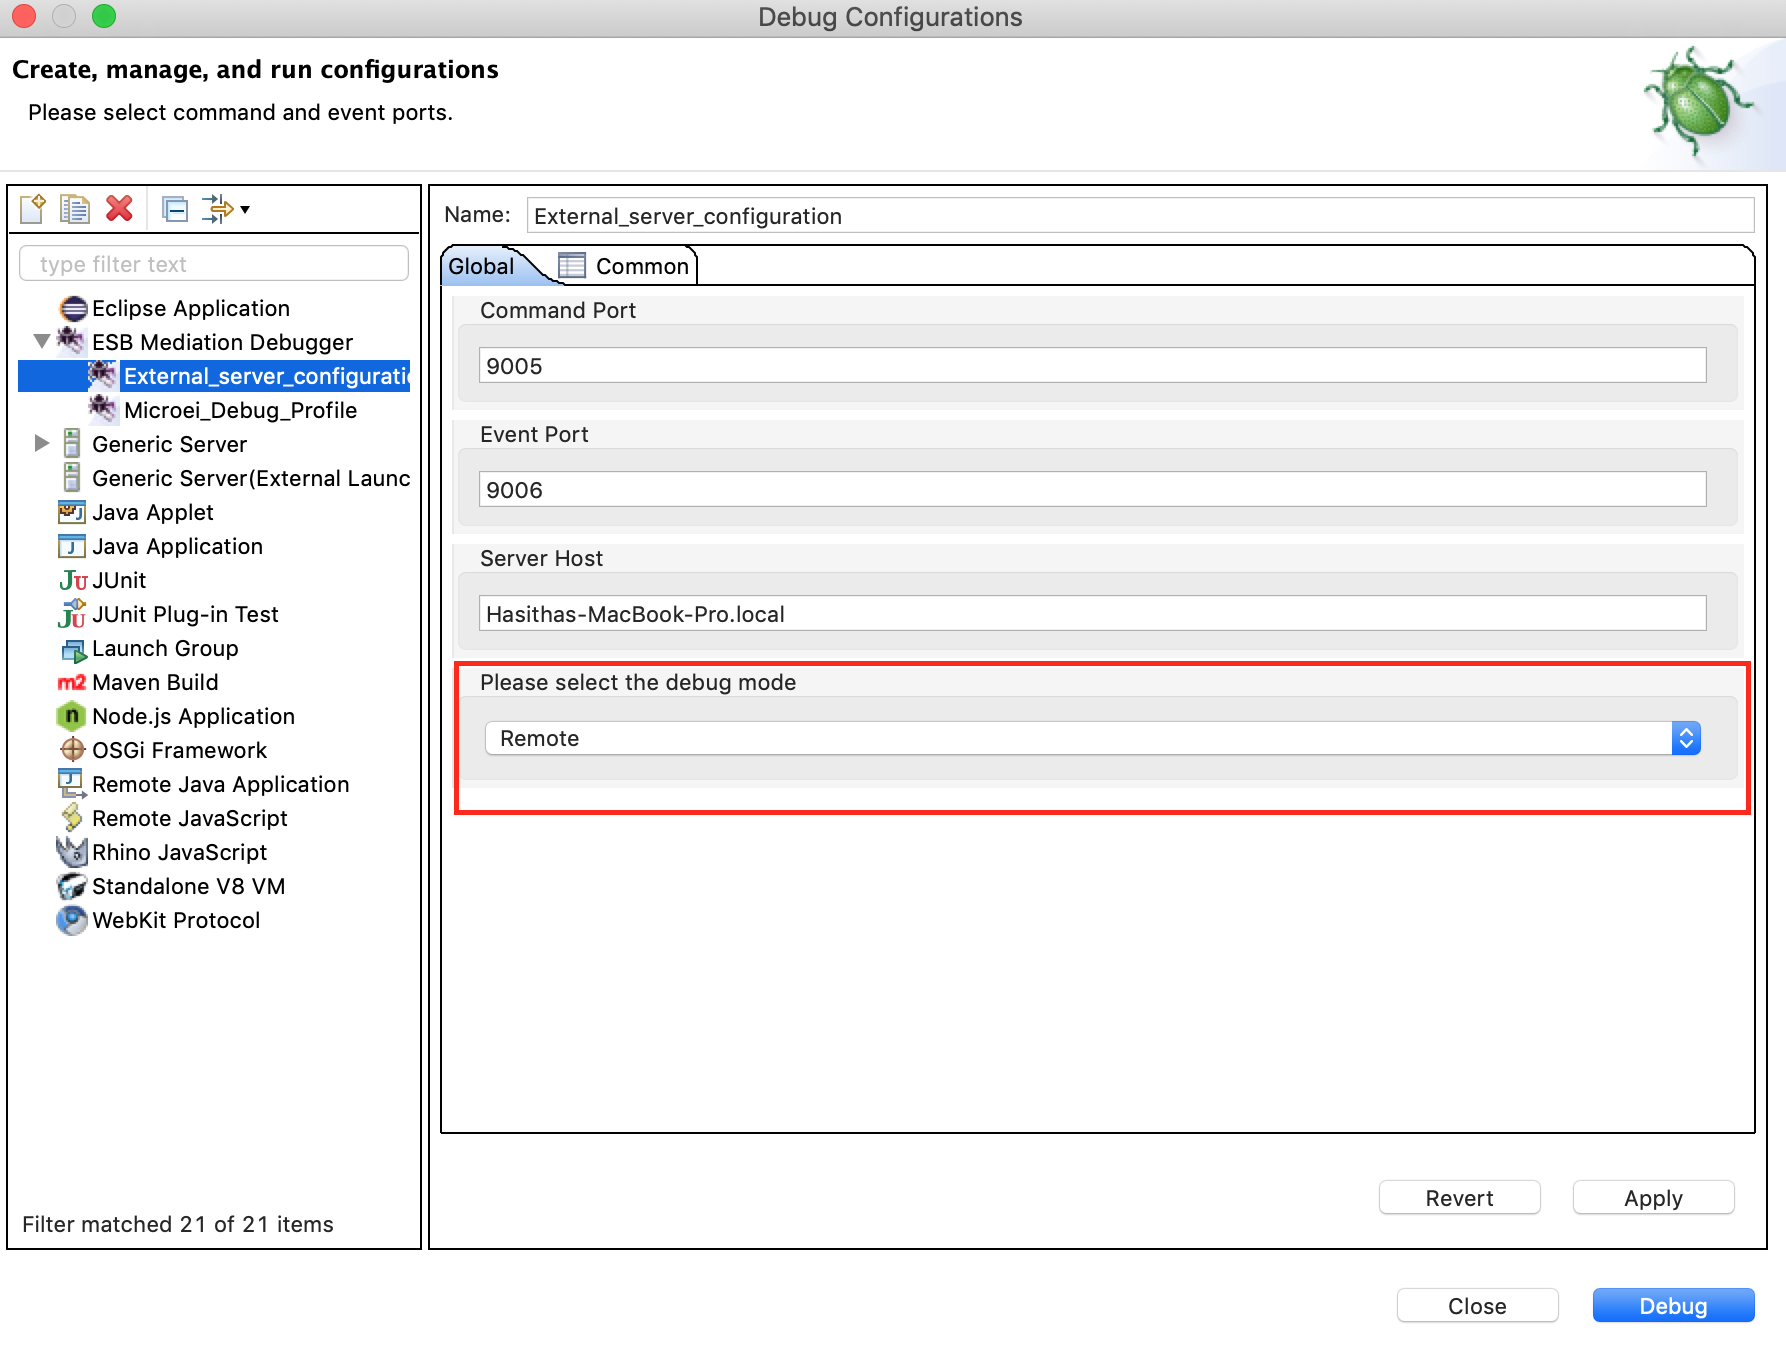
Enter the details to create a new configuration as shown in the example below. You need to define two port numbers and a hostname to connect the external Micro Integrator with WSO2 Integration Studio in the mediation debug mode. Note that you need to specify debug mode as Remote.
-
Add the new configuration to the Debug menu. Then you can access the configuration easily.
-
Execute the following commands (passing a system variable at start up) to start WSO2 Micro Integrator in debug mode:
-
On Windows:
MI_HOME\bin\micro-integrator.bat --run -Desb.debug=true -
On Linux/Solaris:
sh MI_HOME/bin/micro-integrator.sh-Desb.debug=true
-
-
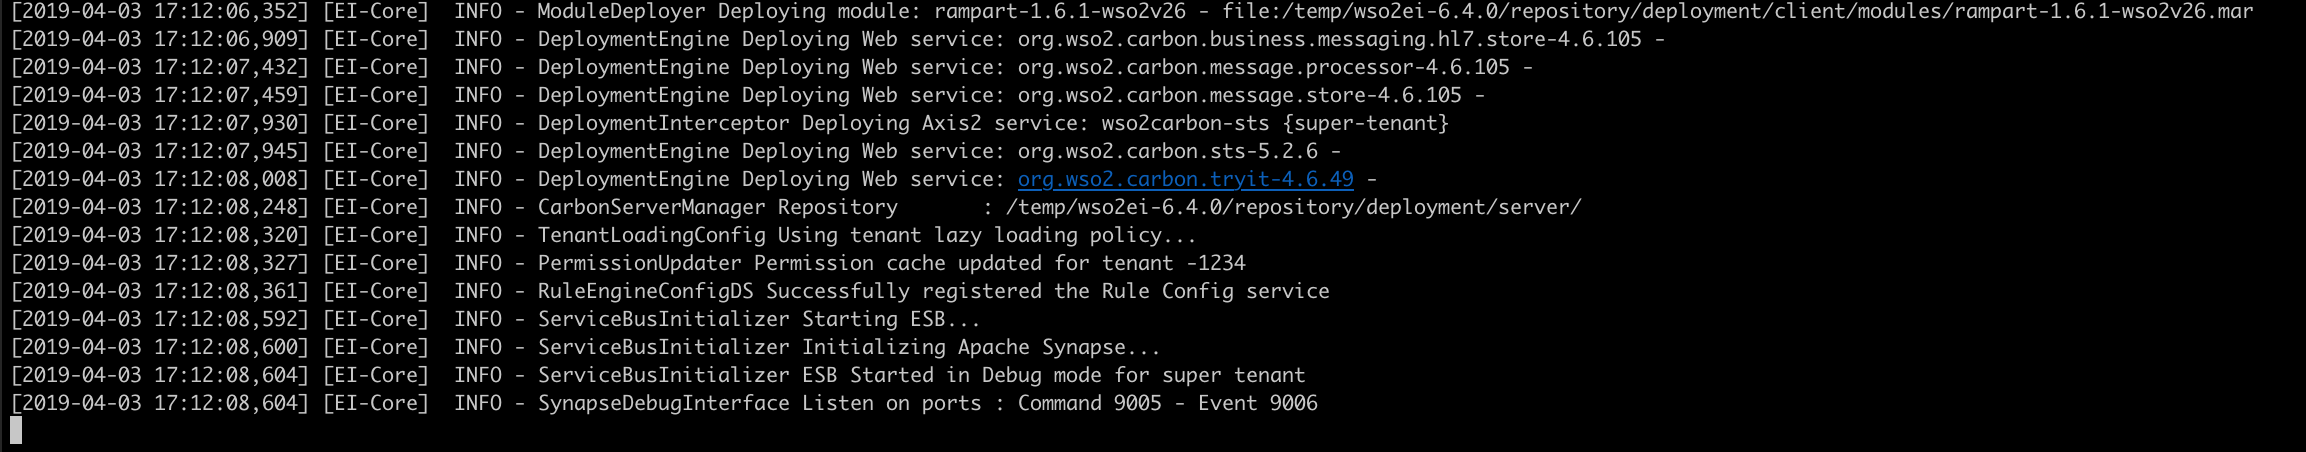
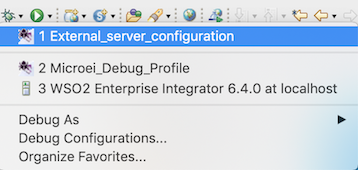
Click the downward arrow beside Debug in WSO2 Integration Studio and select the new profile created above when the Console indicates the following.
Note
You have approximately one minute to connect WSO2 Integration Studio with the Micro Integrator for the execution of the above created debug configuration. Otherwise, the server will stop listening and start without connecting with the debugger tool.
-
In WSO2 Integration Studio, right-click and add breakpoints or skip points on the desired mediators to start debugging as shown in the example below.
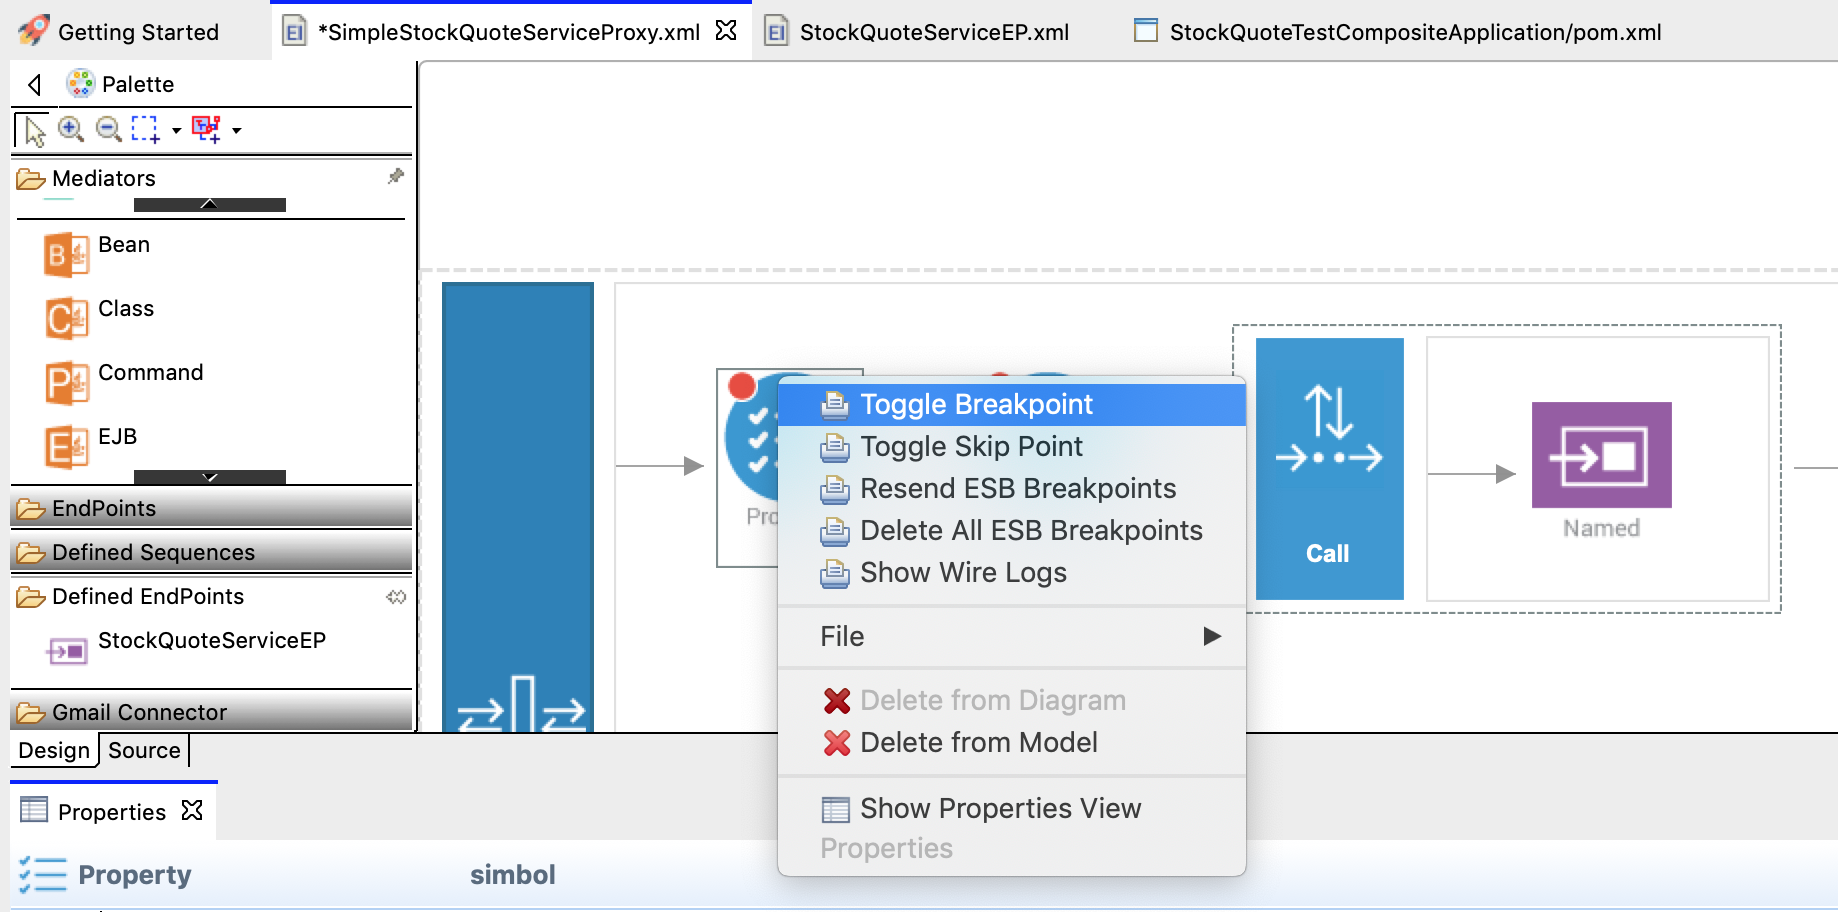
Info
You can add the following debugging options on the mediators using the right click context menu. - Toggle Breakpoint: Adds a breakpoint to the selected mediator - Toggle Skip Point: Adds a skip point to the selected mediator - Resend Debug Points: If you re-start the Micro Integrator, or if you re-deploy the proxy service after changing its Synapse configuration, you need to re-send the information on breakpoints to the Micro Integrator server. This re-sends all registered debugging points to the server. - Delete All Debug Points: Deletes all registered debug points from the server and WSO2 Integration Studio.
Now you can send a request to the external Micro Integrator and debug the flow as discussed under "Instant debugging using Micro Integrator".
Information provided by the Debugger Tool
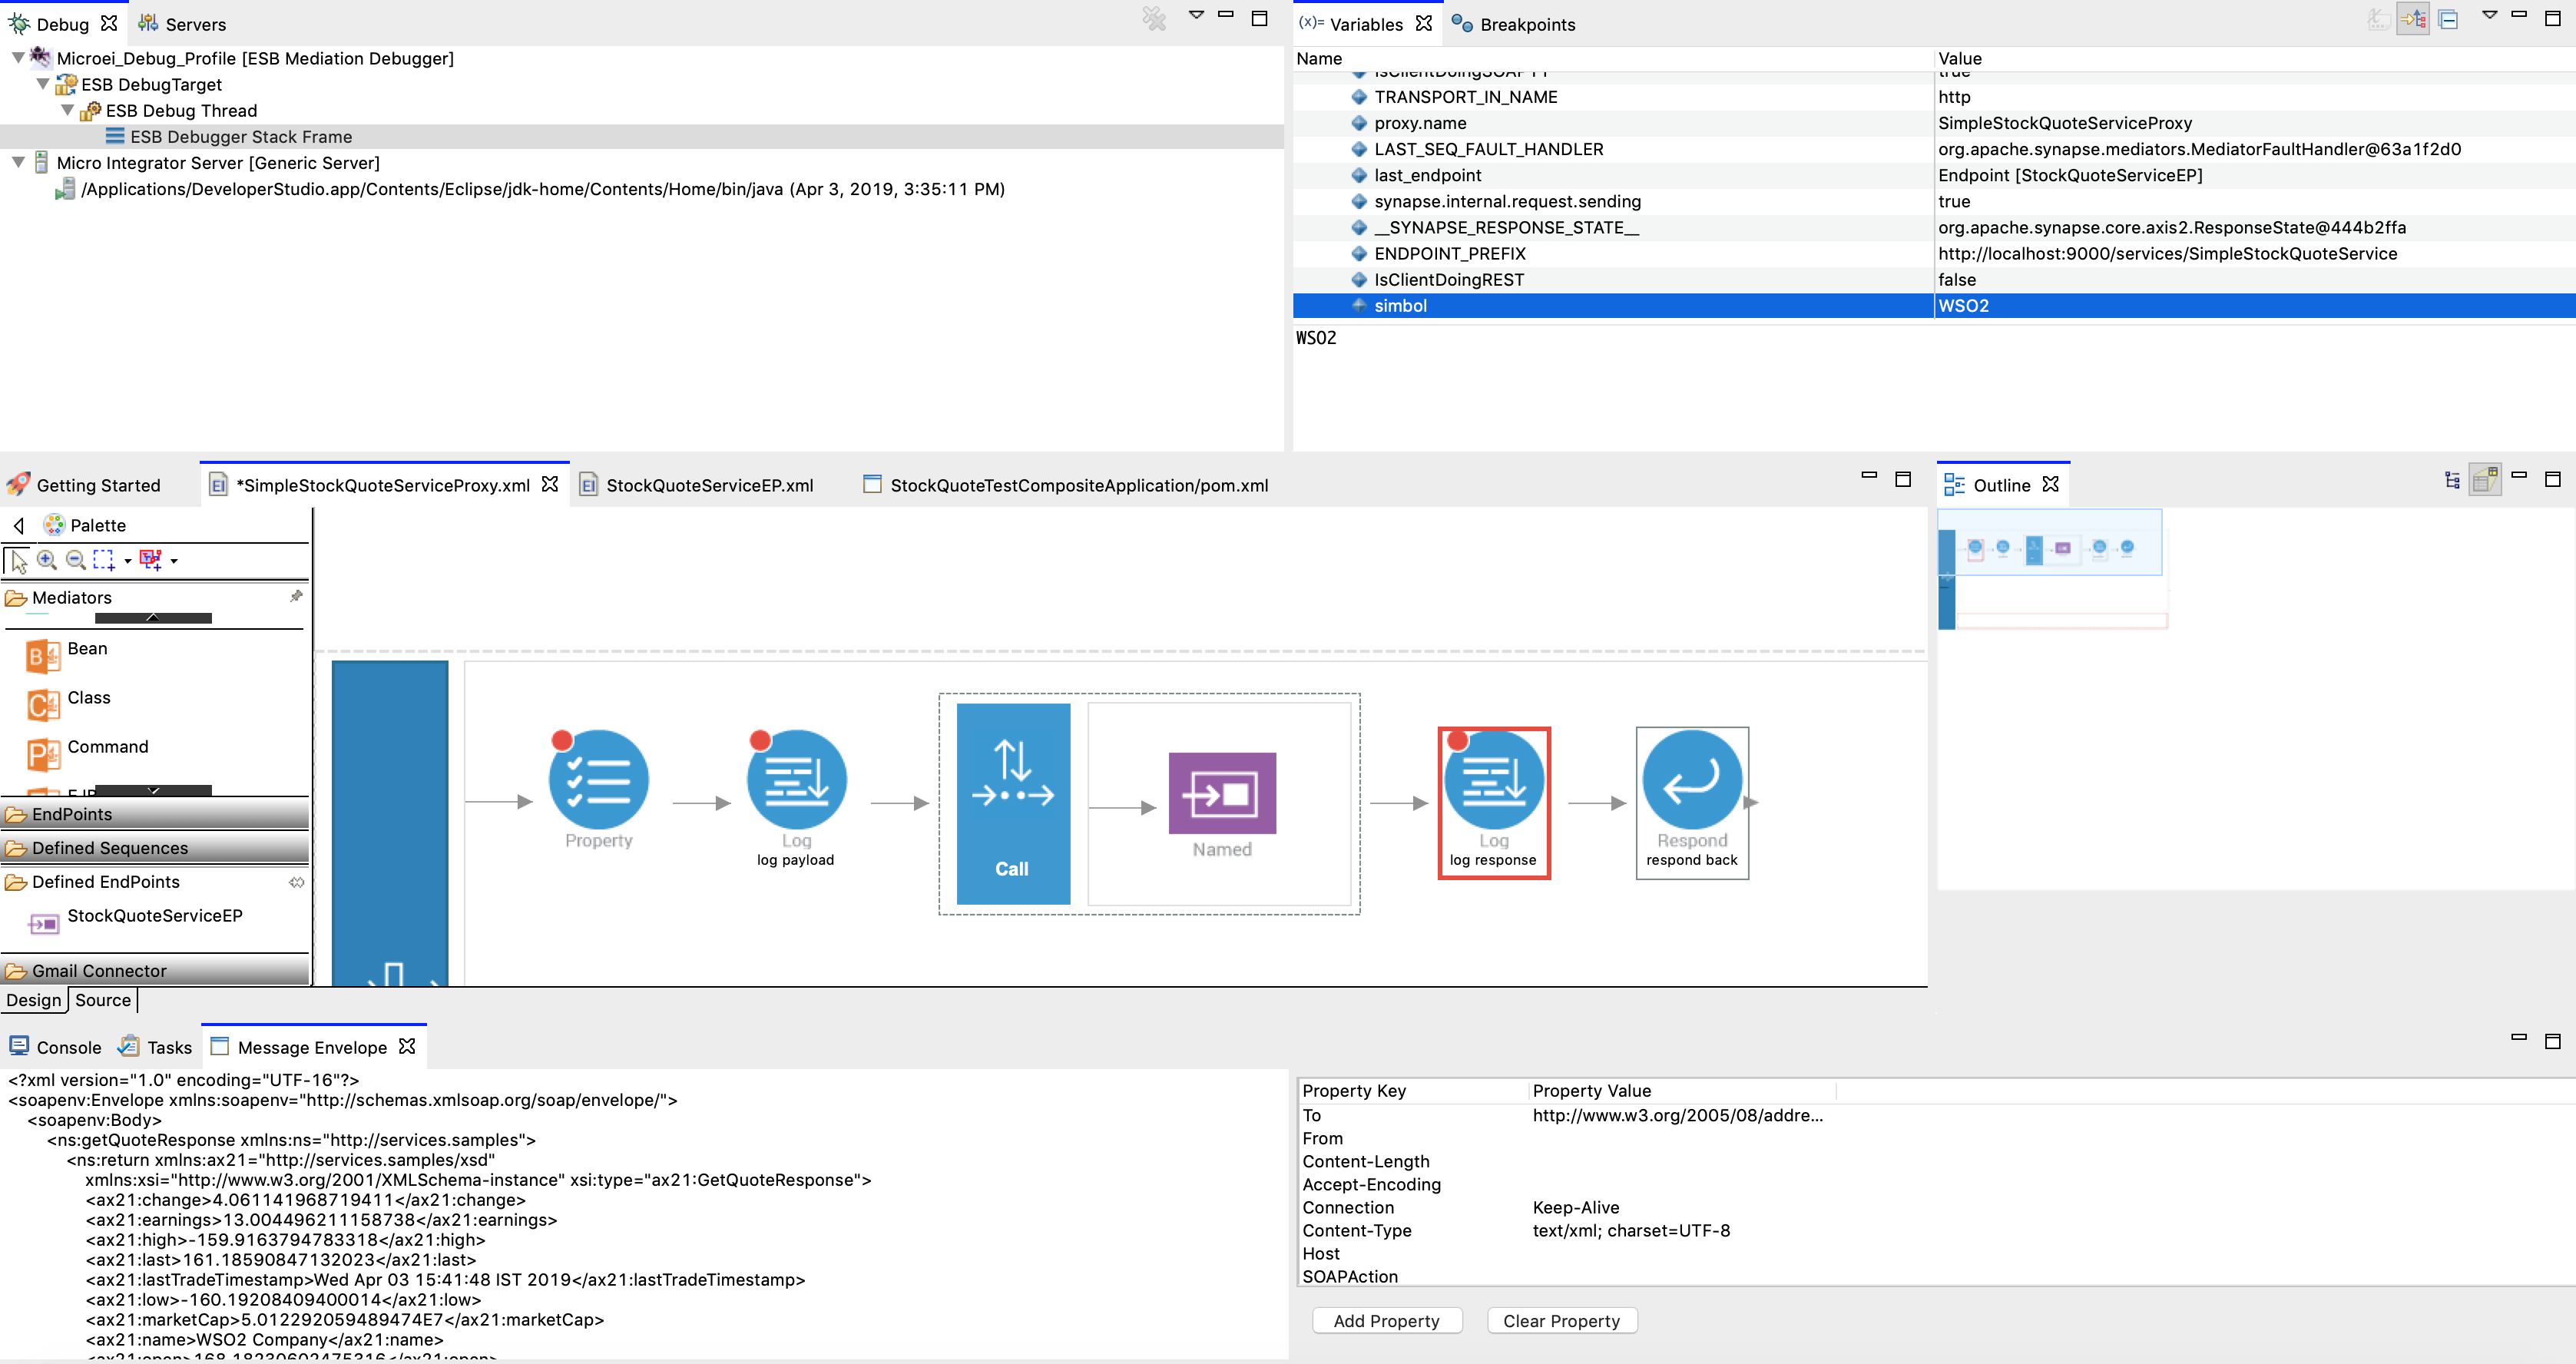
When your target artifact gets a request message and when the mediation flow reaches a mediator marked as a breakpoint, the message mediation process suspends at that point. A tool tip message of the suspended mediator displays the message envelope of the message payload at that point as shown in the example below.
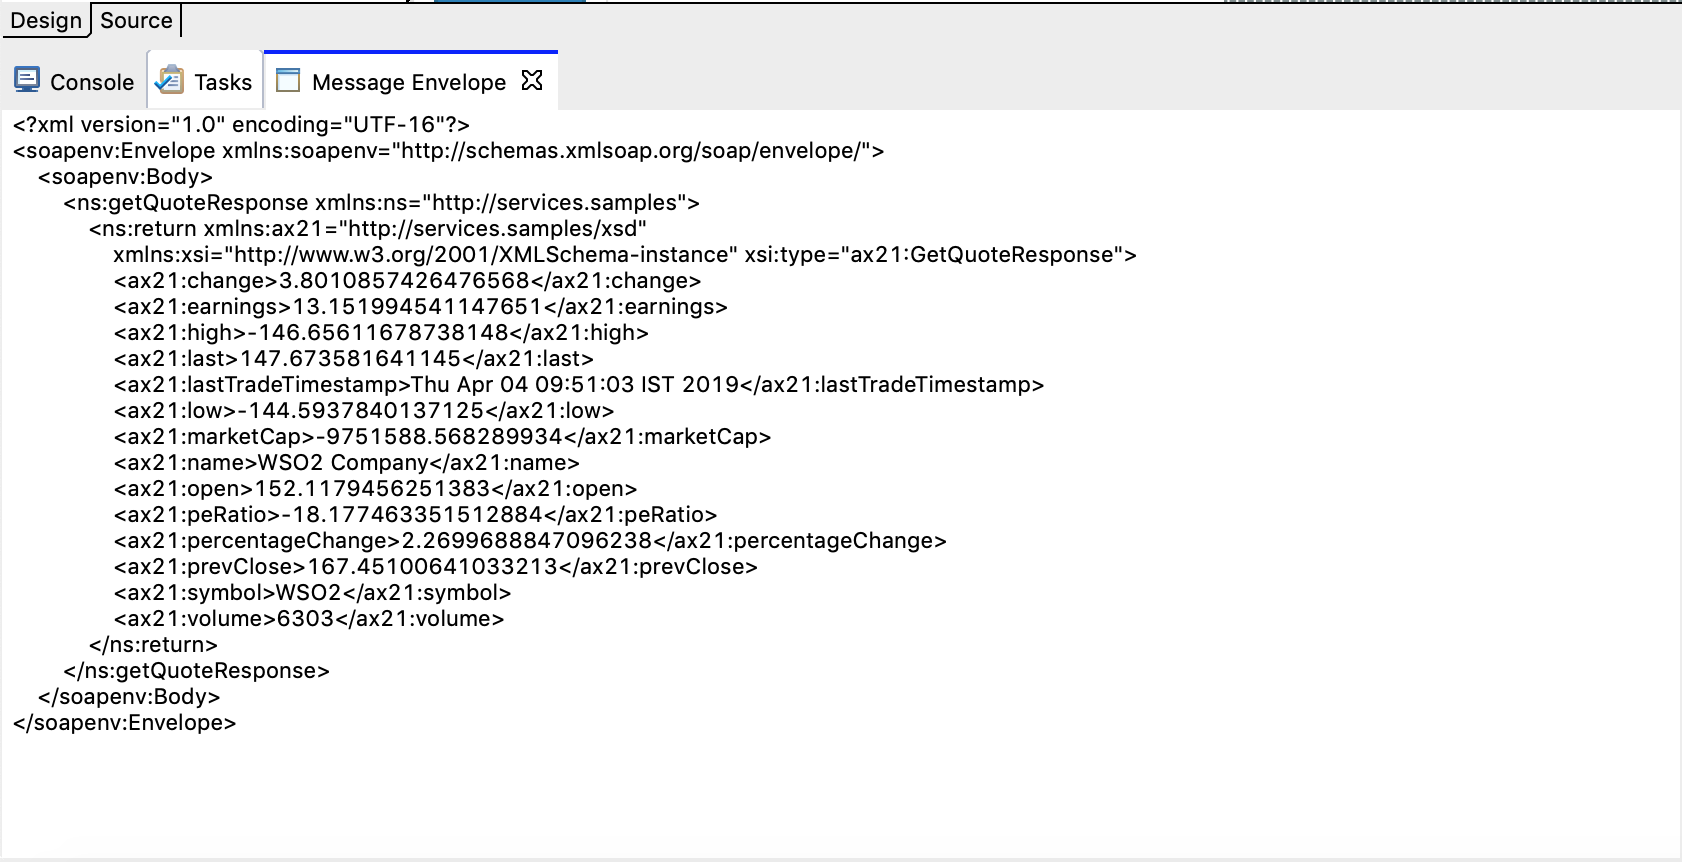
You can view the message payload at that point of the message flow also in the Message Envelope tab as shown below.
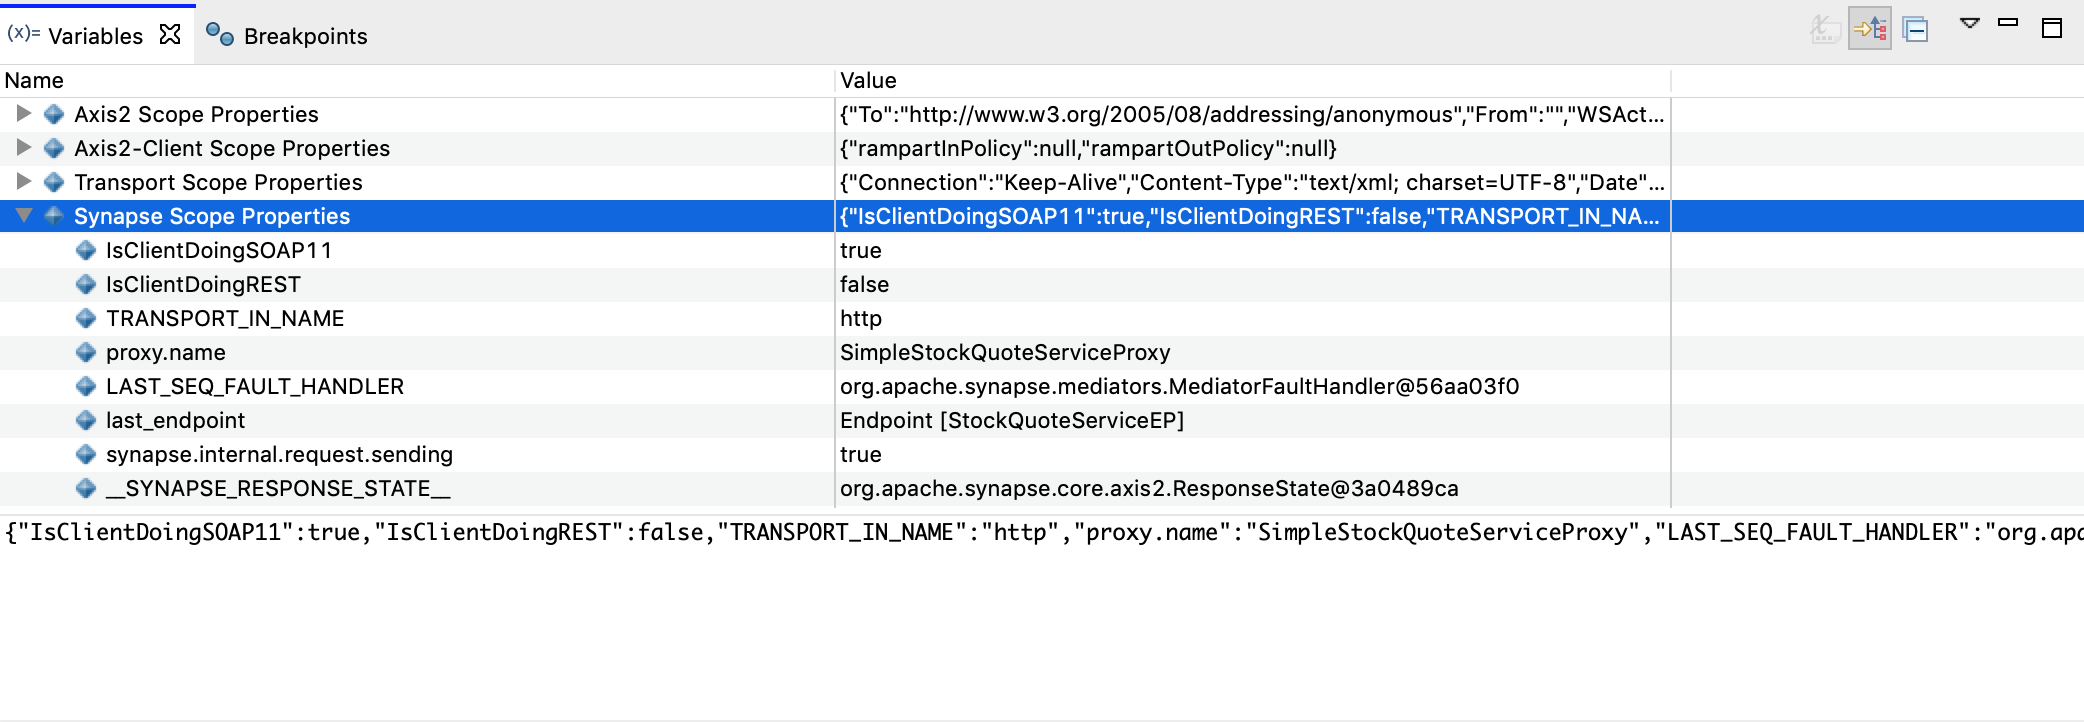
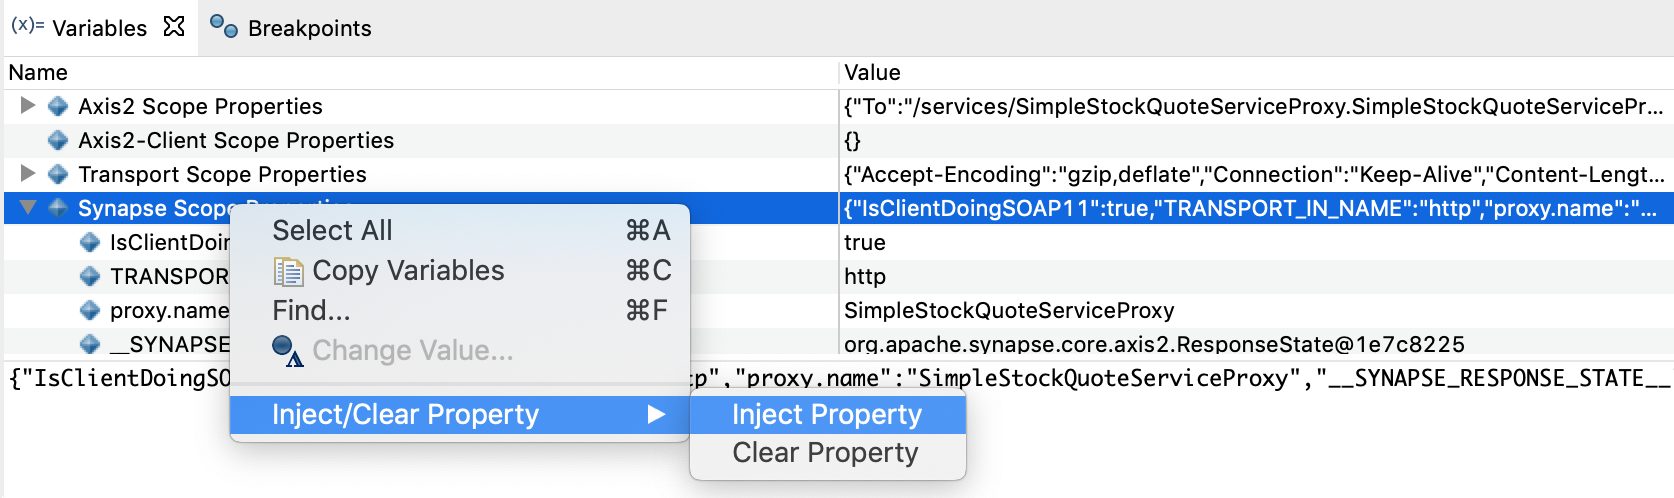
Also, you can view the message mediation properties in the Variables view as shown in the example below.
The Variable view contains properties of the following property scopes.
- Axis2-Client Scope properties
- Axis2 Scope properties
- Operation Scope properties
- Synapse Scope properties
- Transport Scope properties
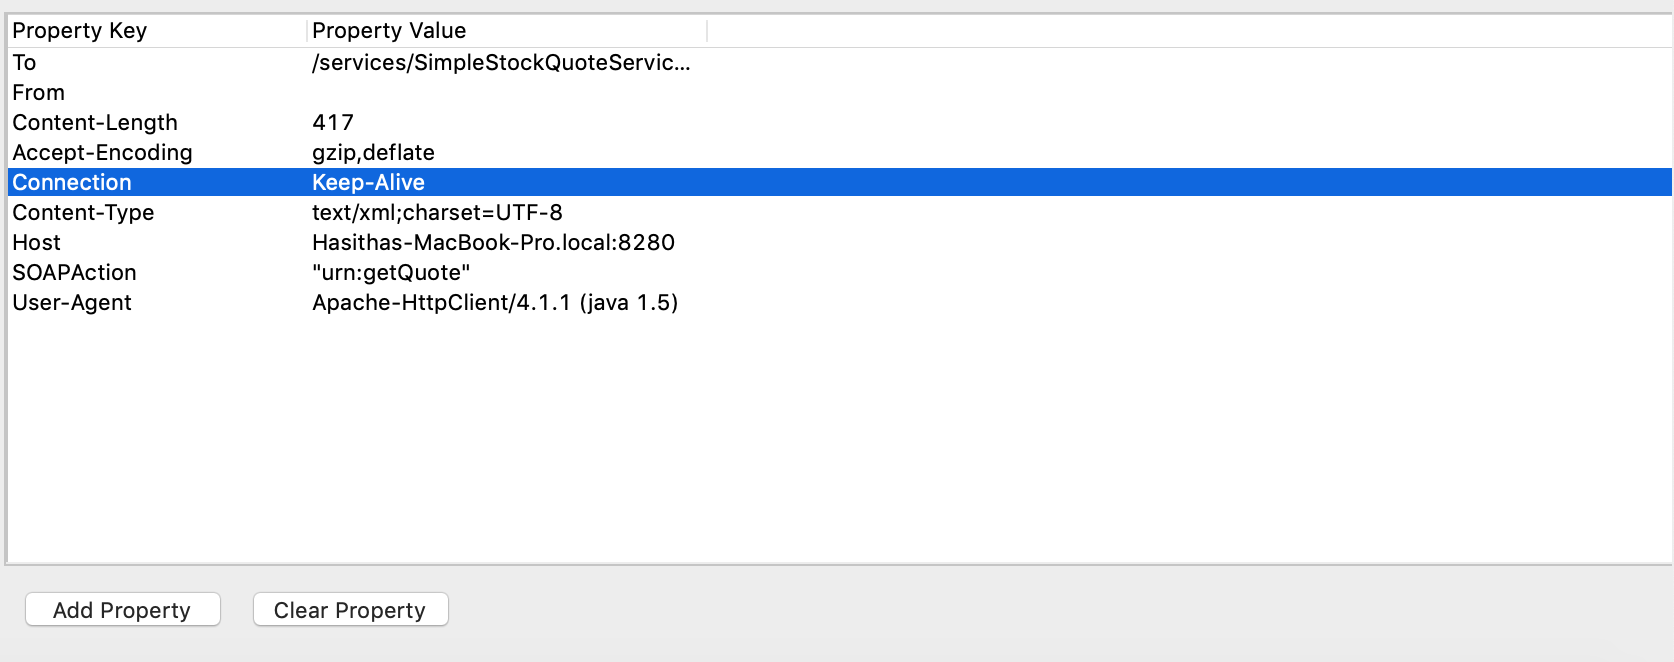
You can have a list of selected properties out of the above, in the properties table of the Message Envelope tab, and view information on the property keys and values of them as shown below.
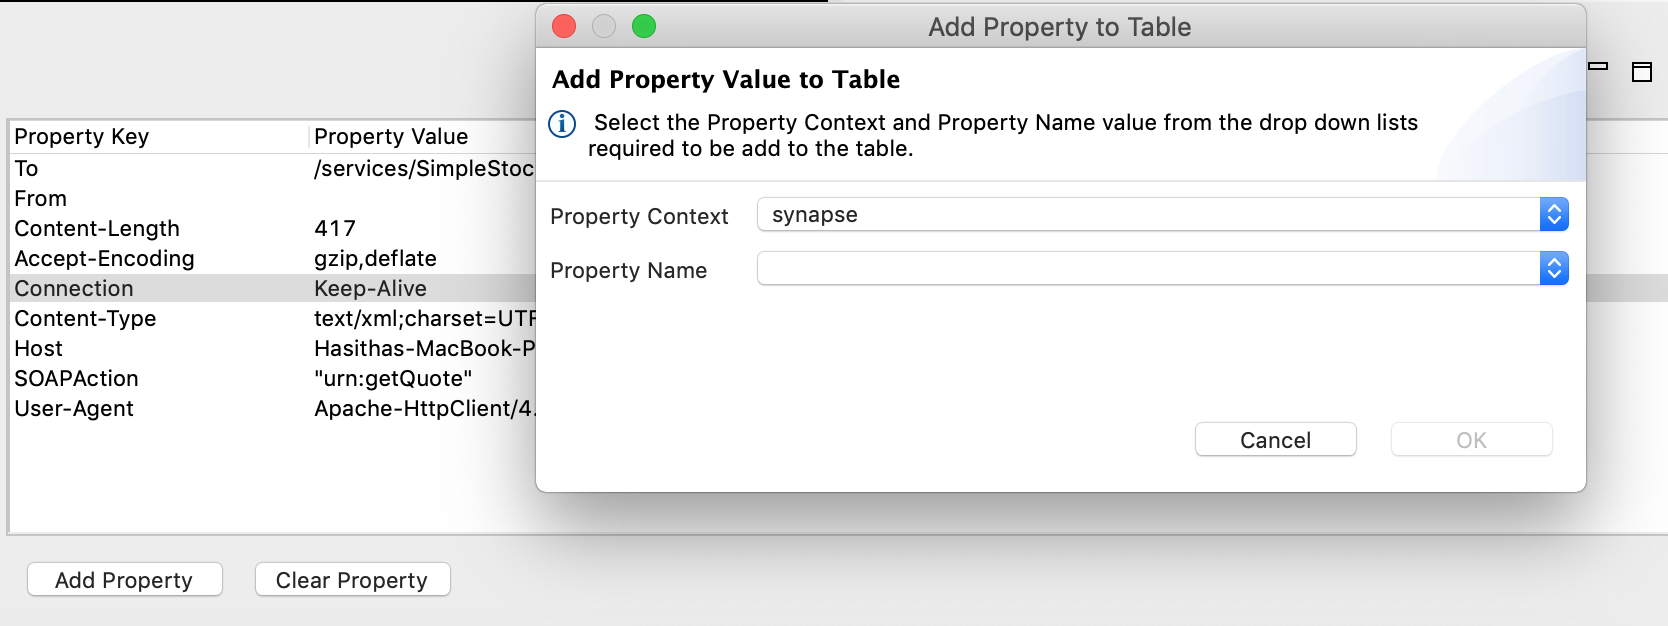
Click Add Property, specify the context and name of the property, and then click OK to add that property to the properties table in the Message Envelope tab as shown below.
Tip
Click Clear Property, to remove a property from the properties table.
Changing the property values
There are three operations that you can perform on message mediation property values as described below.
Injecting new properties
Follow the steps below to inject new properties while debugging.
- Right click on the Variable view, click Inject/Clear Property, and then click Inject Property as shown below.
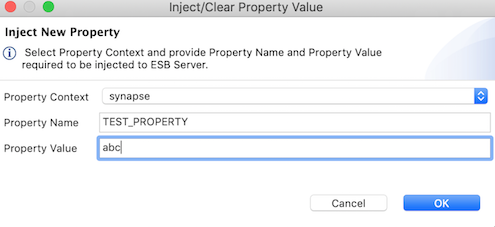
- Enter the details about the property you prefer to add as shown in the example below.
- Click OK.
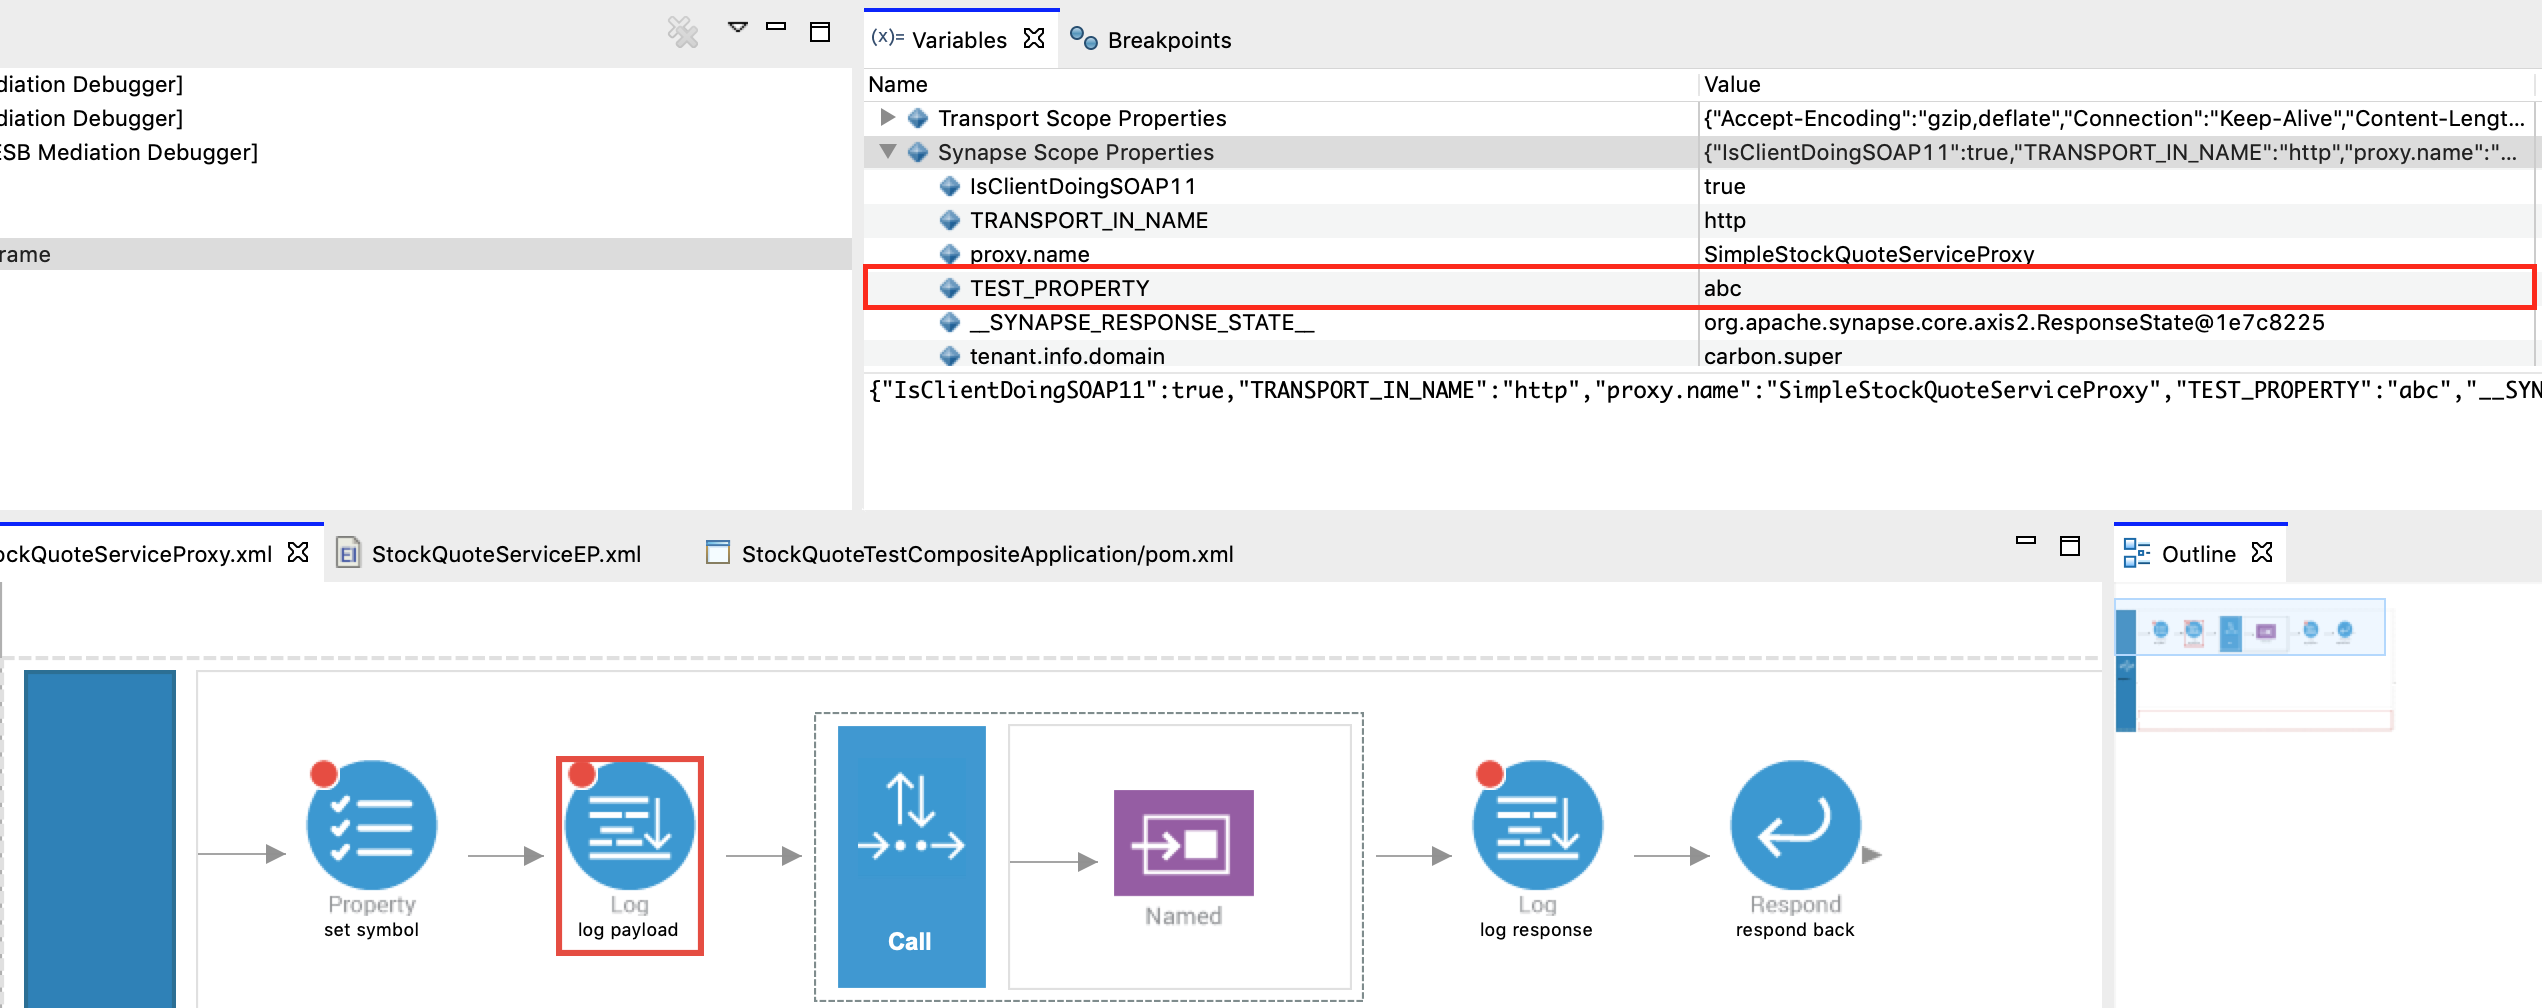
- When the next debug point is hit, you will see the property is set to the specified context.
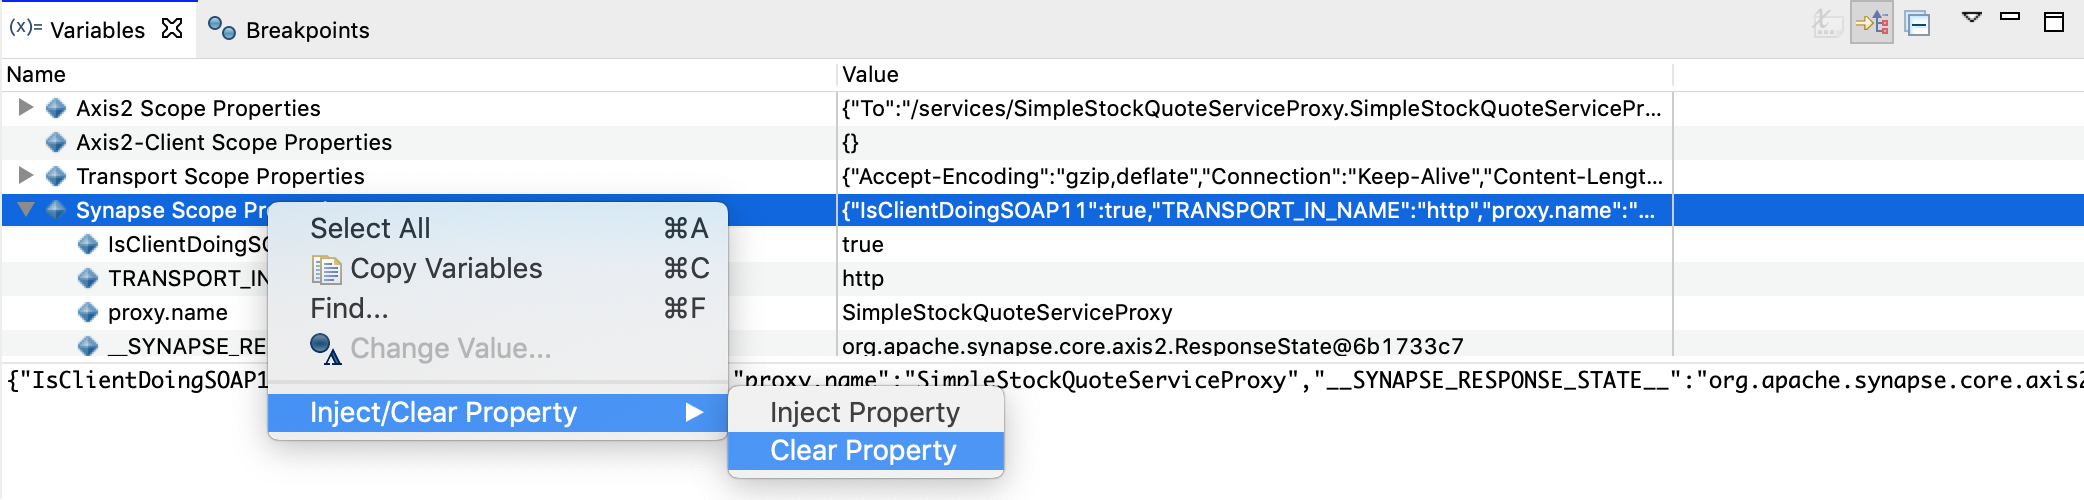
Clearing a property
Follow the steps below to clear an existing property.
- Right click on the Variable view, click Inject/Clear
Property , and then click Clear Property as shown below.
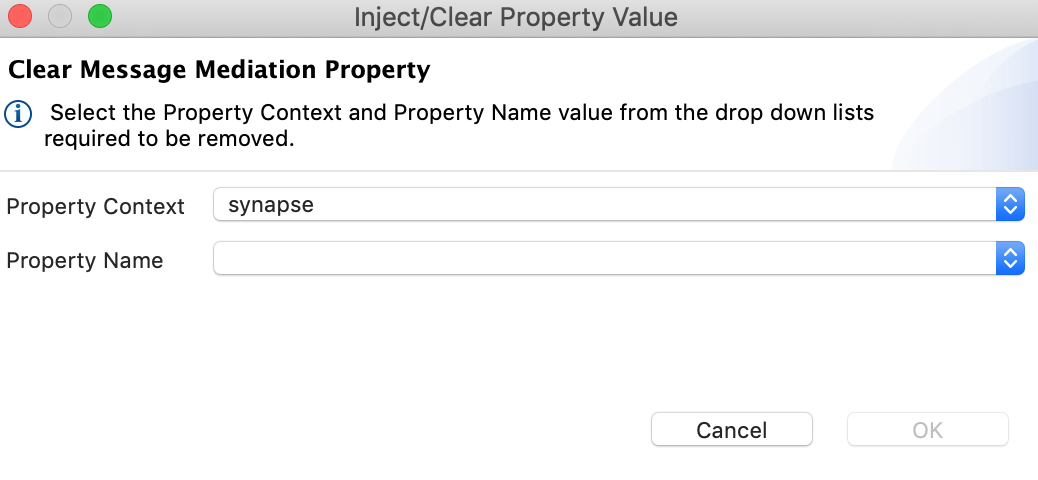
- Enter the details about the property you want to clear as shown in
the example below.
- Click OK .
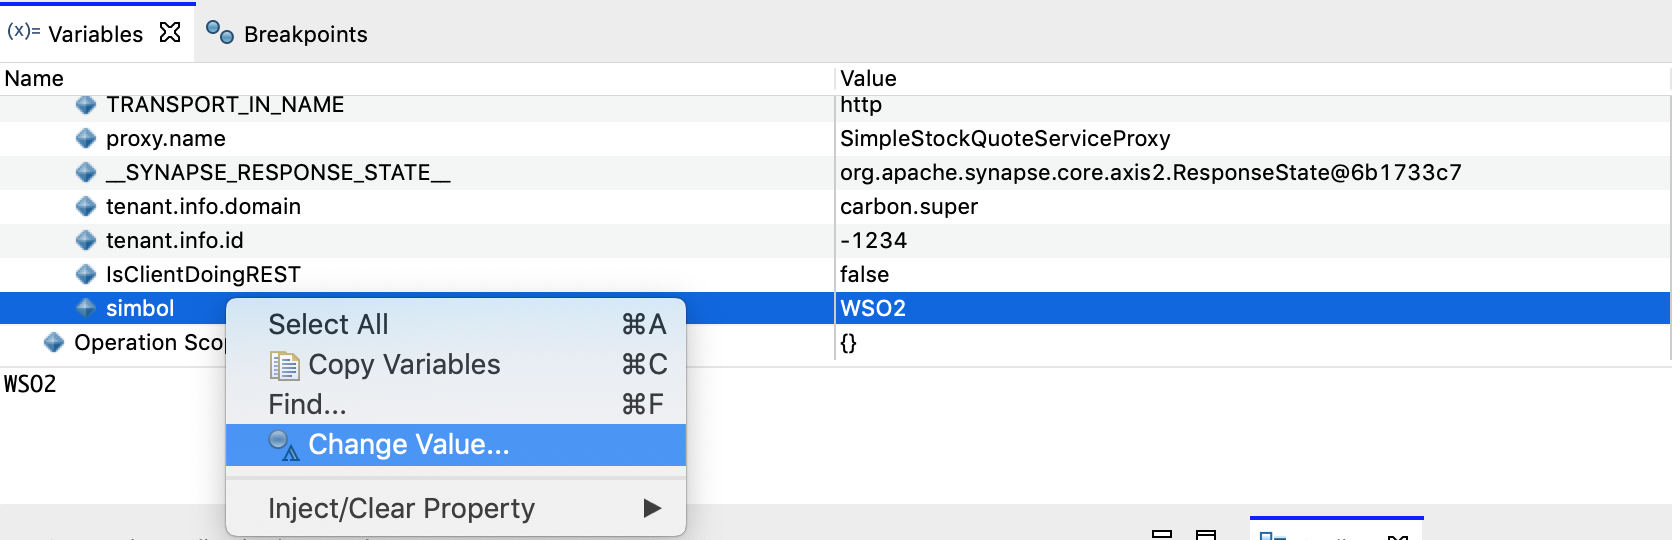
Modifying a property
- Click on the value section of the preferred property and change the value in the Variable view as shown in the example below, to modify it.
- You will see that the property is changed on the property view.