ELK Based Analytics Installation Guide
Analytics Data flow
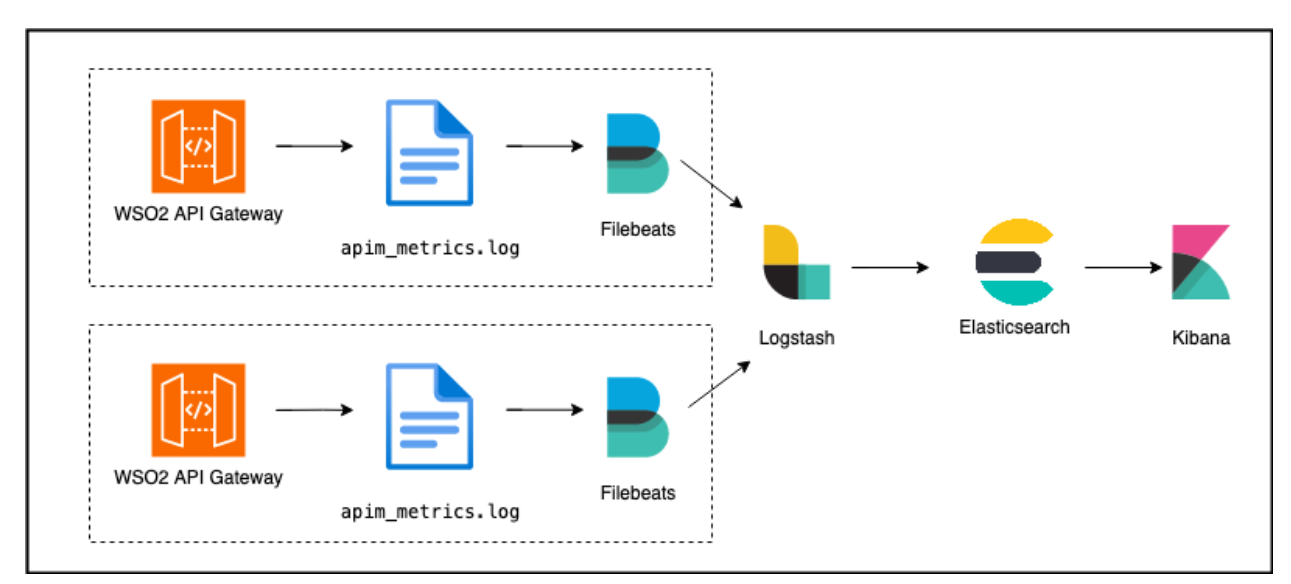
The new On-Premise Analytics solution for WSO2 API Manager will publish analytics data into a log file and that file will be used as the source for the analytics solution.
ELK based WSO2 API Manager On-Premise Analytics deployment architecture has 4 main components.
- Filebeats
- Logstash
- Elasticsearch
- Kibana
This section will cover the steps required to configure the WSO2 API-M and then publish it to an external ELK cluster.
Note
The solution is developed on ELK 8.1.0 and will only be supported in Kibana versions 8.0.0 and higher.
Step 1 - Configuring API Manager
Step 1.1 - Configuring the deployment.toml file.
The Choreo based analytics will be enabled by default. Specify the type as elk to enable ELK analytics as shown below.
Open the wso2am-4.x.x/repository/conf directory. Edit apim.analytics configurations in the deployment.toml file with the following configuration.
[apim.analytics]
enable = true
type = "elk"
Step 1.2 - Enabling Logs
Note
Note that, the following configurations are added by default from the APIM 4.3.0 version onwards.
Open the wso2am-4.x.x/repository/conf directory. To enable logging for a reporter, edit the log4j2.properties file following the instructions given below.
-
Add APIM_METRICS_APPENDER to the appenders list:
appenders = APIM_METRICS_APPENDER, .... (list of other available appenders) -
Add the following configuration after the appenders:
appender.APIM_METRICS_APPENDER.type = RollingFile appender.APIM_METRICS_APPENDER.name = APIM_METRICS_APPENDER appender.APIM_METRICS_APPENDER.fileName = ${sys:carbon.home}/repository/logs/apim_metrics.log appender.APIM_METRICS_APPENDER.filePattern = ${sys:carbon.home}/repository/logs/apim_metrics-%d{MM-dd-yyyy}-%i.log appender.APIM_METRICS_APPENDER.layout.type = PatternLayout appender.APIM_METRICS_APPENDER.layout.pattern = %d{HH:mm:ss,SSS} [%X{ip}-%X{host}] [%t] %5p %c{1} %m%n appender.APIM_METRICS_APPENDER.policies.type = Policies appender.APIM_METRICS_APPENDER.policies.time.type = TimeBasedTriggeringPolicy appender.APIM_METRICS_APPENDER.policies.time.interval = 1 appender.APIM_METRICS_APPENDER.policies.time.modulate = true appender.APIM_METRICS_APPENDER.policies.size.type = SizeBasedTriggeringPolicy appender.APIM_METRICS_APPENDER.policies.size.size=1000MB appender.APIM_METRICS_APPENDER.strategy.type = DefaultRolloverStrategy appender.APIM_METRICS_APPENDER.strategy.max = 10 -
Add a reporter to the loggers list:
loggers = reporter, ...(list of other available loggers) -
Add the following configurations after the loggers:
logger.reporter.name = org.wso2.am.analytics.publisher.reporter.elk
logger.reporter.level = INFO
logger.reporter.additivity = false
logger.reporter.appenderRef.APIM_METRICS_APPENDER.ref = APIM_METRICS_APPENDER
Note
The apim_metrics.log file be rolled each day or when the log size reaches the limit of 1000 MB by default. Furthermore, only 10 revisions will be kept and older revisions will be deleted automatically. You can change these configurations by updating the configurations provided in step 2 given above in this. section.
Note
Following are the details that are available on analytics log events:
apim_event_response - This event will be triggered for each successful API invocation. When a API associated backend returns an error response still it will be logged through this event.
apim_event_response:
{
    "apiCreator": "admin",
    "apiCreatorTenantDomain": "carbon.super",
    "apiId": "43d030dc-427f-4678-98e3-87b7d9882b5f",
    "apiMethod": "GET",
    "apiName": "SampleAPI",
    "apiResourceTemplate": "/*",
    "apiType": "HTTP",
    "apiVersion": "1.0.0",
    "applicationId": "2d6c54b0-7c7d-4b50-83dc-e6ae6f88962e",
    "applicationName": "DefaultApplication",
    "applicationOwner": "admin",
    "backendLatency": 13,
    "correlationId": "79ed20c3-55b1-434a-adf6-eea25e2d09c3",
    "destination": "http://192.168.114.51:8281/services/sampleAPIBackend",
    "eventType": "response",
    "gatewayType": "SYNAPSE",
    "keyType": "SANDBOX",
    "platform": "Mac OS X",
    "properties":{},
    "apiContext":"/api1/2.0.0",
    "userName":"[email protected]"
    "proxyResponseCode": 202,
    "regionId": "default",
    "requestMediationLatency": 54,
    "requestTimestamp": "2022-01-20T03:34:36.451Z",
    "responseCacheHit": false,
    "responseLatency": 73,
    "responseMediationLatency": 6,
    "targetResponseCode": 202,
    "userAgent": "Chrome",
    "userIp": "172.16.2.70"
}
apim_event_faulty - This event will be triggered for each failed and throttled API invocation
apim_event_faulty:
{
    "apiCreator": "admin",
    "apiCreatorTenantDomain": "carbon.super",
    "apiId": "43d030dc-427f-4678-98e3-87b7d9882b5f",
    "apiName": "SampleAPI",
    "apiType": "HTTP",
    "apiVersion": "1.0.0",
    "applicationId": "0b5ccc91-30e2-4ee5-9355-d1698075c028",
    "applicationName": "SampleApp3",
    "applicationOwner": "admin",
    "correlationId": "ccf2196f-9db8-429b-aaae-98f4c6edf6d7",
    "errorCode": 900803,
    "errorMessage": "APPLICATION_LEVEL_LIMIT_EXCEEDED",
    "errorType": "THROTTLED",
    "eventType": "fault",
    "gatewayType": "SYNAPSE",
    "keyType": "PRODUCTION",
    "proxyResponseCode": 429,
    "regionId": "default",
    "requestTimestamp": "2022-02-01T04:18:48.023Z",
    "responseCacheHit": false,
    "targetResponseCode": -1
}
| Parameter | Type | Description |
|---|---|---|
| "apiCreator" | string | The creator of the API. |
| "apiCreatorTenantDomain" | string | The tenant domain of the API creator. |
| "apiId" | string | Unique identifier of the API. |
| "apiMethod" | string | The HTTP method used by the API (e.g., GET, POST). |
| "apiName" | string | The name of the API. |
| "apiResourceTemplate" | string | The template of the API resource accessed. |
| "apiType" | string | The type of the API (e.g., HTTP, REST). |
| "apiVersion" | string | The version of the API. |
| "applicationId" | string | Unique identifier of the application that makes the API call. |
| "applicationName" | string | Name of the application that makes the API call. |
| "applicationOwner" | string | Owner of the application that makes the API call. |
| "backendLatency" | long | The time taken by the backend to process the request. |
| "correlationId" | string | Unique identifier for tracking API calls. |
| "destination" | string | The backend URL to which the API call was redirected. |
| "eventType" | string | The type of event. |
| "gatewayType" | string | The type of the API gateway. |
| "keyType" | string | Indicates whether the API key used was for SANDBOX or PRODUCTION. |
| "platform" | string | Operating system was used to access the API. |
| "properties" | object | Properties of the event. |
| "apiContext" | string | The context of the API call. |
| "userName" | string | The username of the individual who made the API call. |
| "proxyResponseCode" | int | The HTTP response code returned by the API gateway. |
| "regionId" | string | The region identifier for the API call. |
| "requestMediationLatency" | int | Time taken for request mediation. |
| "requestTimestamp" | long | Timestamp when the request was made. |
| "responseCacheHit" | bool | Indicates if the response was served from cache. |
| "responseLatency" | long | Total time taken to respond to the request. |
| "responseMediationLatency" | long | Time taken for response mediation. |
| "targetResponseCode" | int | The HTTP response code received from the backend target. |
| "userAgent" | string | The user agent of the client making the API call. |
| "userIp" | string | The IP address of the user making the API call. |
| "errorCode" | int | The error code generated in a fault. |
| "errorMessage" | string | The error message associated with the fault. |
| "errorType" | string | The type of error (e.g., THROTTLED). |
Step 2 - Configuring ELK
Installing Elasticsearch
-
Install Elasticsearch according to your operating system.
-
Make sure Elasticsearch is up and running.
Info
As recommended by ELK, a minimum 3 node cluster is required for a production environment.
Installing Filebeat
-
Install Filebeat according to your operating system.
-
Configure Filebeats to read the log file in the
repository/logsfolder.filebeat.inputs: - type: log enabled: true paths: - {apim_home}/repository/logs/apim_metrics.log include_lines: ['(apimMetrics):'] output.logstash: # The Logstash hosts hosts: ["{LOGSTASH_URL}:5044"]
Installing Logstash
- Install Logstash according to your operating system.
-
Add the following content to a file (eg: logstash-sample.conf)
3. Start the server ./logstash -f {FilePathToConfig}/logstash-sample.confinput { beats { port => 5044 } } filter { grok { match => ["message", "%{GREEDYDATA:UNWANTED}\ apimMetrics:%{GREEDYDATA:apimMetrics}\, %{GREEDYDATA:UNWANTED} \:%{GREEDYDATA:properties}"] } json { source => "properties" } } output { if [apimMetrics] == " apim:response" { elasticsearch { hosts => ["http://{ELK_URL}:9200"] index => "apim_event_response" user => "elastic" password => "Admin1234" } } else if [apimMetrics] == " apim:faulty" { elasticsearch { hosts => ["http://{ELK_URL}:9200"] index => "apim_event_faulty" user => "elastic" password => "Admin1234" } } }
Installing Kibana
-
Install Kibana according to your operating system.
-
Launch the Kibana web interface.
-
Log in to the Kibana dashboards.
-
Navigate to Stack Management > index pattern. If you already have any index patterns created under the following names, delete them before importing the saved artifacts.
apim_event* apim_event_faulty apim_event_response -
Download the artifact file from below.
Artifacts v1 - here
Artifacts v2 - here - Navigate to Stack Management > Saved Object and click on Import. Add the downloaded artifact file as an import object, and import
Info
Follow the recommendations of Elastic in order to optimize the performance of the system.
Step 3 - Configure Security in ELK
Elastic search supports several authentication modes ranging from basic authentication to Single sign-on with several identity providers.
In this section, we mainly focus on configuring single-sign-on with WSO2 API Manager via OpenID Connect. If you are looking for other supported authentication providers, refer the ElasticSearch documentation.
Info
Note that you can either configure Basic Authentication or SSO with OpenID Connect.
Configure Basic Authentication
ElasticSearch supports basic authentication via an internal user store. If you need to set up basic authentication in ElasticSearch and Kibana, refer the ElasticSearch documentation.
Configure Single-Sign-On with WSO2 API Manager via OpenID Connect
ElasticSearch/Kibana deployment can be configured to enable Single-sign-on with WSO2 API Manager via OpenID Connect. To set up SSO with WSO2 API Manager, follow the steps given below.
Prerequisite
To enable Single-sign-on security features in ELK, an ElasticSearch Platinum subscription is required.
Configure a service provider at WSO2 API Manager
To enable SSO with WSO2 API Manager, a service provider needs to be created. Follow the steps given below to create a service provider.
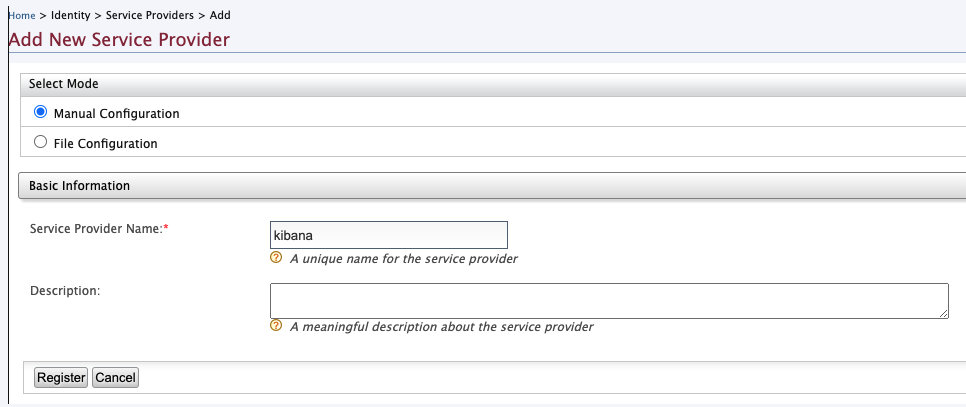
- Login to the WSO2 API Manager management console via
https://<API-M_HOST>:9443/carbon. -
From the Main, click Add under the Service Providers section.
-
In the Add New Service Provider page, create a new service provider by providing the service provider name (e.g.,kibana).
-
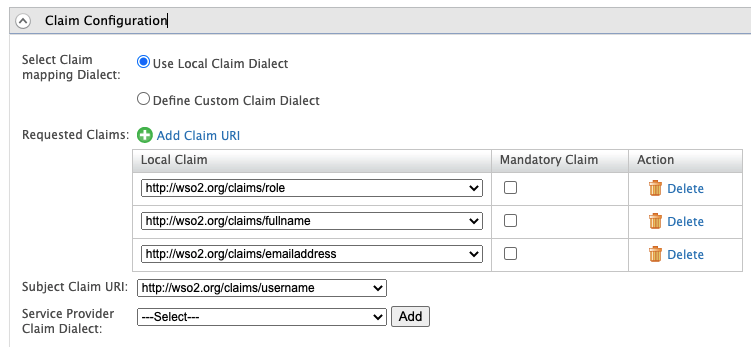
Once the service provider is created, go to the service provider, expand the Claim Configuration section. Configure the claims as shown in the image below and click Update.
-
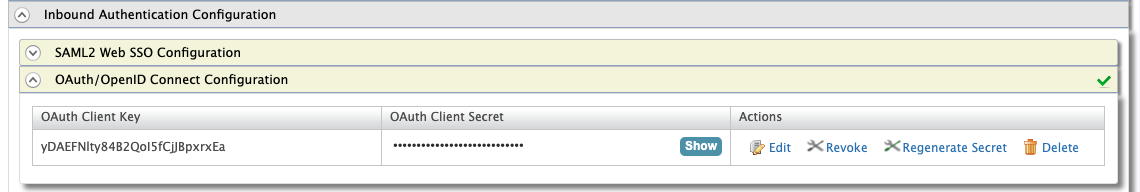
Expand the Inbound Authentication Configuration section, then OAuth/OpenID Connect Configuration and click Edit.
-
In the View/Update Application Settings page, set the
callback URLas follows.regexp=(https://kibana.example.com:5601/api/security/oidc/callback|https://kibana.example.com:5601/security/logged_out)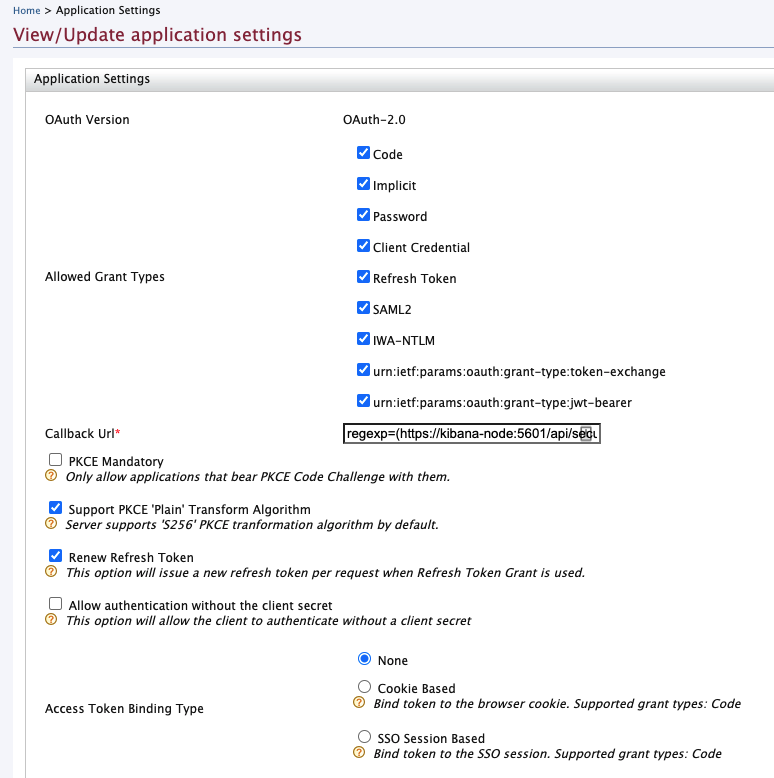
-
Click Update to save your changes.
Configure OIDC realm in Elastic Search
To configure single sign-on to the Elastic Stack using OpenID connect, follow the steps given here.
A sample OpenID connect realm is as follows.
OpenID Connect realm configurations
xpack.security.authc.realms.oidc.oidc1:
 order: 2
 rp.client_id: "<CLIENT_ID>"
 rp.response_type: code
 rp.redirect_uri: "https://kibana.example.com:5601/api/security/oidc/callback"
 op.issuer: "https://apim.example.com:9443/oauth2/token"
 op.authorization_endpoint: "https://apim.example.com:9443/oauth2/authorize"
 op.token_endpoint: "https://apim.example.com:9443/oauth2/token"
 op.jwkset_path: "https://apim.example.com:9443/oauth2/jwks"
 op.endsession_endpoint: "https://apim.example.com:9443/oidc/logout"
 rp.post_logout_redirect_uri: "https://kibana.example.com:5601/security/logged_out"
 claims.principal: sub
 claims.groups: groups
 ssl.verification_mode: none
 claims.name: name
 claims.mail: email
Configure Role Mapping for Kibana dashboard
Once the above steps are completed, role mapping needs to be configured in Kibana to allow WSO2 API Manager users to access the dashboards in Kibana. For that follow the steps mentioned below.
Create Users and Roles in WSO2 API Manager
-
Login to WSO2 API Manager management console via
https://<API-M_HOST>:9443/carbon. -
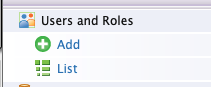
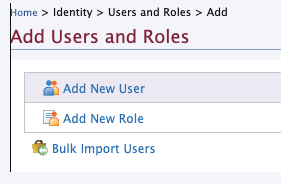
From the Main menu in the left panel, click Add under the Users and Roles section.
-
In Add Users and Roles, click Add new role.
-
Create a new role (e.g.,
AnalyticsViewer) and click Finish. -
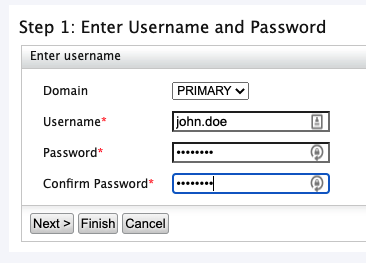
In Add Users and Roles, click Add new user.
-
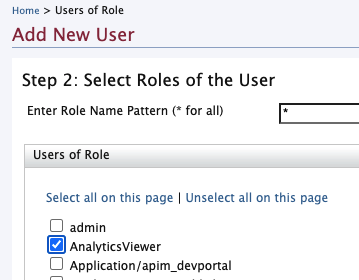
Create a new user and click the Next.
-
In the “Step 2: Select Roles of the User” page select the previously created role and click “Finish”.
Create role mapping
- Login to Kibana using basic authentication and go to Stack Management under the Management section in the left menu. Click Role Mappings under the Security section.
- In the Create Role Mapping section, add a new role mapping by providing a Mapping name.
-
Select a role that has access to the particular dashboard from the Roles.
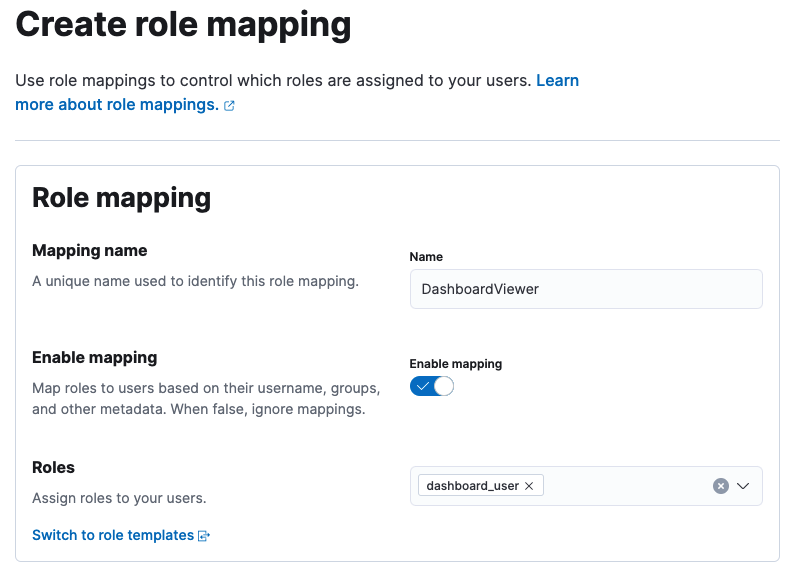
-
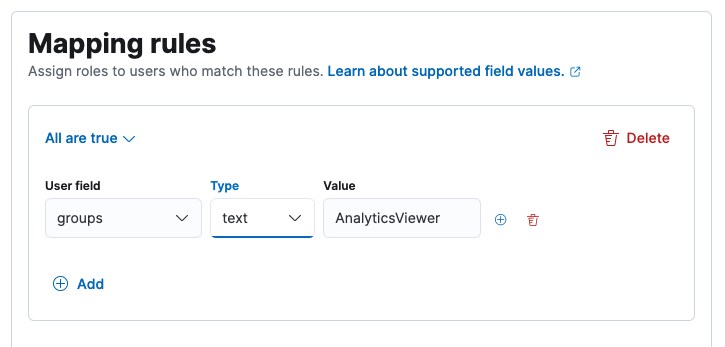
Under Mapping Rules select groups as the user field and name of the previously-created role as the value and click Add.
-
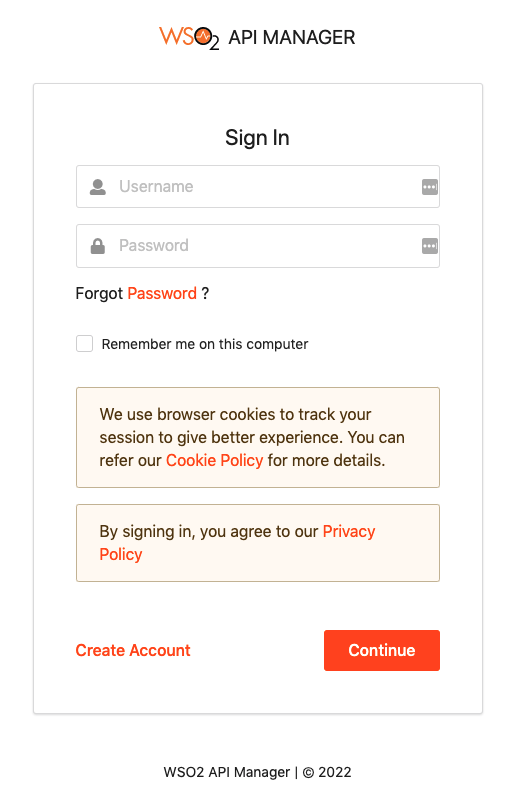
Logout from the Kibana and re-login by selecting the Log in with WSO2 option.
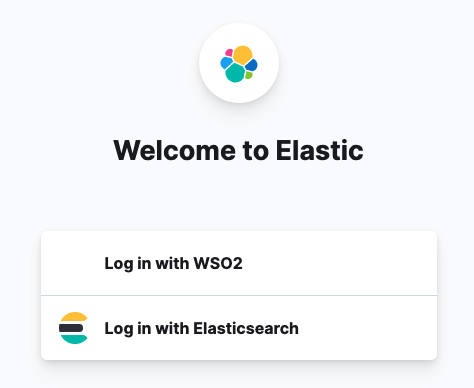
-
This will navigate to the WSO2 API Manager login page. Try login with the previously created user credentials.
Configure SSL/TLS to secure ElasticSearch, Kibana, Beats, and Logstash
For more information regarding configuring SSL/TLS to secure ElasticSearch, Kibana, Beats, and Logstash follow the steps mentioned in this article.
Dashboards
Analyzing statistics
Once you have set up the Kibana dashboards, you can access the following dashboards.
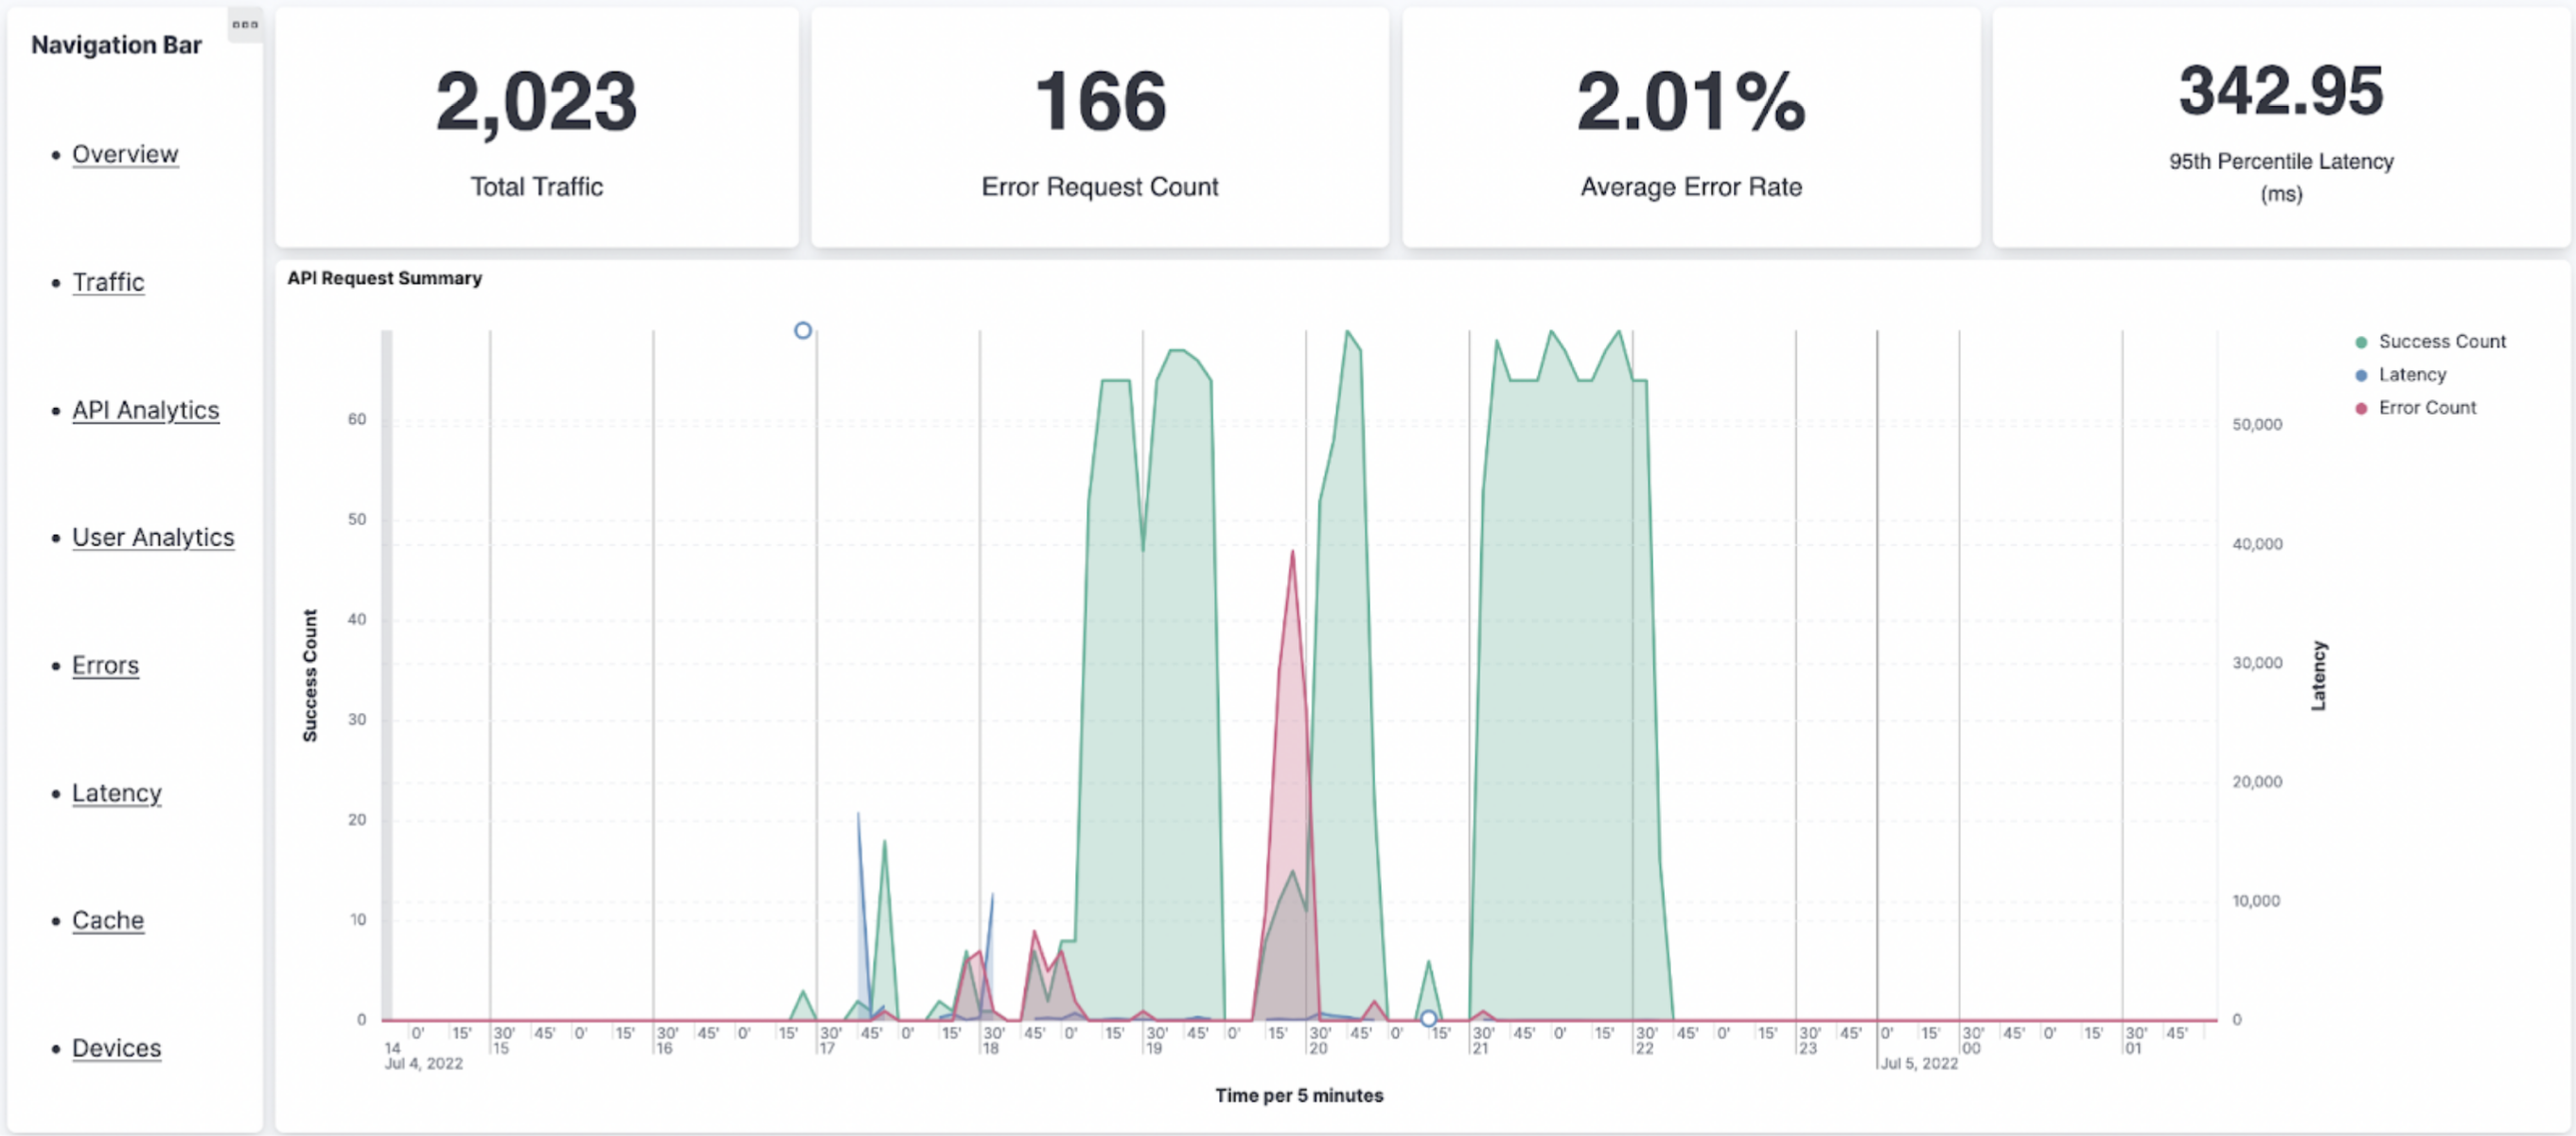
Overview
The Overview page gives you a quick overview of the performance of the system. It can be used as a dashboard to view the current system status.
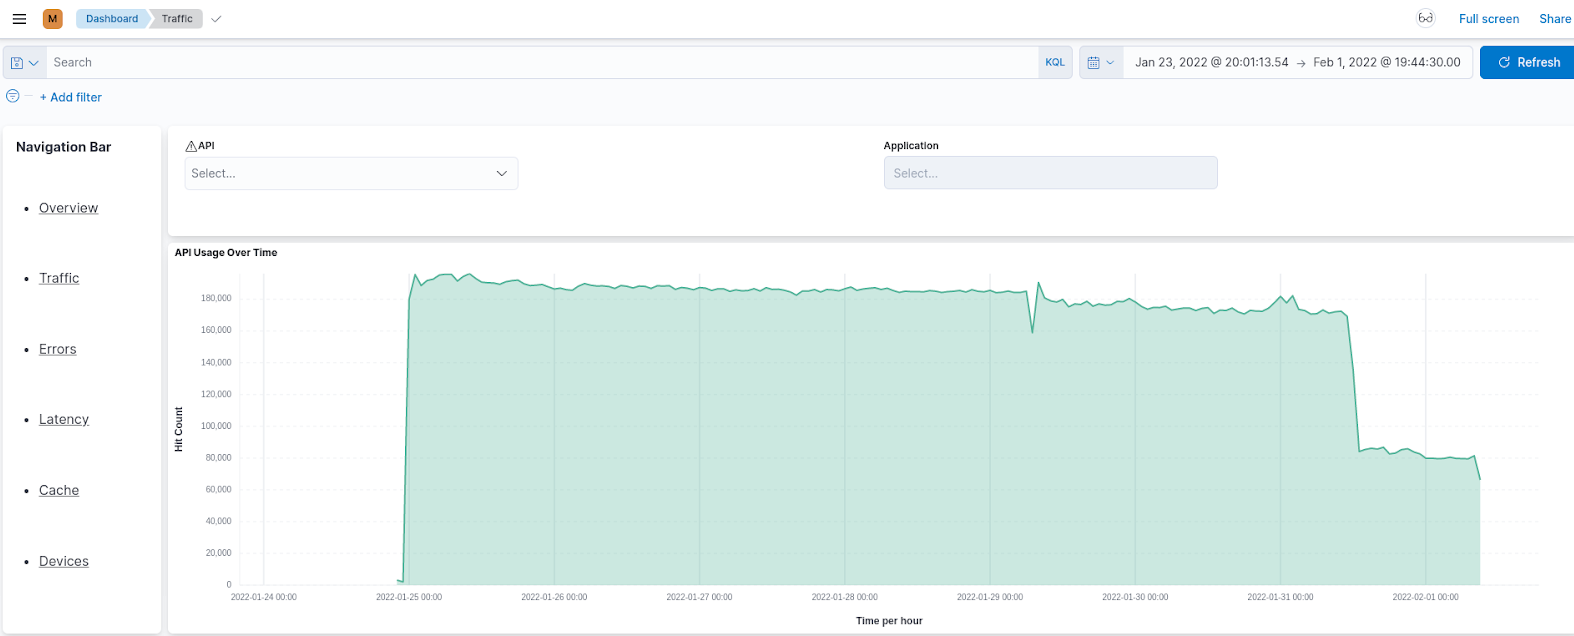
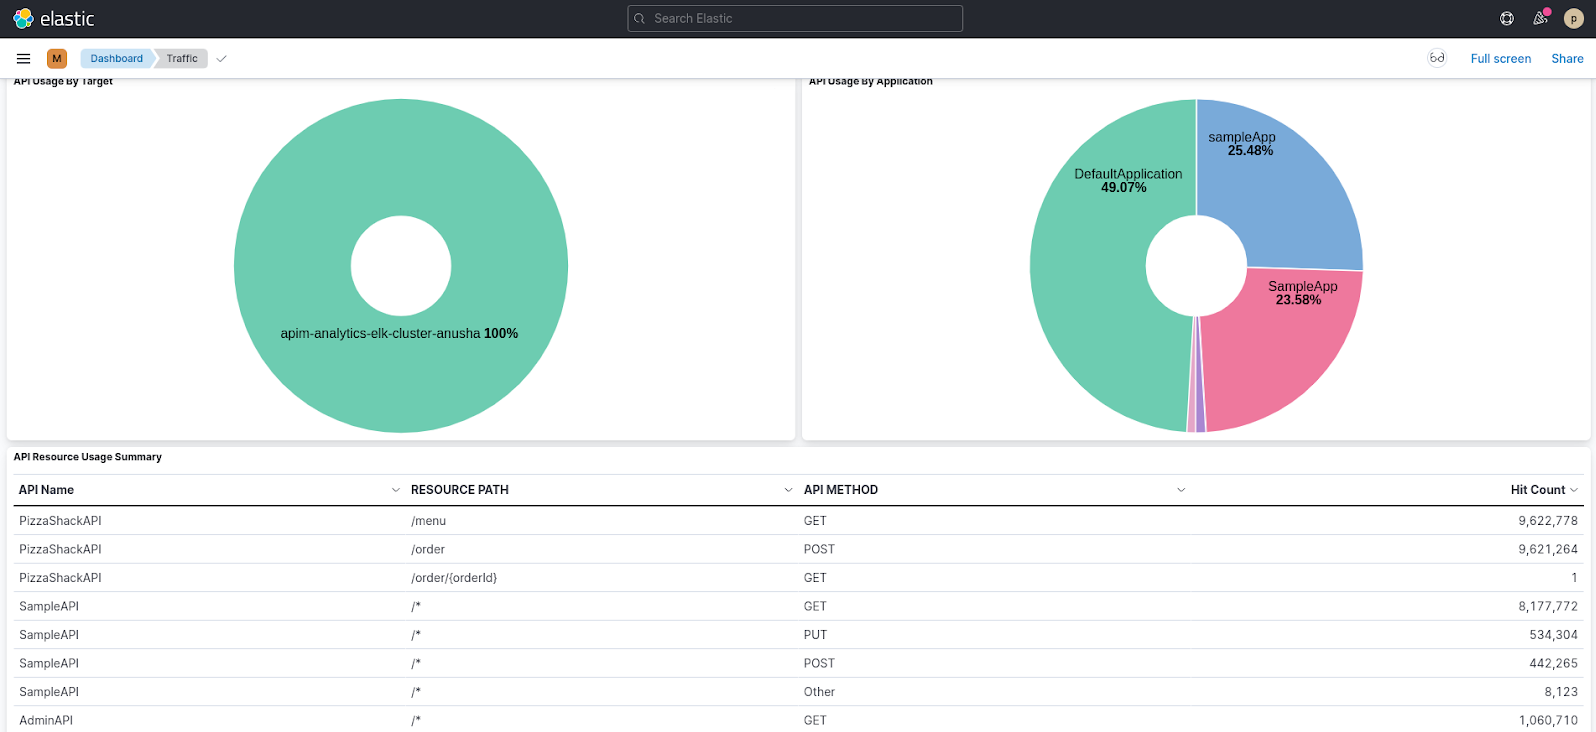
Traffic
The Traffic page shows information related to the traffic that goes through your API management deployments. This includes API usage, application usage, resource usage, etc. You can use this page to investigate the usage of APIs and applications, traffic patterns, etc.
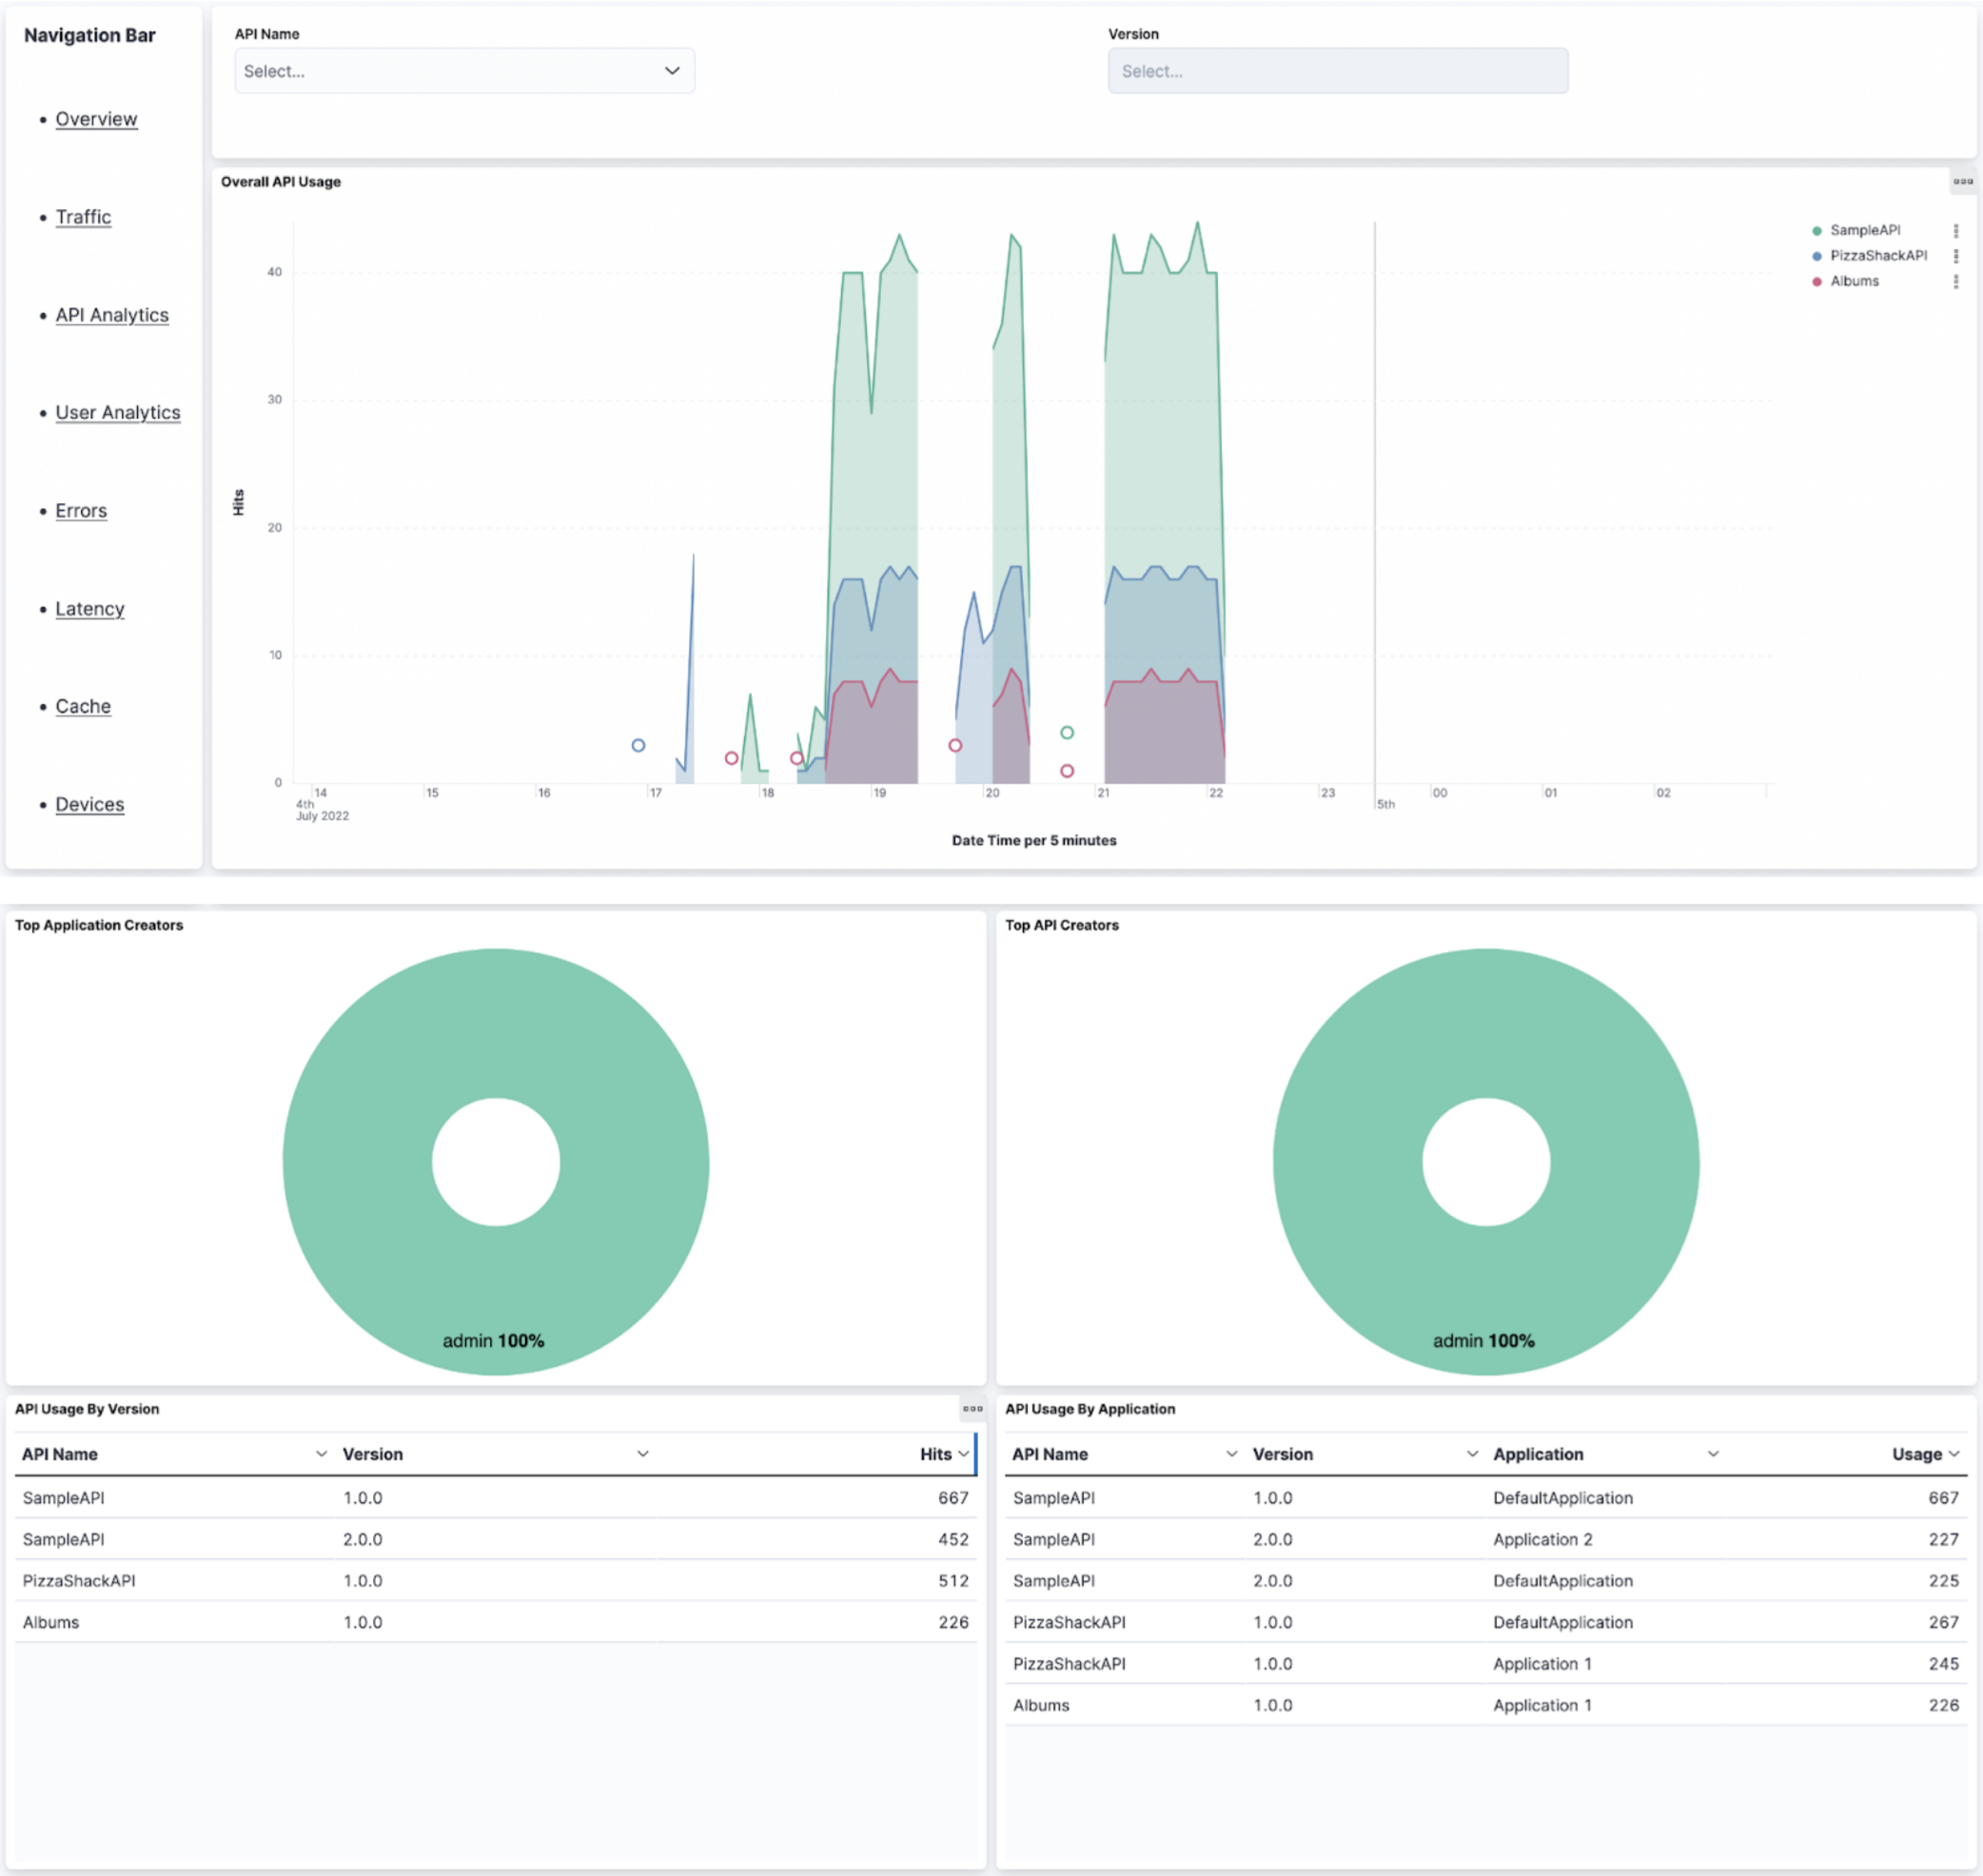
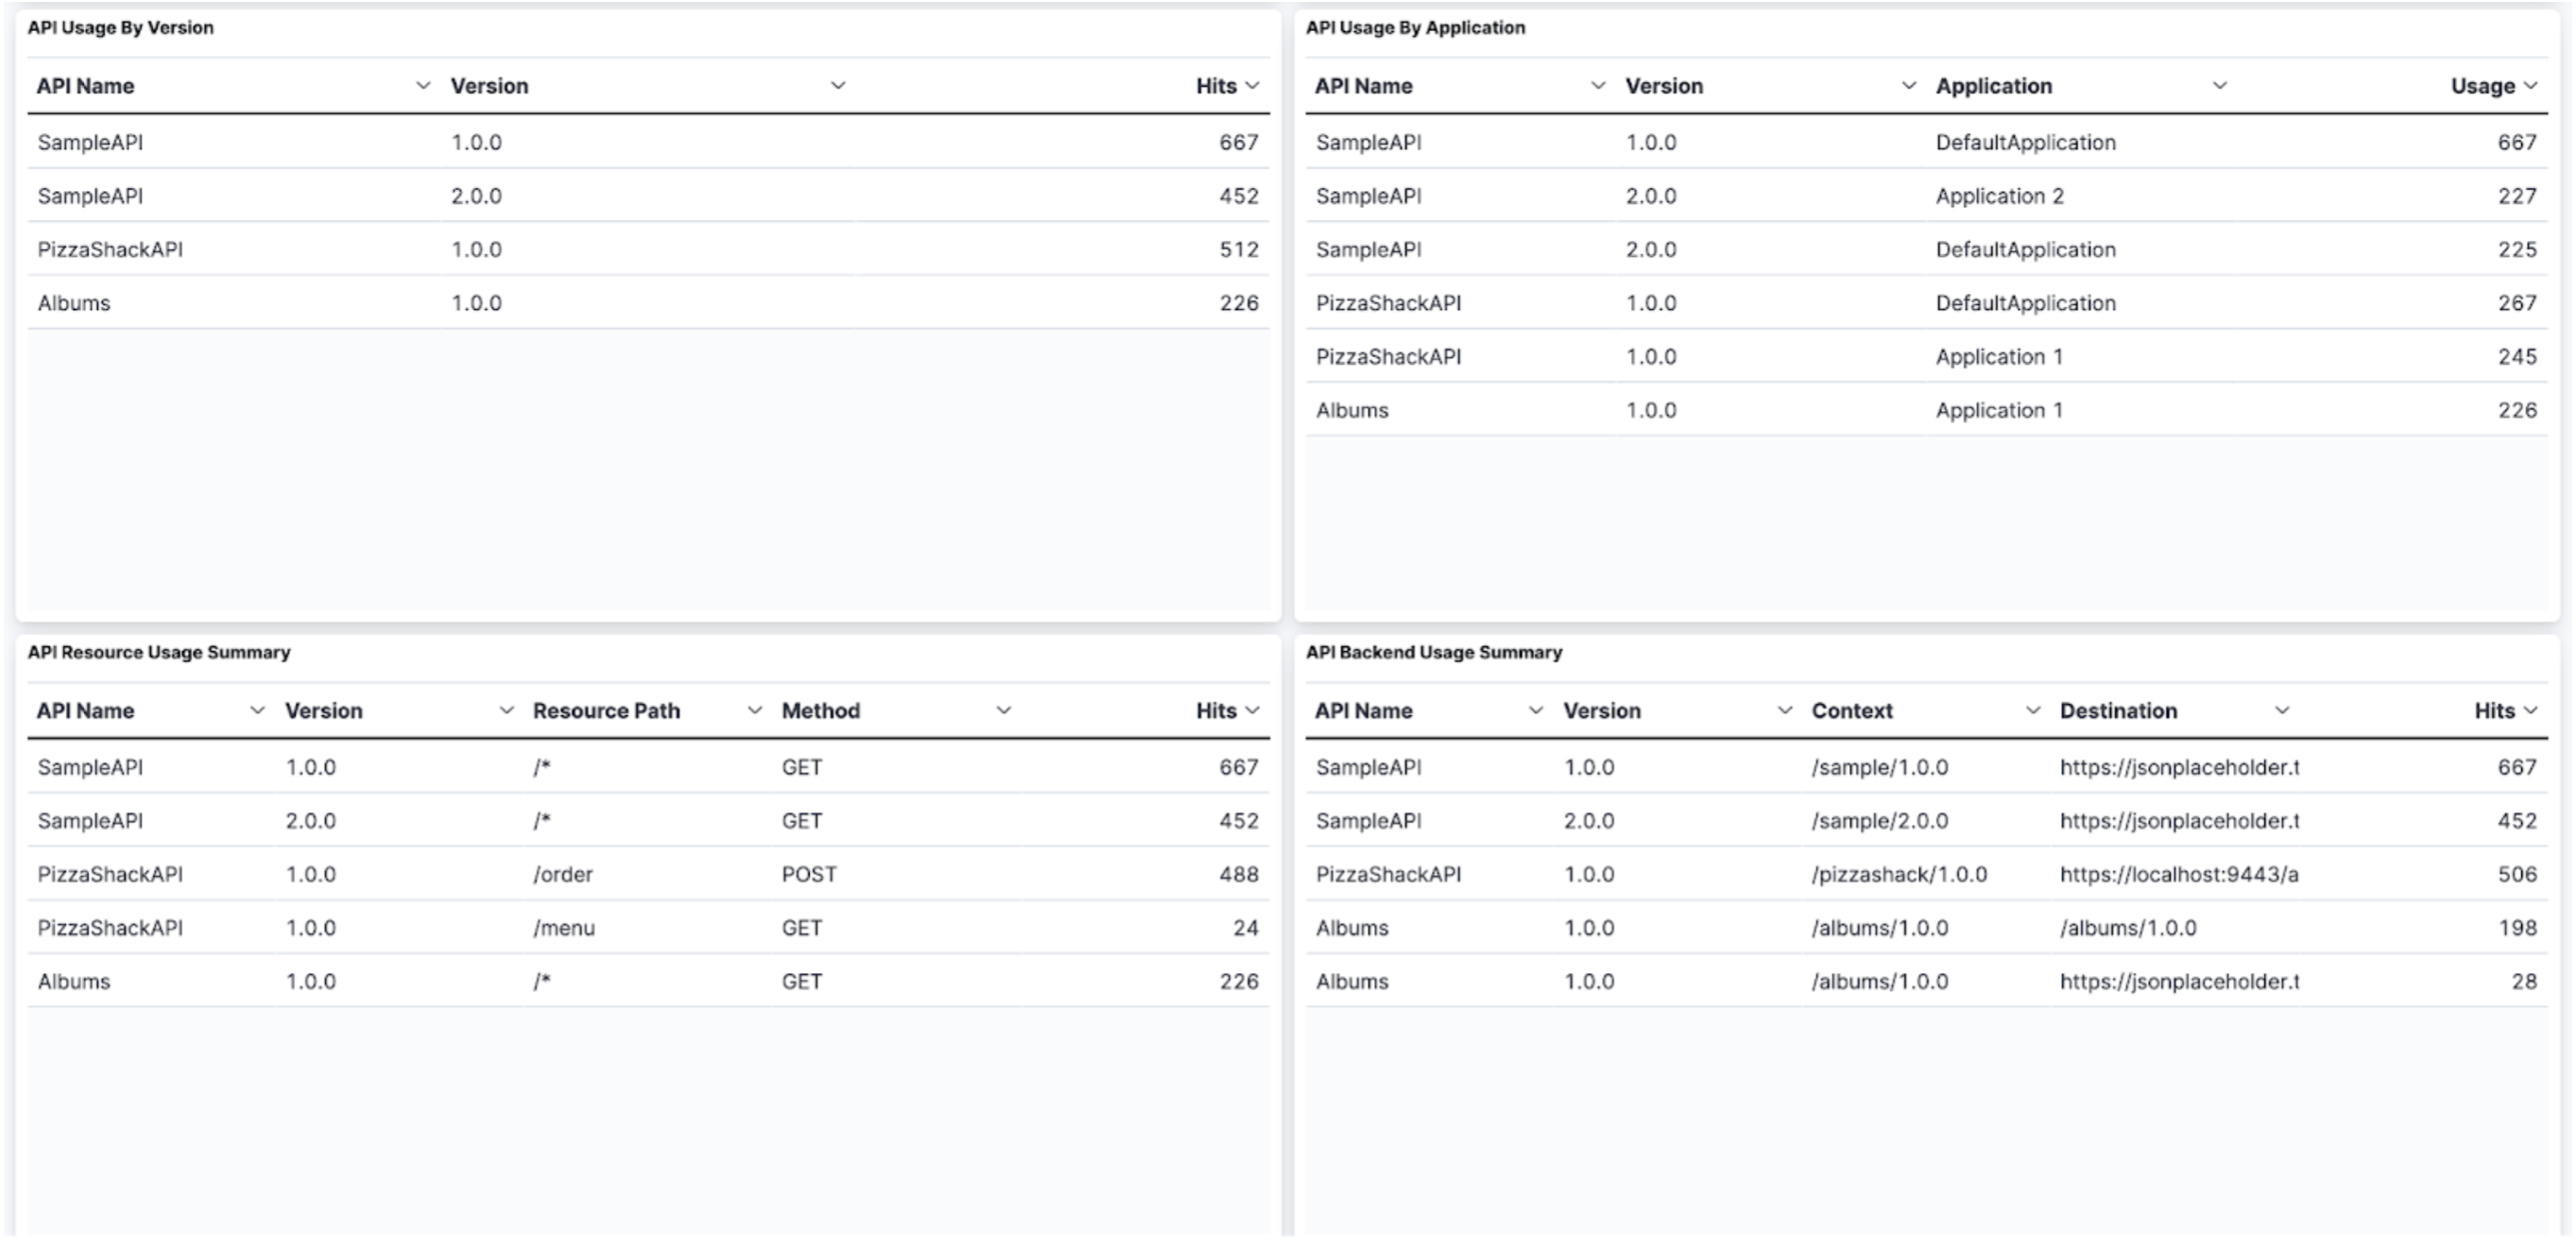
API Analytics
The API Analytics Dashboard provides business insights on APIs enabling users to take proactive actions to improve profitability and the quality of the service provided. This dashboard focuses on API developers who wish to see the analytics related to their APIs. This dashboard includes graphs to represent, Overall API Usage, Top 10 API and Application creators, API Usage by version, application, resource path and backend.
User Analytics
User Analytics dashboard provides insights of API Users, most API Users, No of success and fault requests by users for each API and application

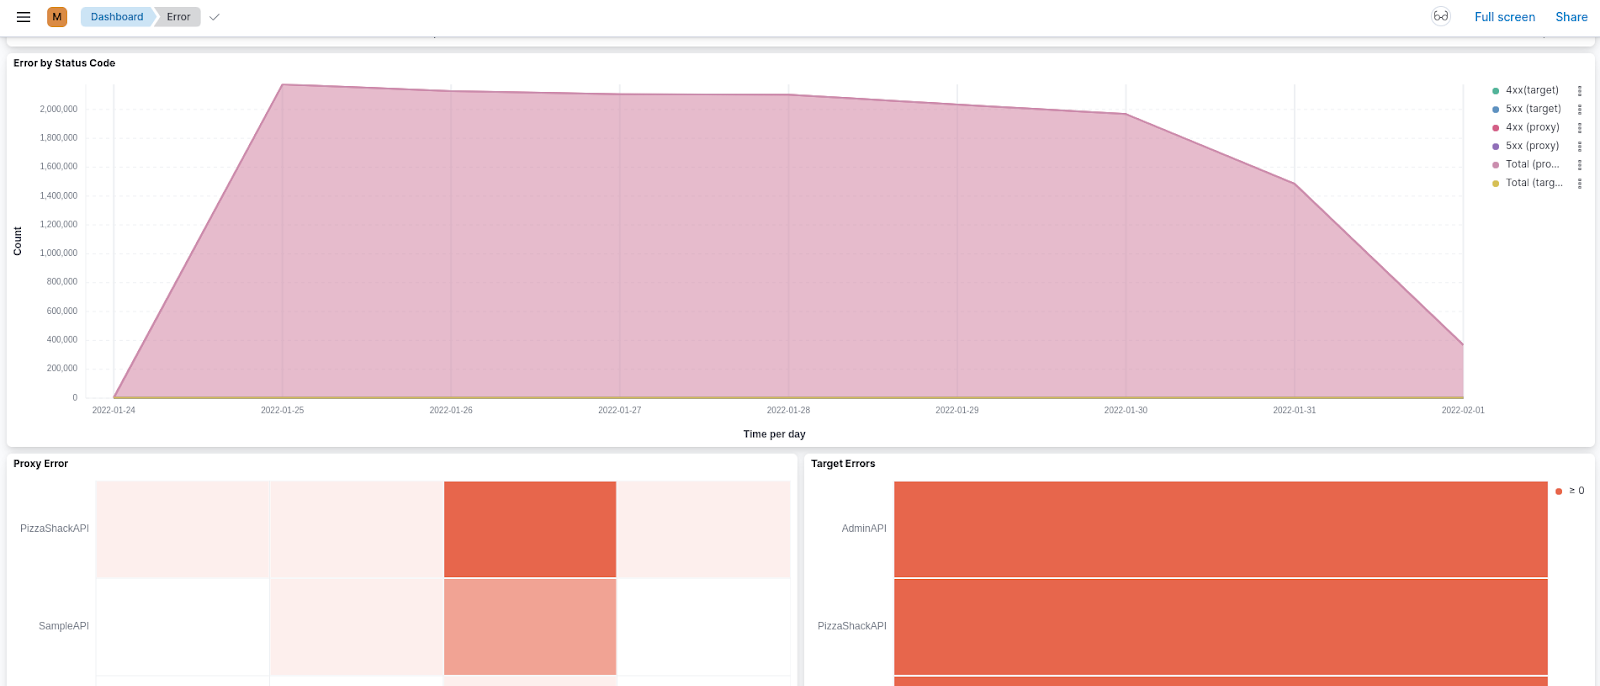
Errors
The Errors page shows information related to erroneous API calls that are received by your system. The errors are categorized based on the error type. You can further drill down using the error subtypes. Use this page as the starting point for debugging any API errors.
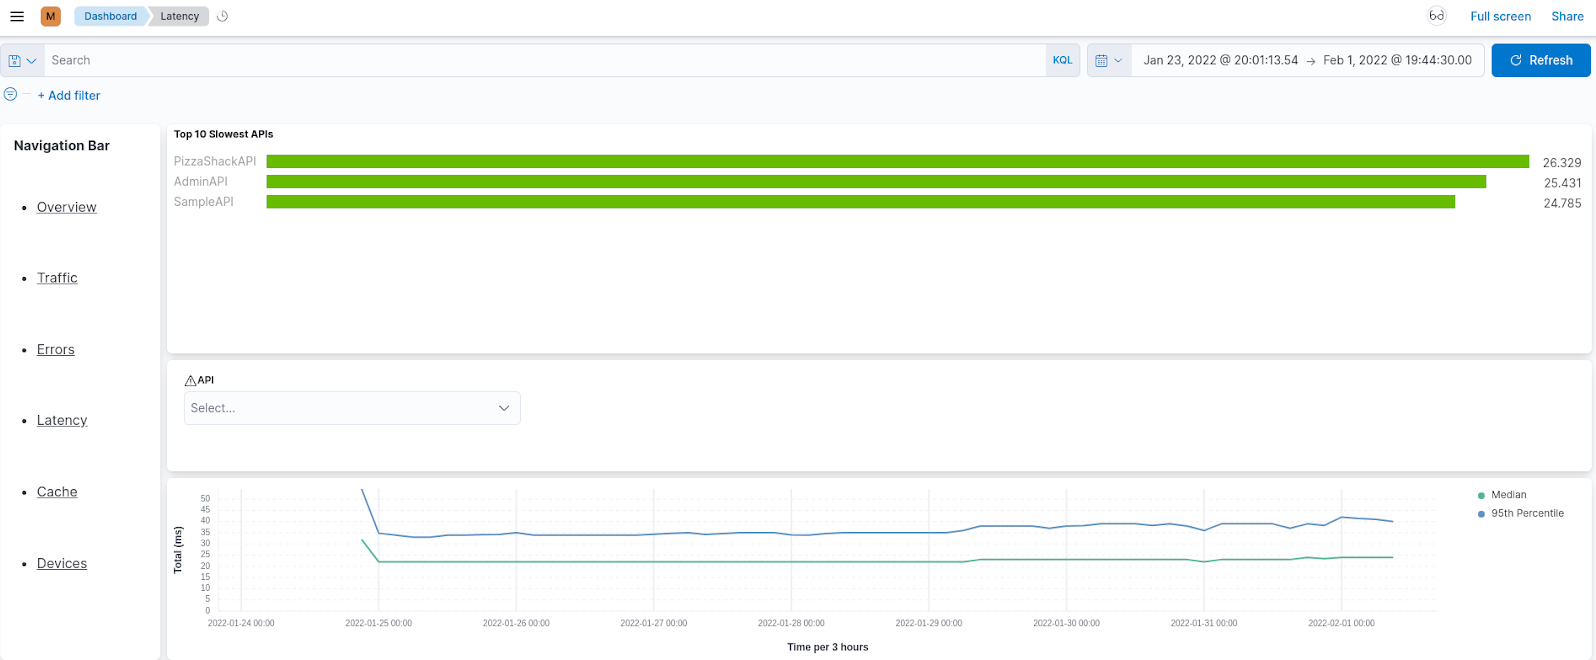
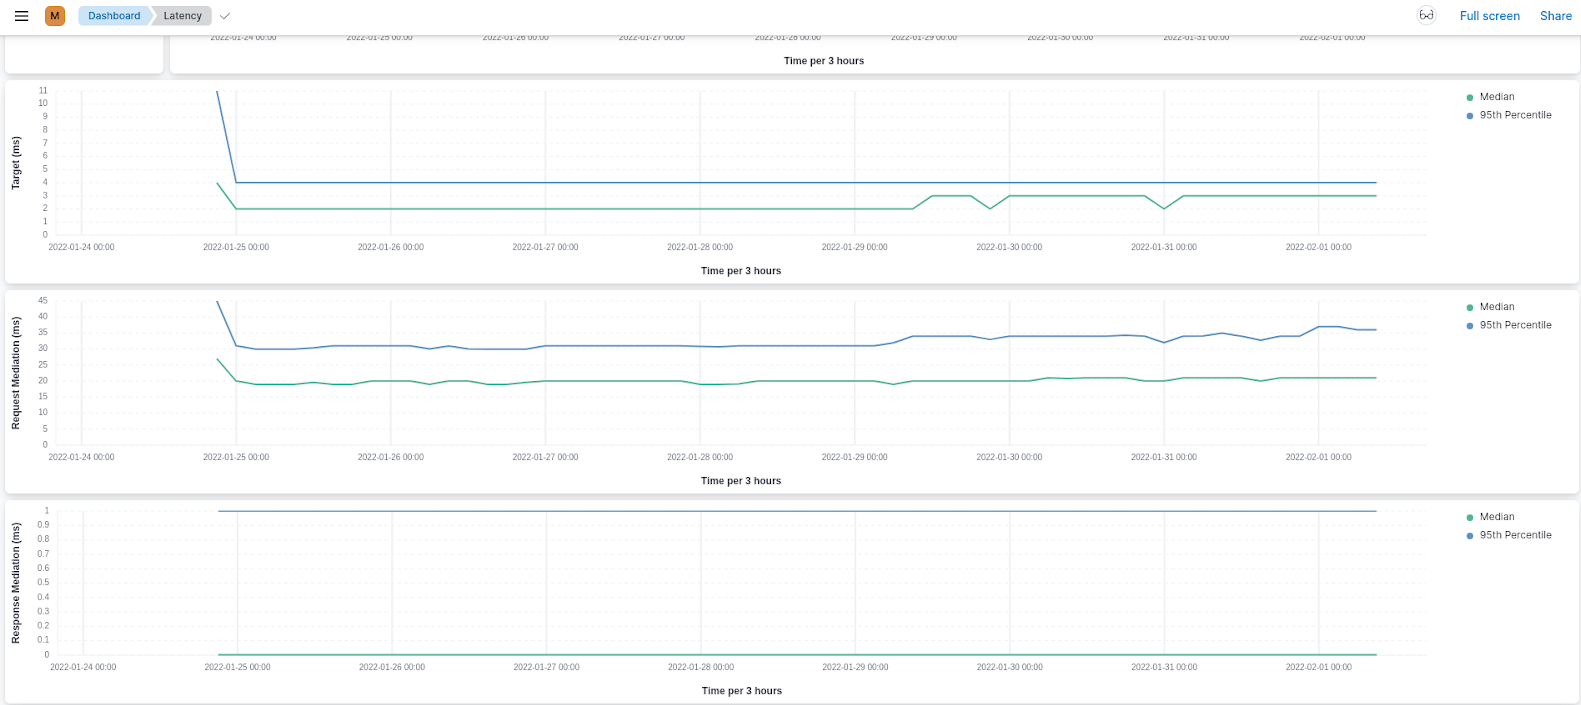
Latency
The Latency page shows information related to the latency of API calls within the API management deployment. You can view a summary of the slowest APIs and then drill down into the API view for further analysis. Use this page as a starting point to debug API slowness.
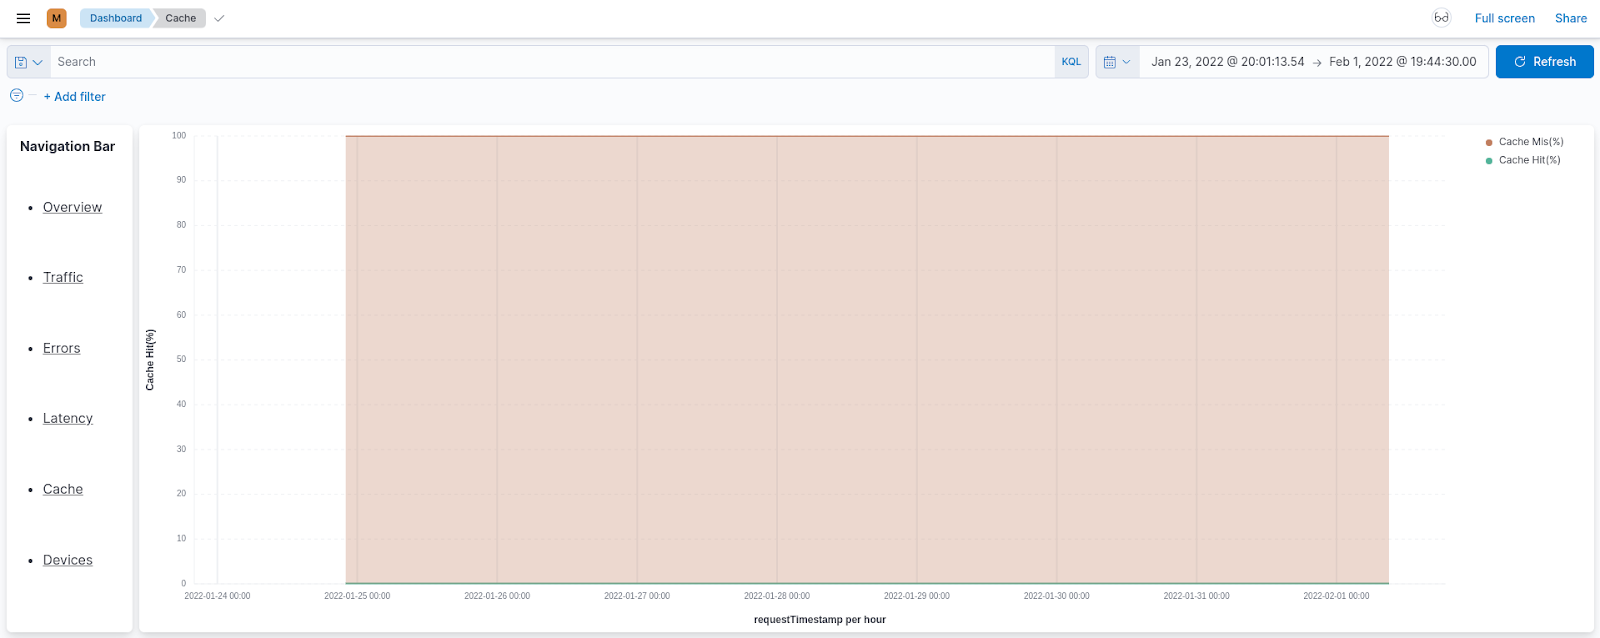
Cache
The Cache page shows statistics that indicate the efficiency with which response caching is carried out for the requests sent to your APIs.
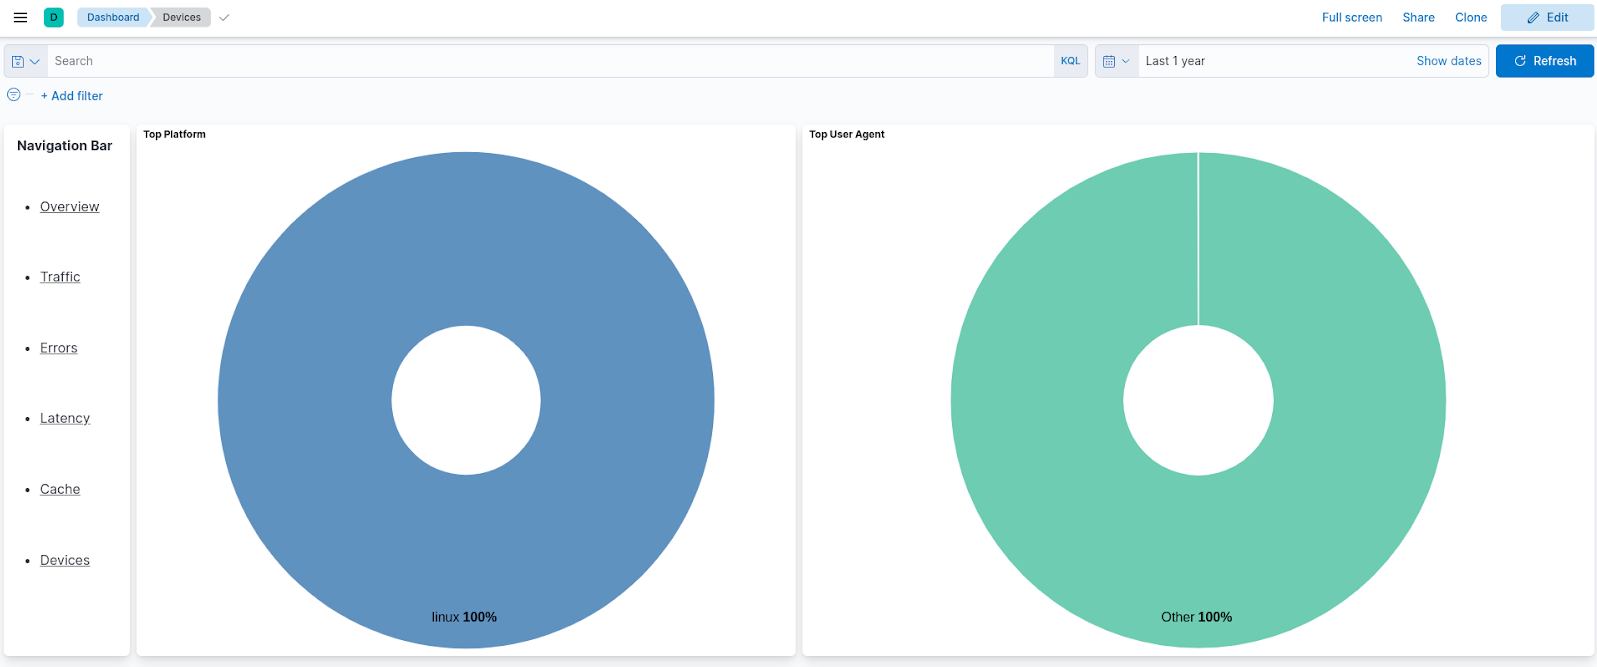
Devices
The Devices page displays information about operating systems and HTTP agents that end users use to invoke the APIs. You can use this page to get an idea of the distribution of your user base and improve your APIs to match the audience.