OpenSearch Based Analytics Installation Guide
Analytics Data flow
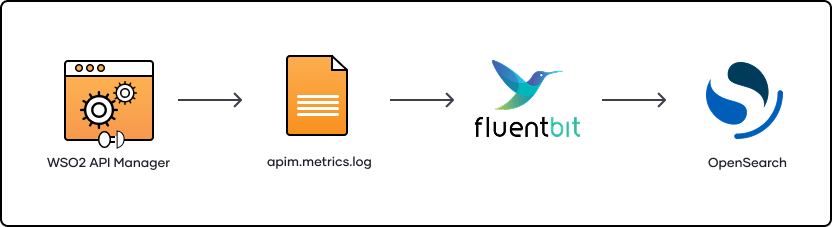
The OpenSearch Based Analytics solution for WSO2 API Manager will publish analytics data into a log file and that file will be used as the source for the analytics solution.
OpenSearch based WSO2 API Manager On-Premise Analytics deployment architecture has 3 main components.
- Fluent Bit
- OpenSearch
- OpenSearch Dashboards
This section will cover the steps required to configure the WSO2 API-M and then publish it to an external OpenSearch cluster.
Step 1 - Configuring API Manager
Step 1.1 - Configuring the deployment.toml file.
Open the wso2am-4.x.x/repository/conf directory. Edit apim.analytics configurations in the deployment.toml file with the following configuration.
[apim.analytics]
enable = true
type = "opensearch"
Step 1.2 - Enabling Logs
Note
Note that, the following configurations are added by default from the APIM 4.3.0 version onwards.
Open the wso2am-4.x.x/repository/conf directory. To enable logging for a reporter, edit the log4j2.properties file following the instructions given below.
-
Add APIM_METRICS_APPENDER to the appenders list:
appenders = APIM_METRICS_APPENDER, .... (list of other available appenders) -
Add the following configuration after the appenders:
appender.APIM_METRICS_APPENDER.type = RollingFile appender.APIM_METRICS_APPENDER.name = APIM_METRICS_APPENDER appender.APIM_METRICS_APPENDER.fileName = ${sys:carbon.home}/repository/logs/apim_metrics.log appender.APIM_METRICS_APPENDER.filePattern = ${sys:carbon.home}/repository/logs/apim_metrics-%d{MM-dd-yyyy}-%i.log appender.APIM_METRICS_APPENDER.layout.type = PatternLayout appender.APIM_METRICS_APPENDER.layout.pattern = %d{HH:mm:ss,SSS} [%X{ip}-%X{host}] [%t] %5p %c{1} %m%n appender.APIM_METRICS_APPENDER.policies.type = Policies appender.APIM_METRICS_APPENDER.policies.time.type = TimeBasedTriggeringPolicy appender.APIM_METRICS_APPENDER.policies.time.interval = 1 appender.APIM_METRICS_APPENDER.policies.time.modulate = true appender.APIM_METRICS_APPENDER.policies.size.type = SizeBasedTriggeringPolicy appender.APIM_METRICS_APPENDER.policies.size.size=1000MB appender.APIM_METRICS_APPENDER.strategy.type = DefaultRolloverStrategy appender.APIM_METRICS_APPENDER.strategy.max = 10 -
Add a reporter to the loggers list:
loggers = reporter, ...(list of other available loggers) -
Add the following configurations after the loggers:
logger.reporter.name = org.wso2.am.analytics.publisher.reporter.elk
logger.reporter.level = INFO
logger.reporter.additivity = false
logger.reporter.appenderRef.APIM_METRICS_APPENDER.ref = APIM_METRICS_APPENDER
Note
The apim_metrics.log file be rolled each day or when the log size reaches the limit of 1000 MB by default. Furthermore, only 10 revisions will be kept and older revisions will be deleted automatically. You can change these configurations by updating the configurations provided in step 2 given above in this. section.
Note
Following are the details that are available on analytics log events:
apim_event_response - This event will be triggered for each successful API invocation. When an API associated backend returns an error response still it will be logged through this event.
apim_event_response:
{
    "apiCreator": "admin",
    "apiCreatorTenantDomain": "carbon.super",
    "apiId": "43d030dc-427f-4678-98e3-87b7d9882b5f",
    "apiMethod": "GET",
    "apiName": "SampleAPI",
    "apiResourceTemplate": "/*",
    "apiType": "HTTP",
    "apiVersion": "1.0.0",
    "applicationId": "2d6c54b0-7c7d-4b50-83dc-e6ae6f88962e",
    "applicationName": "DefaultApplication",
    "applicationOwner": "admin",
    "backendLatency": 13,
    "correlationId": "79ed20c3-55b1-434a-adf6-eea25e2d09c3",
    "destination": "http://192.168.114.51:8281/services/sampleAPIBackend",
    "eventType": "response",
    "gatewayType": "SYNAPSE",
    "keyType": "SANDBOX",
    "platform": "Mac OS X",
    "properties":{},
    "apiContext":"/api1/2.0.0",
    "userName":"[email protected]"
    "proxyResponseCode": 202,
    "regionId": "default",
    "requestMediationLatency": 54,
    "requestTimestamp": "2022-01-20T03:34:36.451Z",
    "responseCacheHit": false,
    "responseLatency": 73,
    "responseMediationLatency": 6,
    "targetResponseCode": 202,
    "userAgent": "Chrome",
    "userIp": "172.16.2.70"
}
apim_event_faulty - This event will be triggered for each failed and throttled API invocation
apim_event_faulty:
{
    "apiCreator": "admin",
    "apiCreatorTenantDomain": "carbon.super",
    "apiId": "43d030dc-427f-4678-98e3-87b7d9882b5f",
    "apiName": "SampleAPI",
    "apiType": "HTTP",
    "apiVersion": "1.0.0",
    "applicationId": "0b5ccc91-30e2-4ee5-9355-d1698075c028",
    "applicationName": "SampleApp3",
    "applicationOwner": "admin",
    "correlationId": "ccf2196f-9db8-429b-aaae-98f4c6edf6d7",
    "errorCode": 900803,
    "errorMessage": "APPLICATION_LEVEL_LIMIT_EXCEEDED",
    "errorType": "THROTTLED",
    "eventType": "fault",
    "gatewayType": "SYNAPSE",
    "keyType": "PRODUCTION",
    "proxyResponseCode": 429,
    "regionId": "default",
    "requestTimestamp": "2022-02-01T04:18:48.023Z",
    "responseCacheHit": false,
    "targetResponseCode": -1
}
| Parameter | Type | Description |
|---|---|---|
| "apiCreator" | string | The creator of the API. |
| "apiCreatorTenantDomain" | string | The tenant domain of the API creator. |
| "apiId" | string | Unique identifier of the API. |
| "apiMethod" | string | The HTTP method used by the API (e.g., GET, POST). |
| "apiName" | string | The name of the API. |
| "apiResourceTemplate" | string | The template of the API resource accessed. |
| "apiType" | string | The type of the API (e.g., HTTP, REST). |
| "apiVersion" | string | The version of the API. |
| "applicationId" | string | Unique identifier of the application that makes the API call. |
| "applicationName" | string | Name of the application that makes the API call. |
| "applicationOwner" | string | Owner of the application that makes the API call. |
| "backendLatency" | long | The time taken by the backend to process the request. |
| "correlationId" | string | Unique identifier for tracking API calls. |
| "destination" | string | The backend URL to which the API call was redirected. |
| "eventType" | string | The type of event. |
| "gatewayType" | string | The type of the API gateway. |
| "keyType" | string | Indicates whether the API key used was for SANDBOX or PRODUCTION. |
| "platform" | string | Operating system was used to access the API. |
| "properties" | object | Properties of the event. |
| "apiContext" | string | The context of the API call. |
| "userName" | string | The username of the individual who made the API call. |
| "proxyResponseCode" | int | The HTTP response code returned by the API gateway. |
| "regionId" | string | The region identifier for the API call. |
| "requestMediationLatency" | int | Time taken for request mediation. |
| "requestTimestamp" | long | Timestamp when the request was made. |
| "responseCacheHit" | bool | Indicates if the response was served from cache. |
| "responseLatency" | long | Total time taken to respond to the request. |
| "responseMediationLatency" | long | Time taken for response mediation. |
| "targetResponseCode" | int | The HTTP response code received from the backend target. |
| "userAgent" | string | The user agent of the client making the API call. |
| "userIp" | string | The IP address of the user making the API call. |
| "errorCode" | int | The error code generated in a fault. |
| "errorMessage" | string | The error message associated with the fault. |
| "errorType" | string | The type of error (e.g., THROTTLED). |
Step 2 - Installing OpenSearch
- Follow the OpenSearch installation guide to install the OpenSearch Cluster.
- Follow the OpenSearch dashboard installation guide to install the OpenSearch dashboards.
Step 3 - Installing and Configuring Fluent Bit
-
To install Fluent Bit, follow one of the guides below based on your operating system.
-
After installing Fluent Bit and OpenSearch, create a Fluent Bit configuration file (fluent-bit.conf) with the following attributes to direct WSO2 APIM metrics logs in the
repository/logsfolder to the OpenSearch cluster.
Note
In the below configuration, update <APIM_HOME>, <TAIL_FILE_PATH>, <PATH_TO_PARSER_CONFIG>, and, <PASSWORD> to match your setup.
[SERVICE]
    Flush               1
    Daemon              Off
    Log_Level           info
    Parsers_File        <PATH_TO_PARSER_CONFIG>/parsers.conf

# --- INPUT: APIM Metrics ---
[INPUT]
    Name                tail
    Tag                 apim.metrics
    Path                <APIM_HOME>/repository/logs/apim_metrics.log
    Refresh_Interval    5
    Buffer_Chunk_Size   32KB
    Buffer_Max_Size     2MB
    Mem_Buf_Limit       256MB
    Read_from_Head      true
    DB                  <TAIL_FILE_PATH>/metrics-tail-status.db

# --- FILTERS for APIM Metrics ---
[FILTER]
    Name                parser
    Match               apim.metrics
    Key_Name            log
    Parser              apim_metrics_parser
    Reserve_Data        On
    Preserve_Key        Off

[FILTER]
    Name                parser
    Match               apim.metrics
    Key_Name            properties
    Parser              jsonparser
    Reserve_Data        On
    Preserve_Key        Off

[FILTER]
    Name                rewrite_tag
    Match               apim.metrics
    Rule                $apimMetrics   ^apim:response$   metrics.response   false

[FILTER]
    Name                rewrite_tag
    Match               apim.metrics
    Rule                $apimMetrics   ^apim:faulty$     metrics.faulty     false

# --- OUTPUT: Metrics Response ---

[OUTPUT]
    Name                opensearch
    Match               metrics.response
    Host                127.0.0.1
    Port                9200
    HTTP_User           admin
    HTTP_Passwd         <PASSWORD>
    Logstash_Format     On
    Logstash_DateFormat %Y-%m-%d
    Logstash_Prefix     apim_event_response
    Replace_Dots        On
    Suppress_Type_Name  On
    tls                 On
    tls.verify          Off
    Trace_Error         On

# --- OUTPUT: Metrics Faulty ---
[OUTPUT]
    Name                opensearch
    Match               metrics.faulty
    Host                127.0.0.1
    Port                9200
    HTTP_User           admin
    HTTP_Passwd         <PASSWORD>
    Logstash_Format     On
    Logstash_DateFormat %Y-%m-%d
    Logstash_Prefix     apim_event_faulty
    Replace_Dots        On
    Suppress_Type_Name  On
    tls                 On
    tls.verify          Off
    Trace_Error         On
Create a parser configuration file (parsers.conf) with the following configurations.
[PARSER]
    Name            apim_metrics_parser
    Format          regex
    Regex           ^\s*(?:.*?)\s+apimMetrics:\s*(?<apimMetrics>[^,]+?),\s*(?:.*?)\s*:\s*(?<properties>\{.*\})\s*(?:.*)$

[PARSER]
    Name        jsonparser
    Format      json
    Time_Key    time
    Time_Keep   On
View Analytics from OpenSearch Dashboards
-
Start the OpenSearch cluster and dashboards. Once started,Opensearch dashboard can be accessed at http://0.0.0.0:5601.
-
Start Fluent Bit using the following command:
fluent-bit -c <path_to_your_fluent-bit.conf> -
Log in to the OpenSearch dashboards.
-
Navigate to Stack Management > index pattern. If you already have any index patterns created under the following names, delete them before importing the saved artifacts.
apim_event* apim_event_faulty apim_event_response -
Download the artifact file from below.
Artifacts - Navigate to Dashboard Management > Saved Objects and click on Import. Add the downloaded artifact file as an import object, and import.