Enabling Tracing with OpenTracing
In a distributed API Manager architecture, tracing a message is important to debug and observe a message path. This is known as distributed tracing. OpenTracing allows you to enable distributed tracing for WSO2 API Manager. OpenTracing aims to be an open, vendor-neutral standard for distributed systems instrumentation. It offers a way for developers to follow the thread — to trace requests from beginning to end across touchpoints and understand distributed systems at scale. Open tracing will also help to trace the message and identify the latencies that took place in each process or method. Thereby, open tracing will help you to carry out a time-related analysis.
WSO2 API Manager supports the following types of ways to retrieve instrumented data.
- Jaeger
- Zipkin
- Log
For more information, see Open Tracer Configurations.
Enabling Jaeger Tracing
-
Copy the following configuration into the
deployment.tomlfile.[apim.open_tracer] remote_tracer.enable = true remote_tracer.name = "jaeger" remote_tracer.properties.hostname = "<hostname-of-jaeger-endpoint>" remote_tracer.properties.port = "<port-of-jaeger-endpoint>"[apim.open_tracer] remote_tracer.enable = true remote_tracer.name = "jaeger" remote_tracer.properties.hostname = "localhost" remote_tracer.properties.port = "6831" #6832 can also be used as the port -
Start the server.
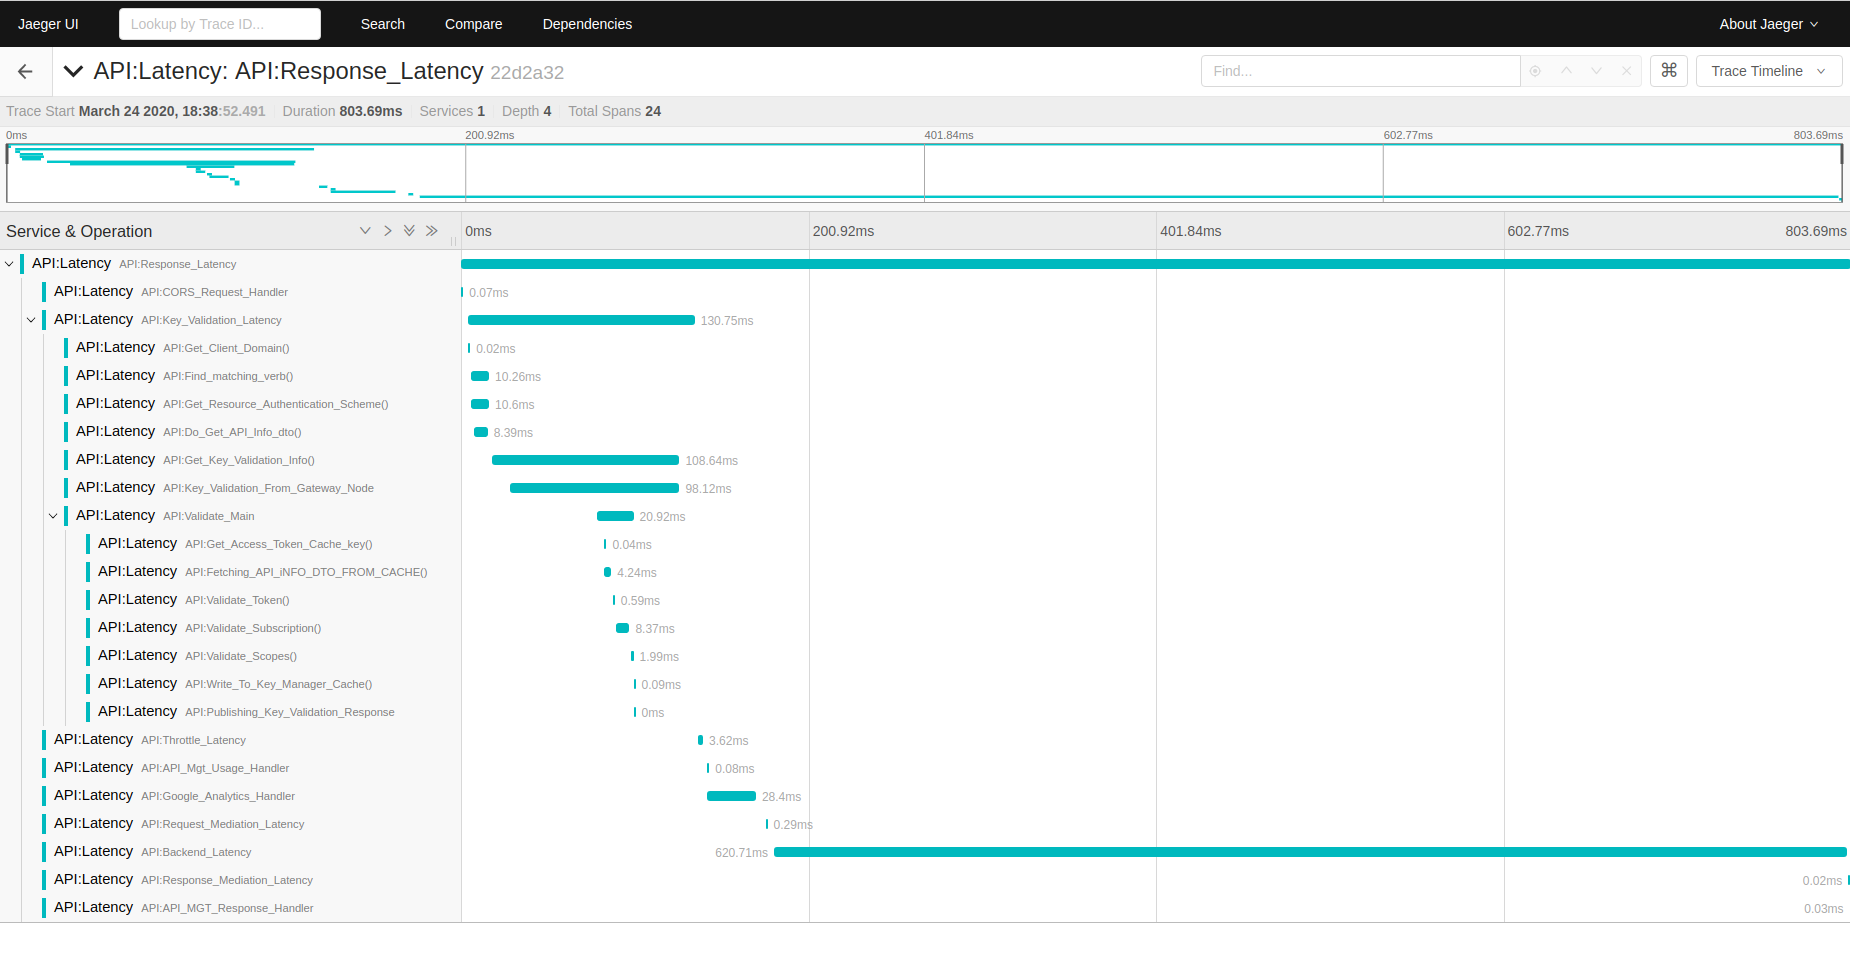
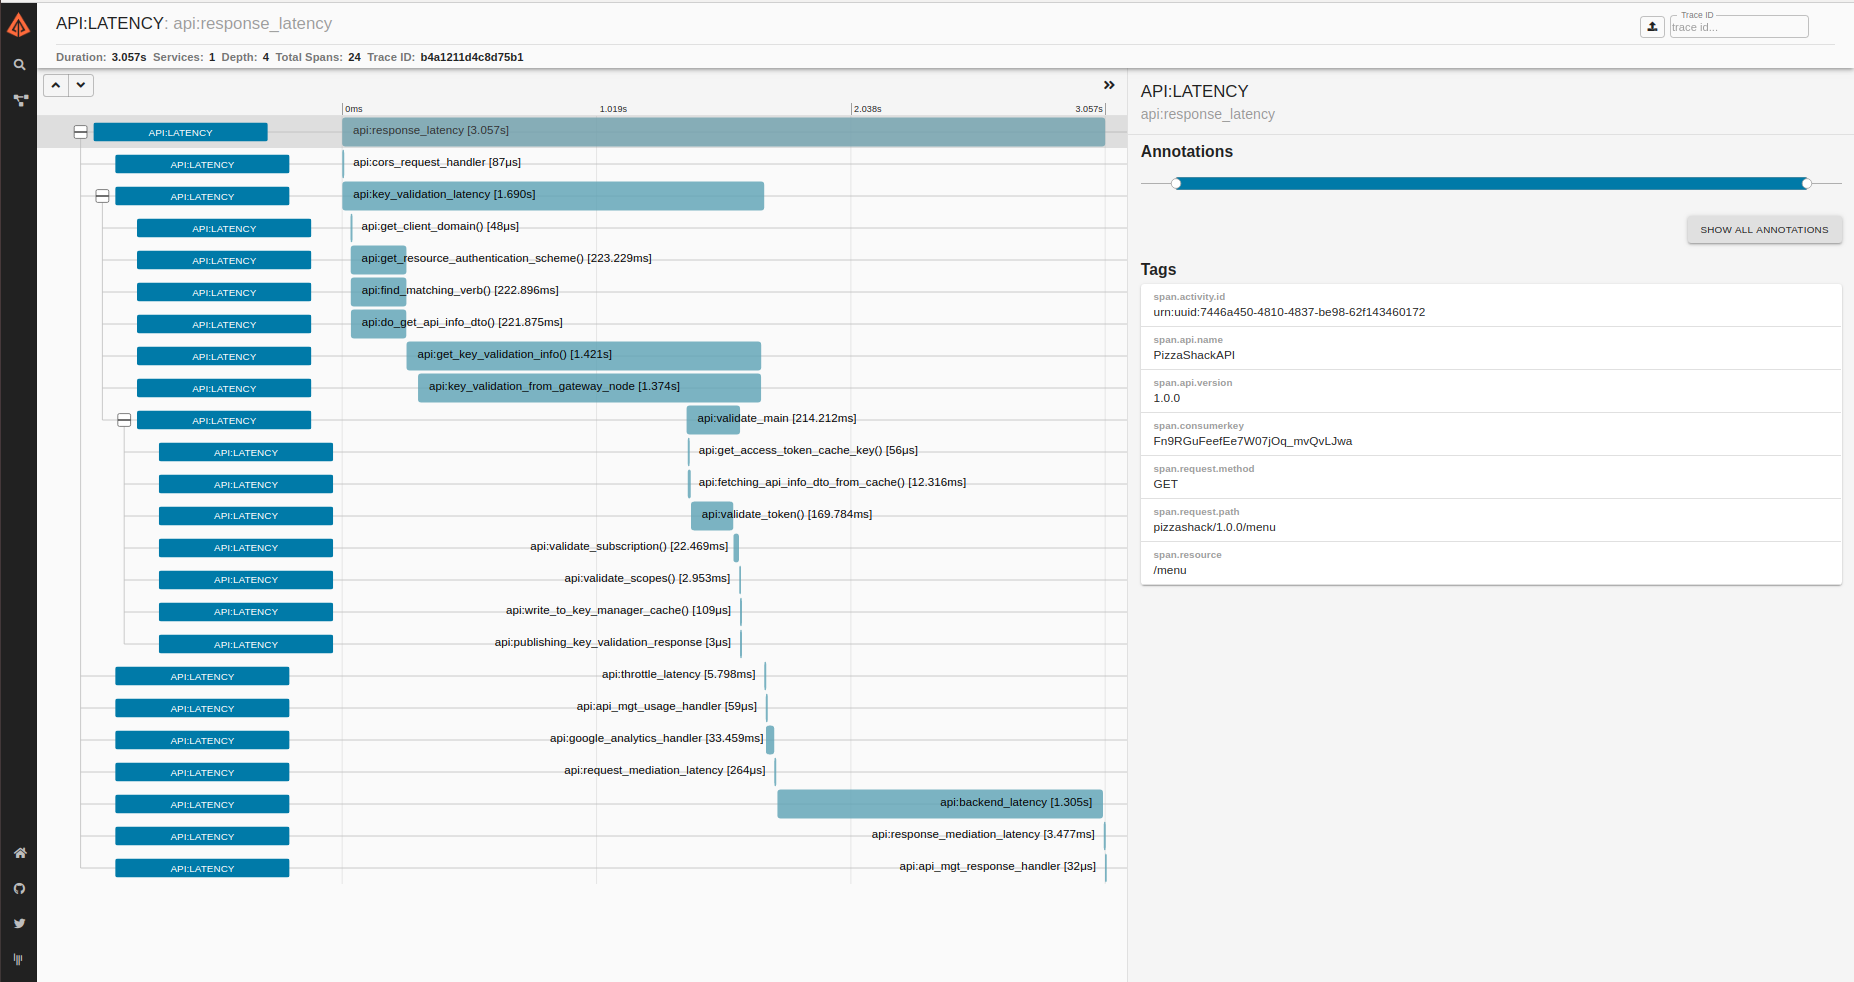
After you invoke the APIs you will see the tracing data in Jaeger as follow:
Enabling Zipkin Tracing
-
Copy the following configuration into the
deployment.tomlfile.[apim.open_tracer] remote_tracer.enable = true remote_tracer.name = "zipkin" remote_tracer.properties.hostname = "<hostname-of-zikin-endpoint>" remote_tracer.properties.port = "<port-o-zipkin-endpoint>"[apim.open_tracer] remote_tracer.enable = true remote_tracer.name = "zipkin" remote_tracer.properties.hostname = "localhost" remote_tracer.properties.port = "9411" -
Start the server.
After you invoke the APIs you will see the tracing data in Zipkin as follow:
Enabling Log Tracing
-
Navigate to the
<APIM_HOME>/conf/log4j2.propertiesfile and locate the following configuration.logger.trace.name = trace -
Change the above configuration as follows.
logger.trace.name = tracer -
Copy the following configuration into the
deployment.tomlfile.[apim.open_tracer] remote_tracer.enable = false log_tracer.enable = true -
Start the server.
After you invoke the APIs you will be able to see tracing data in the
wso2-apimgt-open-tracing.login the<API-M_HOME>/repository/logsfolder.
Note
- There are some limitations in the Jaeger client, which by default uses a UDP sender as mentioned in the Jaeger documentation. If the payload size exceeds 65 KB, spans might get lost in the Jaeger console.
- Jaeger sampler types can also play a major role in tracing. Depending on the TPS, the sampler type should be carefully chosen.
- In general, before including tracing in production deployments it is essential to look into performance tests and scaling requirements. Refer the Jaeger performance tuning guide for details on how to achieve better performance.
Use Custom Tracer Implementation
In order to demonstrate this functionality, let's take the following scenario.
-
Implement the
org.wso2.carbon.apimgt.tracing.OpenTracerinterface and add your implementation. The getTracer method should contain the generation of theTracerinstance. Also, the getName method should return the tracer name to be configured in thedeployment.tomlfile. This tracer needs to be loaded as an osgi service using a module activator. -
Build the maven project and add the jar file to the dropins directory. (API-M_HOME/repository/components/dropins)
-
Add the following configuration into the
deployment.tomlfile.[apim.open_tracer] remote_tracer.enable = true remote_tracer.name = <custom_tracer_name>[apim.open_tracer] remote_tracer.enable = true remote_tracer.name = "elastic" -
Add the dependencies (jar files) required by your specific tracer into the
libdirectory (API-M_HOME/repository/components/lib). -
Start the server.
After you invoke the APIs tracing data will be published to the configured tracing server.