Setting up logging in API Manager
Logging is one of the most important aspects of a production-grade server. A properly configured logging system is vital for identifying errors, security threats, and usage patterns.
WSO2 API Manager uses various types of logs to track realtime internal and external activities. Separate log files are created for each of those log types in the <APIM_HOME>/repository/logs directory. Following illustrates the log types supported by the APIM and how those logs can be configured.
Carbon Logs
WSO2 API Manager is shipped with log4j2 logging capabilities which generate logs for administrative and server-side activities. By default, carbon logs are persisted in wso2carbon.log which is located in <APIM_HOME>/repository/logs directory. You can configure the details that are captured in this log file by configuring the <APIM_HOME>/repository/conf/log4j2.properties.
Java
In addition to the logs from libraries that use Log4j, all logs from libraries such as, Tomcat and Hazelcast that use Java logging framework are also visible in the same log files. That is, when Java logging is enabled in Carbon, only the Log4j appenders will write to the log files. If the Java Logging Handlers have logs, these logs will be delegated to the log events of the corresponding Log4j appenders. A Pub/Sub registry pattern implementation has been used in the latter mentioned scenario to plug the handlers and appenders.
Configuring Carbon logs
Following is the default configuration for carbon logs and the default values can be changed by manually updating log4j2.properties file.
 ```
 appender.CARBON_LOGFILE.type = RollingFile
 appender.CARBON_LOGFILE.name = CARBON_LOGFILE
 appender.CARBON_LOGFILE.fileName = ${sys:carbon.home}/repository/logs/wso2carbon.log
 appender.CARBON_LOGFILE.filePattern = ${sys:carbon.home}/repository/logs/wso2carbon-%d{MM-dd-yyyy}.log
 appender.CARBON_LOGFILE.layout.type = PatternLayout
 appender.CARBON_LOGFILE.layout.pattern = TID: [%tenantId] [%appName] [%d] %5p {%c} - %m%ex%n
 appender.CARBON_LOGFILE.policies.type = Policies
 appender.CARBON_LOGFILE.policies.time.type = TimeBasedTriggeringPolicy
 appender.CARBON_LOGFILE.policies.time.interval = 1
 appender.CARBON_LOGFILE.policies.time.modulate = true
 appender.CARBON_LOGFILE.policies.size.type = SizeBasedTriggeringPolicy
 appender.CARBON_LOGFILE.policies.size.size=10MB
 appender.CARBON_LOGFILE.strategy.type = DefaultRolloverStrategy
 appender.CARBON_LOGFILE.strategy.max = 20
 appender.CARBON_LOGFILE.filter.threshold.type = ThresholdFilter
 appender.CARBON_LOGFILE.filter.threshold.level = DEBUG

 appenders = CARBON_LOGFILE, CARBON_CONSOLE, AUDIT_LOGFILE, ATOMIKOS_LOGFILE, CARBON_TRACE_LOGFILE, CARBON_MEMORY,
 DELETE_EVENT_LOGFILE, TRANSACTION_LOGFILE
 ```
The log growth of carbon logs can be managed by the configurations discussed in Managing log growth guide.
Enable Logs for a Tenant
In order to write logs of tenants to a different log file the following configurations can be added to the log4j2.properties file.
```
appenders=CARBON_CONSOLE, CARBON_LOGFILE, ...., TENANT_LOGFILE

rootLogger.appenderRef.TENANT_LOGFILE.ref = TENANT_LOGFILE

# Creates tenant-wise log files
appender.TENANT_LOGFILE.type = Routing
appender.TENANT_LOGFILE.name = TENANT_LOGFILE
appender.TENANT_LOGFILE.routes.type = Routes
appender.TENANT_LOGFILE.routes.pattern = $${TenantLookup:tenantId}
appender.TENANT_LOGFILE.routes.route1.type = Route
appender.TENANT_LOGFILE.routes.route1.rolling.type = RollingFile
appender.TENANT_LOGFILE.routes.route1.rolling.name = Routing-${TenantLookup:tenantId}
appender.TENANT_LOGFILE.routes.route1.rolling.fileName = ${sys:carbon.home}/repository/logs/wso2-tenant-${TenantLookup:tenantId}.log
appender.TENANT_LOGFILE.routes.route1.rolling.filePattern = ${sys:carbon.home}/repository/logs/wso2-tenant-${TenantLookup:tenantId}-%d{MM-dd-yyyy}.log
appender.TENANT_LOGFILE.routes.route1.rolling.layout.type = PatternLayout
appender.TENANT_LOGFILE.routes.route1.rolling.layout.pattern = %d %p %C{1.} [%t] %m%n
appender.TENANT_LOGFILE.routes.route1.rolling.policy.type = SizeBasedTriggeringPolicy
appender.TENANT_LOGFILE.routes.route1.rolling.policy.size = 500MB
```
Log files will be created in <APIM_HOME>/repository/logs directory with the name wso2-tenant-<tenantDomain>.log .
Enable Logs for a Component
Please follow below steps to enable logs for a given service component available in WSO2 API Manager.
- Open
APIM_HOME>/repository/conf/log4j2.propertiesfile. -
Add a new logger specifying the component name that you need to enable logs and the log level as shown below.
logger.<Logger_Name>.name = <Component_name> logger.<Logger_Name>.level = <Log_level>logger.org-wso2-carbon-user-core.name = org.wso2.carbon.user.core logger.org-wso2-carbon-user-core.level = DEBUG -
Append the newly added logger name to
loggersconfiguration which is a comma separated list of all active loggers.loggers = <Logger_Name>, trace-messages, org-apache-coyote,com-hazelcastloggers = org-wso2-carbon-user-core, trace-messages, org-apache-coyote,com-hazelcast
Enable logs for a component via the UI
Note
You need to get the latest product updates for your product to use this feature in the current version of WSO2 API-M. This feature is available as a product update in WSO2 API-M 3.2.0 from March 3, 2022 onwards.
Warning
Note that you can deploy updates in a production environment only if you have a valid subscription with WSO2. Read more about WSO2 Updates.
Follow the instructions below to enable logs for a given service component available in WSO2 API Manager.
-
Navigate to the Carbon console https://localhost:9443/carbon and sign in with
admin/adminas the credentials. -
Go to Configure -> Logging
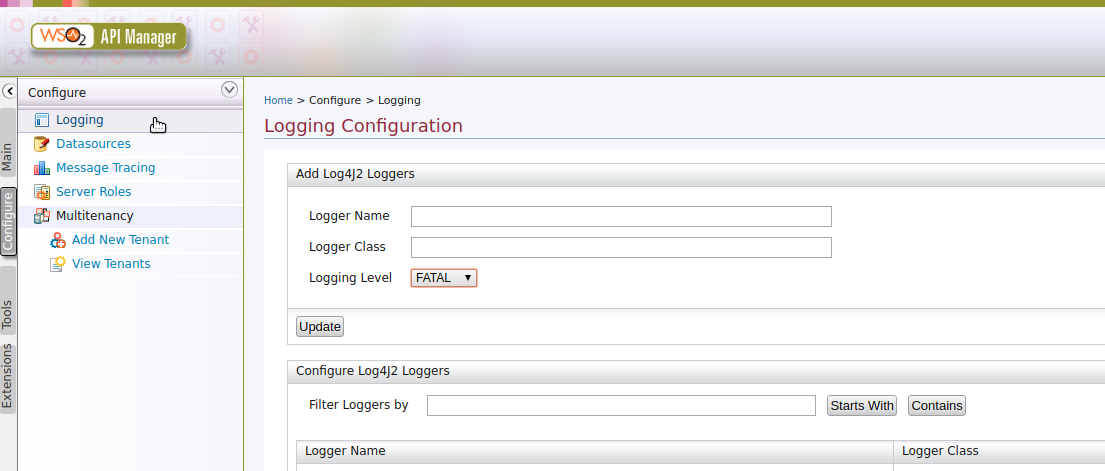
-
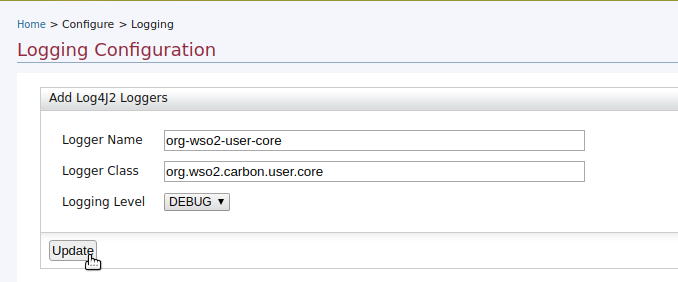
Add a new logger specifying the logger name, logger class name, and log level that you need to enable logs as shown below and click Update.
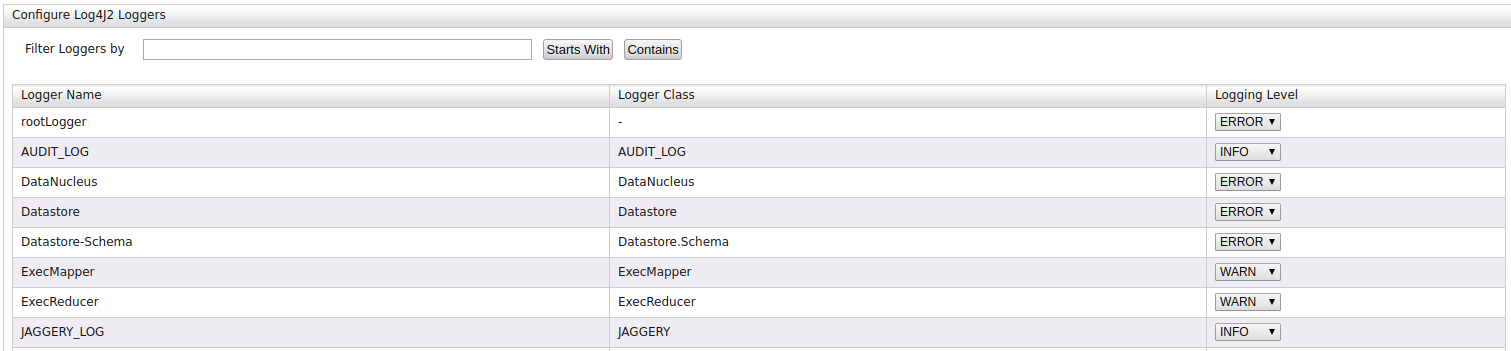
After you add the logger, it will be shown on the logger page as shown below.
-
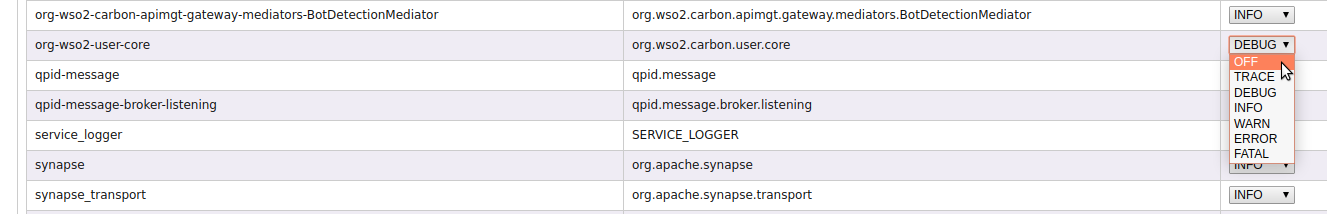
Optionally, update the log level OR disable the logs.
Navigate to the specific logger and change the log level as shown below.
Setting the Log levels
The log level can be set specifically for each appender in the log4j2.properties file by setting the threshold value. If a log level is not specifically given for an appender as explained below, the root log level (INFO) will apply to all appenders by default.
For example, shown below is how the log level is set to DEBUG for the CARBON_LOGFILE appender:
appender.CARBON_LOGFILE.filter.threshold.level = DEBUGListed below are the log levels that can be configured:
| Level | Description |
|---|---|
| OFF | The highest possible log level. This is intended for disabling logging. |
| FATAL | Indicates server errors that cause premature termination. These logs are expected to be immediately visible on the command line that you used for starting the server. |
| ERROR | Indicates other runtime errors or unexpected conditions. These logs are expected to be immediately visible on the command line that you used for starting the server. |
| WARN | Indicates the use of deprecated APIs, poor use of API, possible errors, and other runtime situations that are undesirable or unexpected but not necessarily wrong. These logs are expected to be immediately visible on the command line that you used for starting the server. |
| INFO | Indicates important runtime events, such as server startup/shutdown. These logs are expected to be immediately visible on the command line that you used for starting the server . It is recommended to keep these logs to a minimum. |
| DEBUG | Provides detailed information on the flow through the system. This information is expected to be written to logs only. Generally, most lines logged by your application should be written as DEBUG logs. |
| TRACE | Provides additional details on the behavior of events and services. This information is expected to be written to logs only. |
Log pattern layout
The log pattern of each appender can be changed with the layout.pattern parameter.
Common pattern layout parameter provided by the Apache logging service
and APIM specific parameters such as %tenantId, %tenantDomain, %appName can be used with the pattern string.
appender.CARBON_LOGFILE.layout.pattern = TID: [%tenantId] [%appName] [%d] %5p {%c} - %m%ex%nGateway Wire Logs
Gateway wire logs can be configure to monitor the HTTP message flow through API Gateway. Wire logs allow you to track the request headers, request payloads, response headers, response payloads etc of incoming and outgoing http traffic.
Warning
Please note that wire logs should be enabled for troubleshooting purposes only. It is not recommended to run production systems with wire logs enabled.
In order to read the wire logs, you must first identify message direction.
| DEBUG - wire >> | Represents the message coming into the API Gateway from the wire. |
| DEBUG - wire << | Represents the message that goes to the wire from the API Gateway. |
In a single roundtrip of a API request/response, you can observe following message flows via the wire log.
- Incoming request to API gateway from API client (>>).
- Outgoing request from API gateway to actual backend (<<).
- Incoming response from actual backend to API gateway (>>).
- Outgoing response from API gateway to API client (<<).
Following is a sample of gateway wire log for an API request.
[2019-12-12 17:30:08,091] DEBUG - wire HTTPS-Listener I/O dispatcher-5 >> "GET /helloWorld/1.0.0 HTTP/1.1[\r][\n]"
[2019-12-12 17:30:08,093] DEBUG - wire HTTPS-Listener I/O dispatcher-5 >> "Host: localhost:8243[\r][\n]"
[2019-12-12 17:30:08,094] DEBUG - wire HTTPS-Listener I/O dispatcher-5 >> "User-Agent: curl/7.54.0[\r][\n]"
[2019-12-12 17:30:08,095] DEBUG - wire HTTPS-Listener I/O dispatcher-5 >> "accept: */*[\r][\n]"
[2019-12-12 17:30:08,096] DEBUG - wire HTTPS-Listener I/O dispatcher-5 >> "Authorization: Bearer 07f6b26d-0f8d-312a-8d38-797e054566cd[\r][\n]"
[2019-12-12 17:30:08,097] DEBUG - wire HTTPS-Listener I/O dispatcher-5 >> "[\r][\n]"
[2019-12-12 17:30:08,105] DEBUG - wire HTTP-Sender I/O dispatcher-1 << "GET /v2/5df22aa131000084009a30a9 HTTP/1.1[\r][\n]"
[2019-12-12 17:30:08,106] DEBUG - wire HTTP-Sender I/O dispatcher-1 << "accept: */*[\r][\n]"
[2019-12-12 17:30:08,107] DEBUG - wire HTTP-Sender I/O dispatcher-1 << "Host: www.mocky.io[\r][\n]"
[2019-12-12 17:30:08,108] DEBUG - wire HTTP-Sender I/O dispatcher-1 << "Connection: Keep-Alive[\r][\n]"
[2019-12-12 17:30:08,109] DEBUG - wire HTTP-Sender I/O dispatcher-1 << "User-Agent: Synapse-PT-HttpComponents-NIO[\r][\n]"
[2019-12-12 17:30:08,110] DEBUG - wire HTTP-Sender I/O dispatcher-1 << "[\r][\n]"
[2019-12-12 17:30:08,266] DEBUG - wire HTTP-Sender I/O dispatcher-1 >> "HTTP/1.1 200 OK[\r][\n]"
[2019-12-12 17:30:08,268] DEBUG - wire HTTP-Sender I/O dispatcher-1 >> "Server: Cowboy[\r][\n]"
[2019-12-12 17:30:08,269] DEBUG - wire HTTP-Sender I/O dispatcher-1 >> "Connection: keep-alive[\r][\n]"
[2019-12-12 17:30:08,271] DEBUG - wire HTTP-Sender I/O dispatcher-1 >> "Date: Thu, 12 Dec 2019 12:00:08 GMT[\r][\n]"
[2019-12-12 17:30:08,272] DEBUG - wire HTTP-Sender I/O dispatcher-1 >> "Content-Type: application/json[\r][\n]"
[2019-12-12 17:30:08,273] DEBUG - wire HTTP-Sender I/O dispatcher-1 >> "Content-Length: 20[\r][\n]"
[2019-12-12 17:30:08,274] DEBUG - wire HTTP-Sender I/O dispatcher-1 >> "Via: 1.1 vegur[\r][\n]"
[2019-12-12 17:30:08,275] DEBUG - wire HTTP-Sender I/O dispatcher-1 >> "[\r][\n]"
[2019-12-12 17:30:08,276] DEBUG - wire HTTP-Sender I/O dispatcher-1 >> "{ "hello": "world" }"
[2019-12-12 17:30:08,282] DEBUG - wire HTTPS-Listener I/O dispatcher-5 << "HTTP/1.1 200 OK[\r][\n]"
[2019-12-12 17:30:08,283] DEBUG - wire HTTPS-Listener I/O dispatcher-5 << "Access-Control-Expose-Headers: [\r][\n]"
[2019-12-12 17:30:08,284] DEBUG - wire HTTPS-Listener I/O dispatcher-5 << "Access-Control-Allow-Origin: *[\r][\n]"
[2019-12-12 17:30:08,285] DEBUG - wire HTTPS-Listener I/O dispatcher-5 << "Access-Control-Allow-Methods: GET[\r][\n]"
[2019-12-12 17:30:08,286] DEBUG - wire HTTPS-Listener I/O dispatcher-5 << "Access-Control-Allow-Headers: authorization,Access-Control-Allow-Origin,Content-Type,SOAPAction,Authorization[\r][\n]"
[2019-12-12 17:30:08,287] DEBUG - wire HTTPS-Listener I/O dispatcher-5 << "Content-Type: application/json[\r][\n]"
[2019-12-12 17:30:08,287] DEBUG - wire HTTPS-Listener I/O dispatcher-5 << "Via: 1.1 vegur[\r][\n]"
[2019-12-12 17:30:08,288] DEBUG - wire HTTPS-Listener I/O dispatcher-5 << "Date: Thu, 12 Dec 2019 12:00:08 GMT[\r][\n]"
[2019-12-12 17:30:08,289] DEBUG - wire HTTPS-Listener I/O dispatcher-5 << "Transfer-Encoding: chunked[\r][\n]"
[2019-12-12 17:30:08,290] DEBUG - wire HTTPS-Listener I/O dispatcher-5 << "[\r][\n]"
[2019-12-12 17:30:08,290] DEBUG - wire HTTPS-Listener I/O dispatcher-5 << "14[\r][\n]"
[2019-12-12 17:30:08,291] DEBUG - wire HTTPS-Listener I/O dispatcher-5 << "{ "hello": "world" }[\r][\n]"
[2019-12-12 17:30:08,292] DEBUG - wire HTTPS-Listener I/O dispatcher-5 << "0[\r][\n]"
[2019-12-12 17:30:08,293] DEBUG - wire HTTPS-Listener I/O dispatcher-5 << "[\r][\n]"
Enable Gateway wire logs
- Open
APIM_HOME>/repository/conf/log4j2.propertiesfile. -
To enable Gateway Wire Logs, locate the pre-defined
synapse-wirelogger in the defaultlog4j2.propertiesfile and uncomment the following lines:logger.synapse-wire.name = org.apache.synapse.transport.http.wire logger.synapse-wire.level = DEBUGTo log only request and response headers, uncomment the
synapse-headerslogger in the defaultlog4j2.propertiesfile:logger.synapse-headers.name = org.apache.synapse.transport.http.headers logger.synapse-headers.level = DEBUG -
Append the
synapse-wirelogger name tologgersconfiguration which is a comma separated list of all active loggers.loggers = synapse-wire, trace-messages, org-apache-coyote,com-hazelcastIf you want to activate the wire logs only for message headers, you can activate
synapse-headerslogger.
4. Observe the logs for incoming and outgoing traffic inloggers = synapse-headers, trace-messages, org-apache-coyote,com-hazelcast<APIM_HOME>/repository/logs/wso2carbon.logfile.
Limitation
If synapse-wire logs are enabled during high load, outgoing traffic between the gateway and the backend will not be printed in the wso2carbon.log file. This happens when the backend connection is keep alive. As we are maintaining connections in a connection pool, the same connections will be reused in keep alive mode irrespective of the changes done in the log4j2.properties file.
HTTP Access Logs
HTTP requests/responses are logged in access logs to monitor the activities related to an application's usage. Please see Monitoring HTTP Access Logs for instructions on how to configure and use HTTP access logs in WSO2 API Manager.
Audit Logs
Audit logs are used for tracking the sequence of actions that affect a particular task carried out on the server. Please see Monitoring Audit Logs for instructions on how to configure and use audit logs in WSO2 API Manager.
Top