Configuring Alerts
WSO2 API Manager analytics-based alerts are disabled by default. Once you enable alerts, you can customize and configure the analytics-based alerts using the features listed below.
- Configure sender email alerts
- Configure alerts as business rules
- Configure alerts via the Publisher
- Configure alerts via the Developer Portal
Once you have configured alerts, you can subscribe to alerts to receive email notifications. For instructions, see Subscribing for Alerts.
Note
Before you begin, make sure that you have configured Analytics for API Manager. For instructions, see Configuring APIM Analytics.
Enable alerts
WSO2 API Manager analytics-based alerts are disabled by default. Follow the instructions below to enable alerts.
- Shut down the analytics server if it is running.
- Open the
<API-M_ANALYTICS_HOME>/conf/worker/deployment.yamlfile. - Uncomment the following configuration.
analytics.solutions: APIM-alerts.enabled: true -
Go to the
<API-M_ANALYTICS_HOME>/bindirectory and run the following command to start the worker, to deploy the alerts Siddhi applications.- On Windows:
worker.bat --run - On Linux:
sh worker.sh
- On Windows:
Configure sender email alerts
Note
- If you do not require to subscribe to email notifications for alerts, you can skip these steps.
- Admin users can view analytics in the Admin Portal (
https://<API-M_HOST>:<API-M_PORT>/admin) without configuring the sender email address.
The users of your APIs can subscribe to analytics-related alerts from the API Publisher and the API Developer Portal. Follow the instructions below to configure an email address with WSO2 API Manager to send email alerts to subscribers.
- Open the
<API-M_ANALYTICS_HOME>/conf/worker/deployment.yamlfile. - Navigate to the
extensionsconfiguration undersiddhiconfigurations. -
Add a new extension to configure the sender email address.
The sample code is shown below.
-
If you are using Gmail as the SMTP host.
siddhi: extensions: ... - extension: name: email namespace: sink properties: username: [email protected] address: [email protected] password: password ... -
If you are using an SMTP host other than Gmail.
siddhi:
extensions:
...
    -
    extension:
        name: email
        namespace: sink
        properties:
        username: <senders-email-username>
        address: <senders-email-address>
        password: <senders-email-password>
        mail.smtp.host: <senders-email-host>
        port: 25
        ssl.enable : false
        auth : false
        mail.store.protocol: pop3
...
For more details on the email sender configurations, see the Siddhi IO Email configurations in the official Siddhi documentation.
Warning
Note that you might have to bypass a security warning to configure this with a private email address.
-
-
Go to the
<API-M_ANALYTICS_HOME>/resources/apim-analytics/directory. Copy theAPIM_ALERT_EMAIL_NOTIFICATION.siddhifile and paste it in the<API-M_ANALYTICS_HOME>/wso2/worker/deployment/siddhi-filesdirectory. - Restart the servers.
Configure alerts as business rules
You can configure alerts as a business rule by using the features listed below.
- View deployment information of alerts
- View alerts configuration
- Edit alerts configuration
- Delete alerts configuration
- Undeploy alerts configuration
Note
Before you begin, make sure that the worker instance of the Analytics server is running.
-
Open the
<API-M_ANALYTICS_HOME>/conf/dashboard/deployment.yamlfile and do the following.Point the business rules manager to the worker node by configuring the
deployment_configsofwso2.business.rules.manageras shown below.wso2.business.rules.manager: datasource: BUSINESS_RULES_DB # rule template wise configuration for deploying business rules deployment_configs: - # <IP>:<HTTPS Port> of the Worker node <API-M_ANALYTICS_WORKER_HOST>:<API-M_ANALYTICS_WORKER_PORT> ... -
Go to the
<API-M_ANALYTICS_HOME>/bindirectory and run the following command to start the dashboard.- On Windows:
dashboard.bat --run - On Linux:
sh dashboard.sh
- On Windows:
-
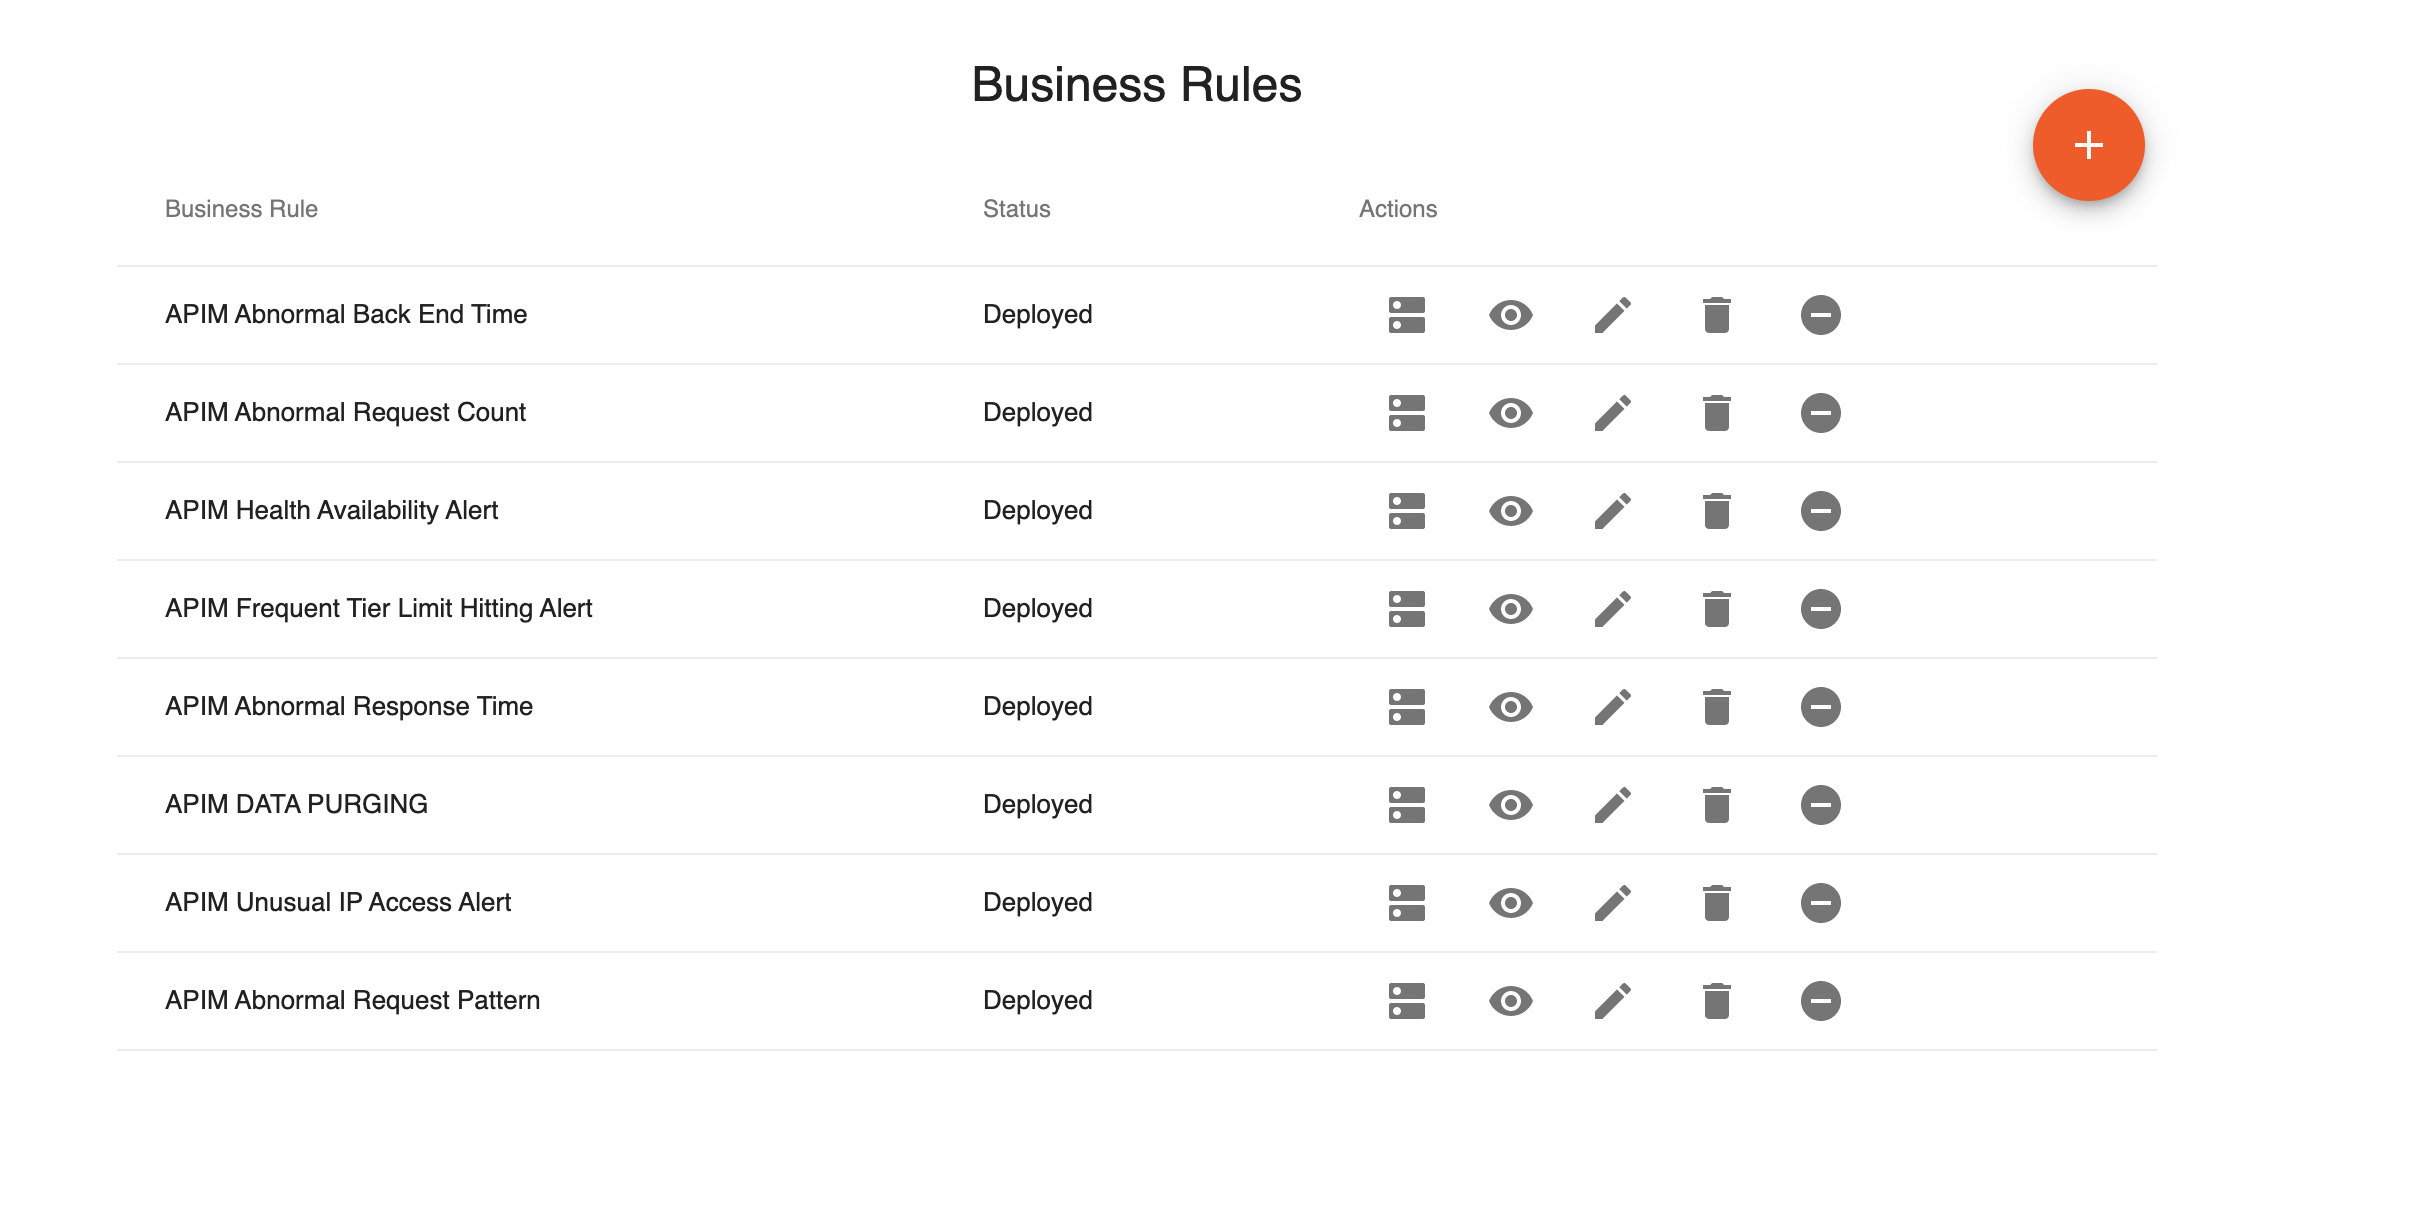
Sign in to the Business Rules. (e.g.,
https://<API-M_ANALYTICS_HOST>:9643/business-rules) - You can view the existing business rules that are applied for WSO2 API Manager. Depending on your privileges, you can view, edit, and delete business rules.
For more details on working with business rules, see Managing Business Rules.
Configure alerts via the Publisher
Follow the instructions below to manage alerts via the Publisher:
Info
You can not disable Health Availability related alerts, because they are enabled by default. However, you can enable and disable the email alerts that correspond to the Health Availability alerts.
Create an abnormal response time alert
- Sign in to the API Publisher with the username and password of a user with the required permission.
-
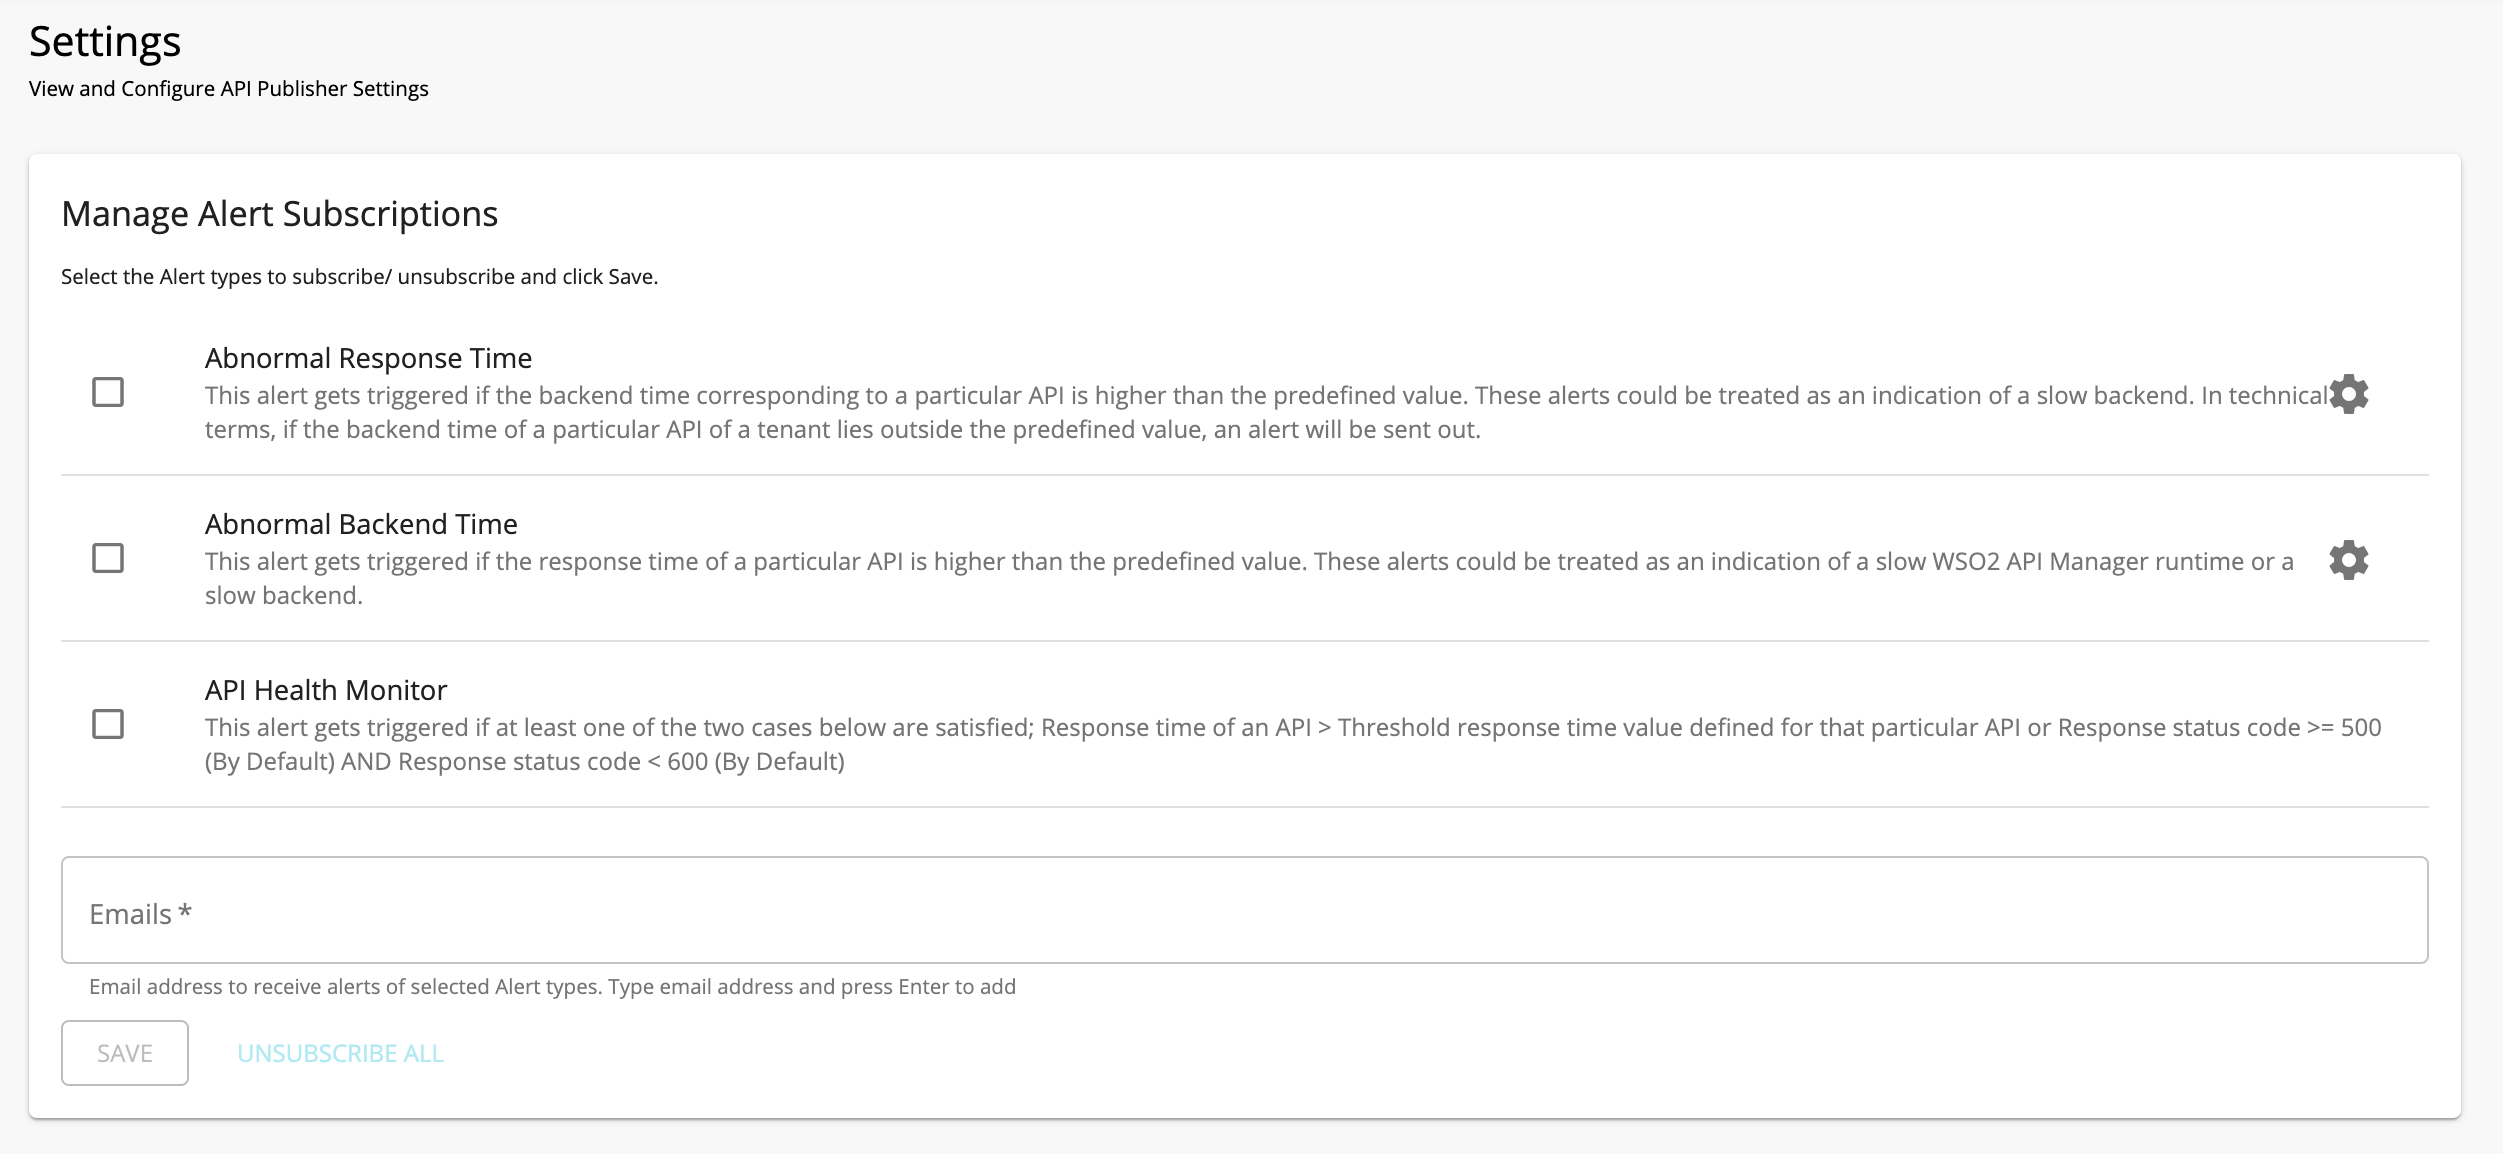
Click on the SETTINGS menu, to open the Manage Alert Subscriptions page.
-
Click on the Configuration option that corresponds to the Abnormal Response Time option.

-
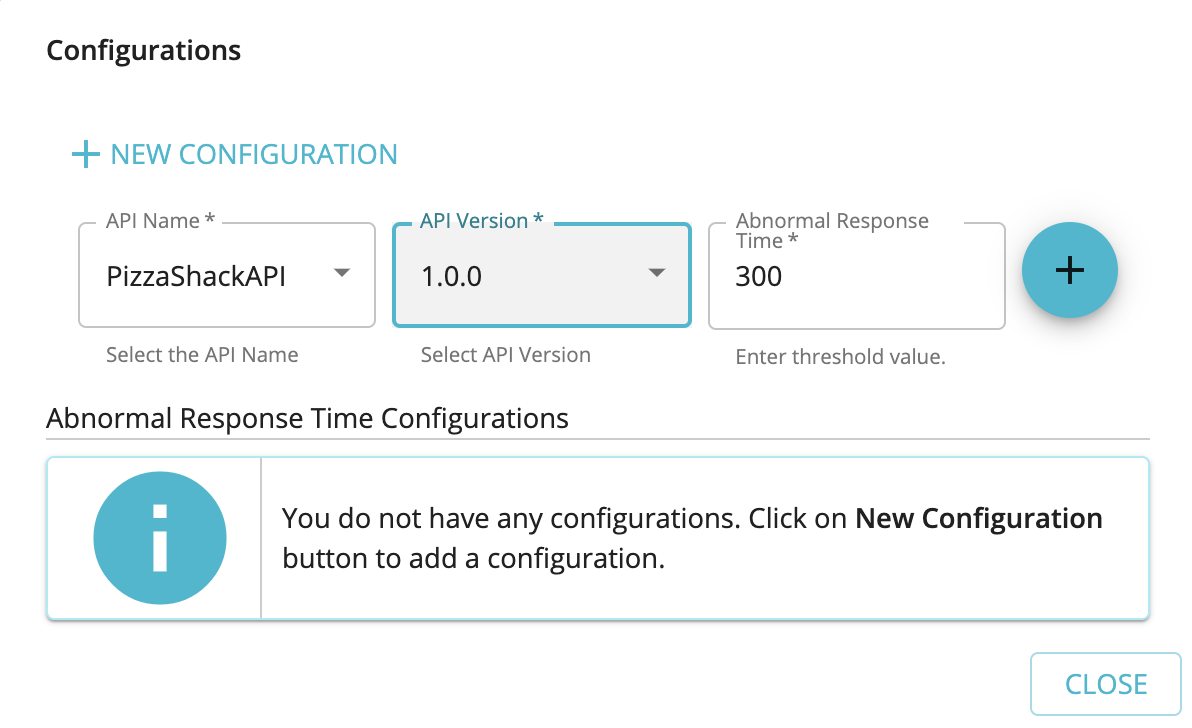
Click New Configuration to add a new configuration

-
Select the API name and version for which you need to set up the alerts and define the time period (in milliseconds).
-
Click on Add to save the alert configuration

Immediately after the response period of the API exceeds the above defined time period an alert gets triggered, such alerts could be treated as an indication of a slow WSO2 API Manager runtime or a slow backend.
Create an abnormal backend time alert
- Sign in to the API Publisher with the username and password of a user with the required permission.
-
Click on the SETTINGS menu, to open the Manage Alert Subscriptions page.
-
Click on the Configuration option that corresponds to the Abnormal Backend Time option.
-
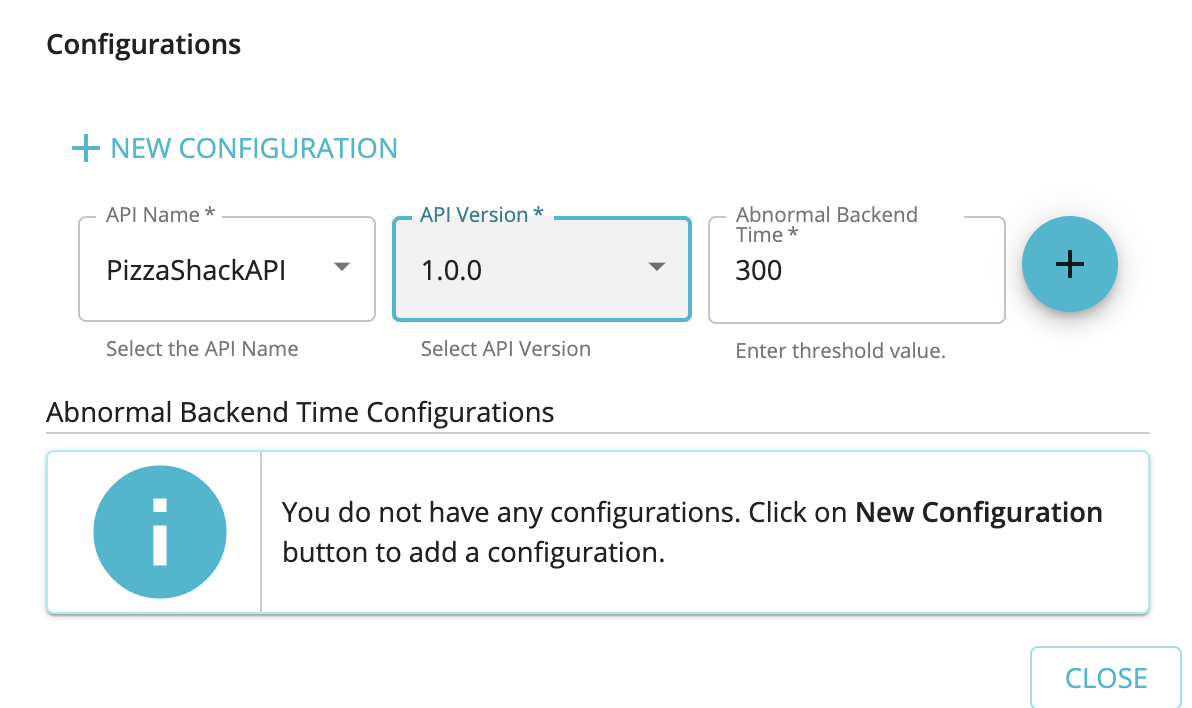
Click New Configuration to add a new configuration

-
Select the API name and version for which you need to set up the alerts and define the time period (in milliseconds).
-
Click on Add to save the alert configuration
Immediately after the backend time of the API exceeds the above defined time period an alert gets triggered, such alerts could be treated as an indication of a slow backend. In technical terms, if the backend time of a particular API of a tenant lies outside the predefined value, an alert is sent.
Configure alerts via the Developer Portal
Follow the instructions below to manage alert types via the Developer Portal:
Info
You can not disable Abnormal Resource Access Alerts, Unseen Source IP Access Alerts and Tier Crossing Alerts, because they are enabled by default. However, you can enable and disable the email alerts that correspond to the latter mentioned alerts.
Create an abnormal requests per minute alert
- Sign in to the API Developer Portal with the username and password of a user with the required permission.
-
Click on the SETTINGS menu, to open the Manage Alert Subscriptions page.
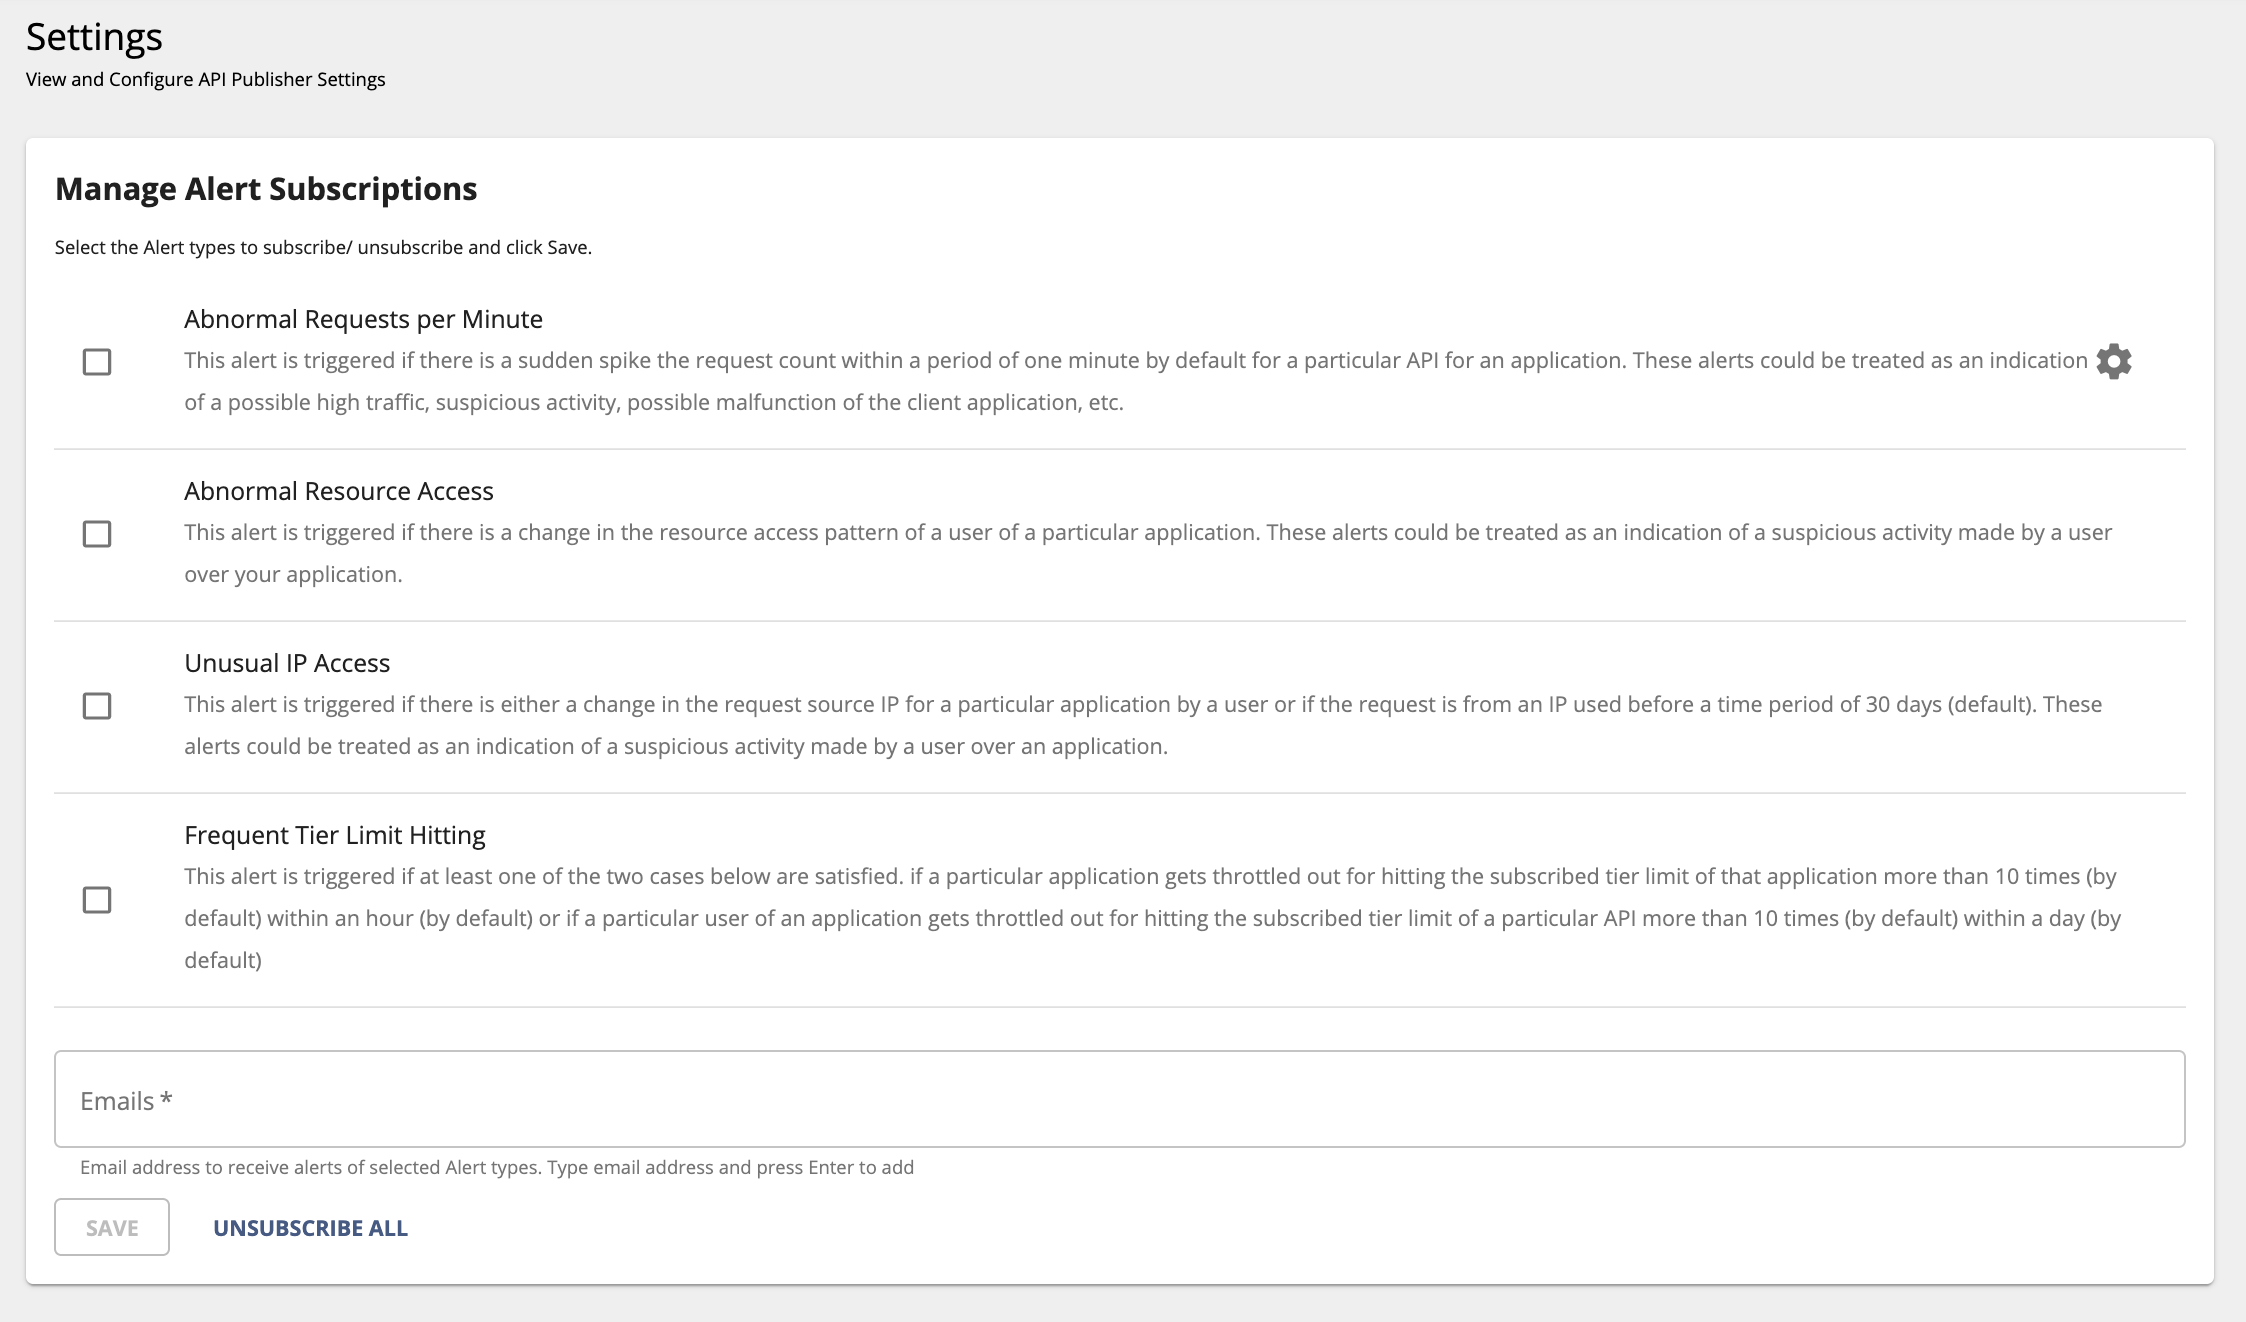
-
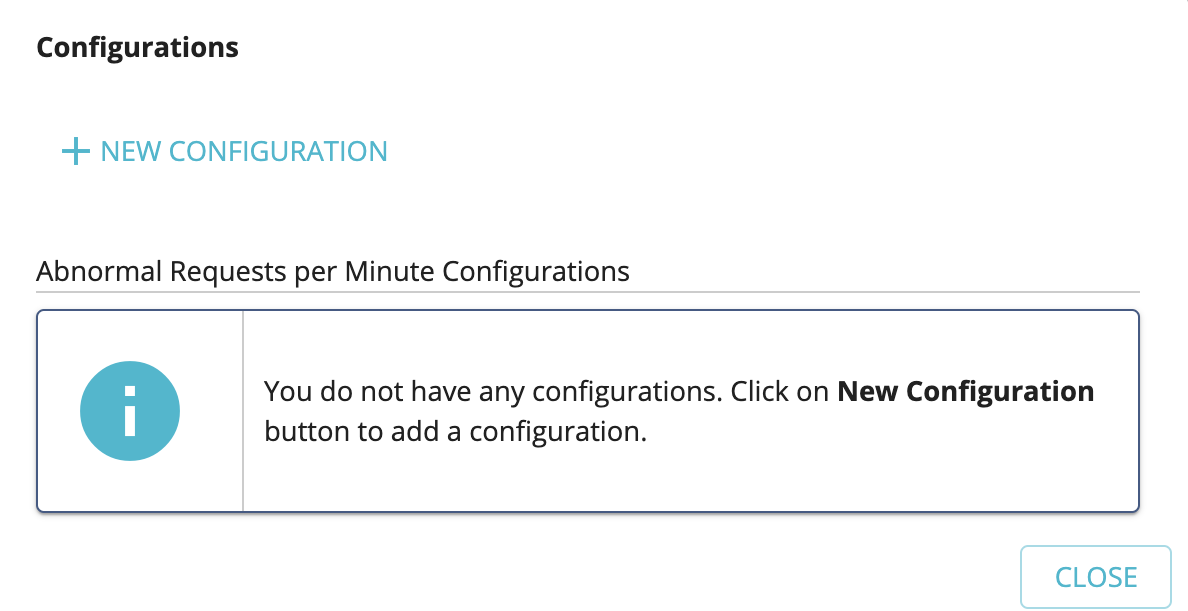
Click on the Configuration option that corresponds to the Abnormal Requests per Minute option.
-
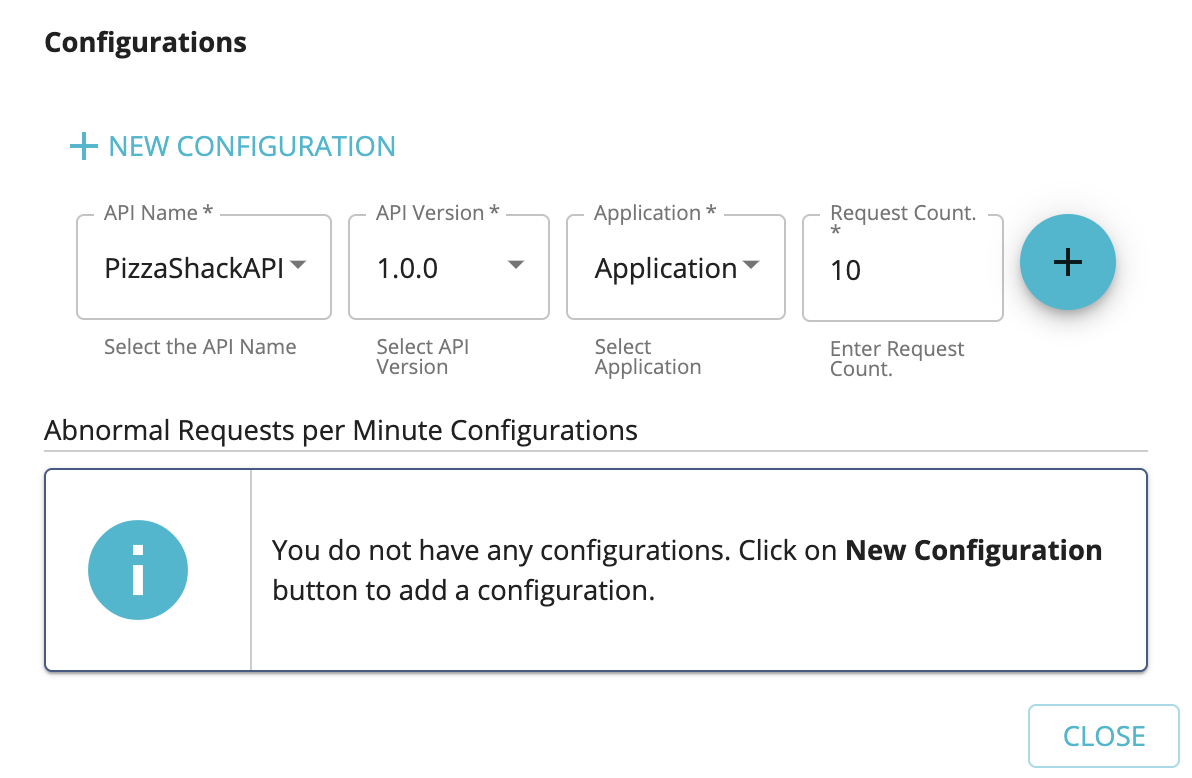
Click New Configuration to add a new configuration.
-
Select the API name and version for which you need to set up the alerts and define the request count per minute.
-
Click on Add to save the alert configuration
Immediately after the request count of the API exceeds the above-defined request count per minute an alert gets triggered. These alerts could be treated as indications of possible high traffic, suspicious activity, possible malfunction of the client application etc.
Top