Integrating with Google Analytics
You can configure the API Manager to track runtime statistics of API invocations through Google Analytics. Google Analytics is a service that allows you to track visits to a website and generate detailed statistics on them.
This guide explains how to setup API Manager in order to feed runtime statistics to Google analytics for summarization and display.
- Setup a Google Analytics account if not subscribed already and receive a Tracking ID, which is of the format "UA-XXXXXXXX-X". A Tracking ID is issued at the time an account is created with Google Analytics.
-
Log in to the API Manager management console (
https://localhost:9443/carbon) using admin/admin credentials and go to Main -> Resources -> Browse menu.
-
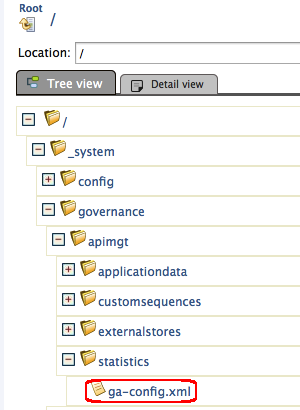
Navigate to /_system/governance/apimgt/statistics/ga-config.xml file.
-
Change the <Enabled> element to
true, set your tracking ID in <TrackingID> element and Save.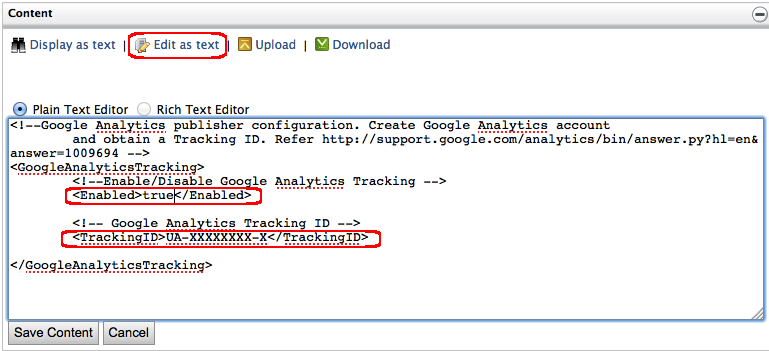
-
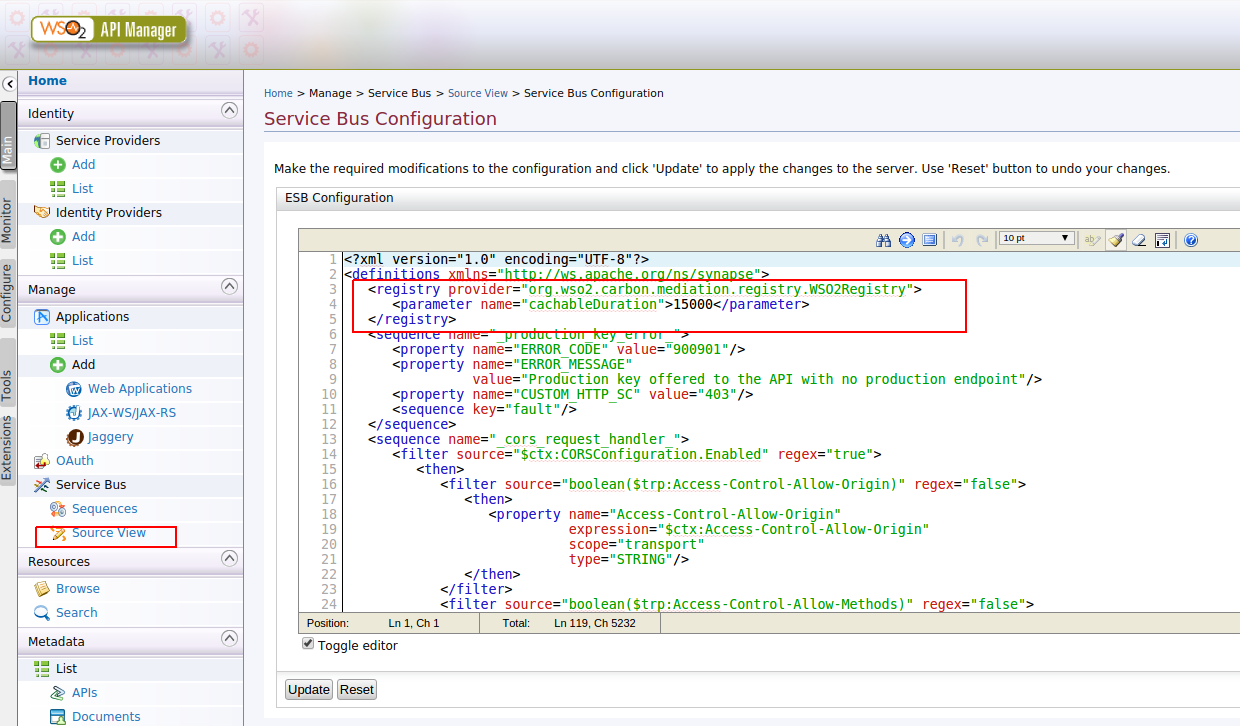
If you want to enable tracking for tenants, log in to the management console with a tenant's credentials, click Source View, and then add the following parameter to the
org.wso2.carbon.mediation.registry.WSO2Registryregistry definition near the top (repeat this step for each tenant):<parameter name="cachableDuration">15000</parameter>The following screen shot illustrates this change:
-
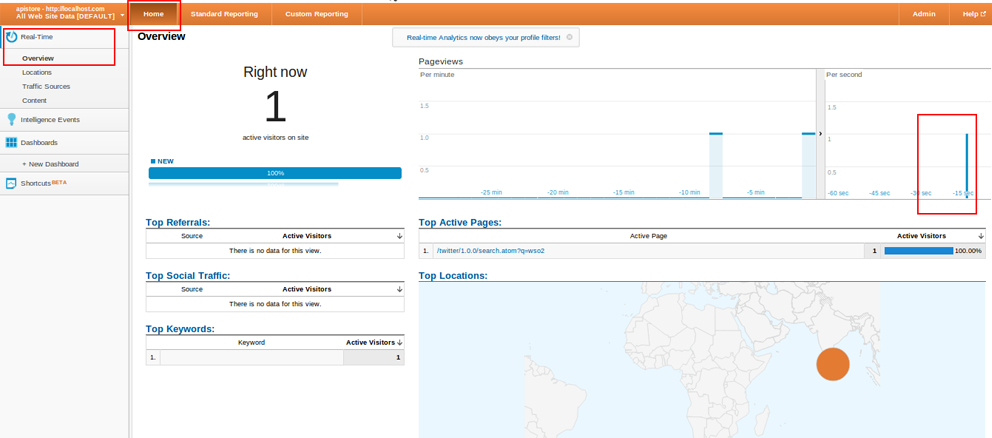
API Manager is now integrated with Google Analytics. A user who has subscribed to a published API through the Developer Portal should see an icon as
Real-Timeafter logging into their Google Analytics account. Click on this icon and select Overview. -
Invoke the above API using the embedded WSO2 REST Client(or any third-part rest client such as cURL).
Real-time statistics
-
This is one invocation of the API. Accordingly, Google Analytics graphs and statistics will be displayed at runtime. This example displays the PageViews per second graph and 1 user as active.
Report statistics
Google analytics reporting statistics take more than 24 hours from the time of invocation to populate. Shown below is a sample Dashboard with populated statistics.
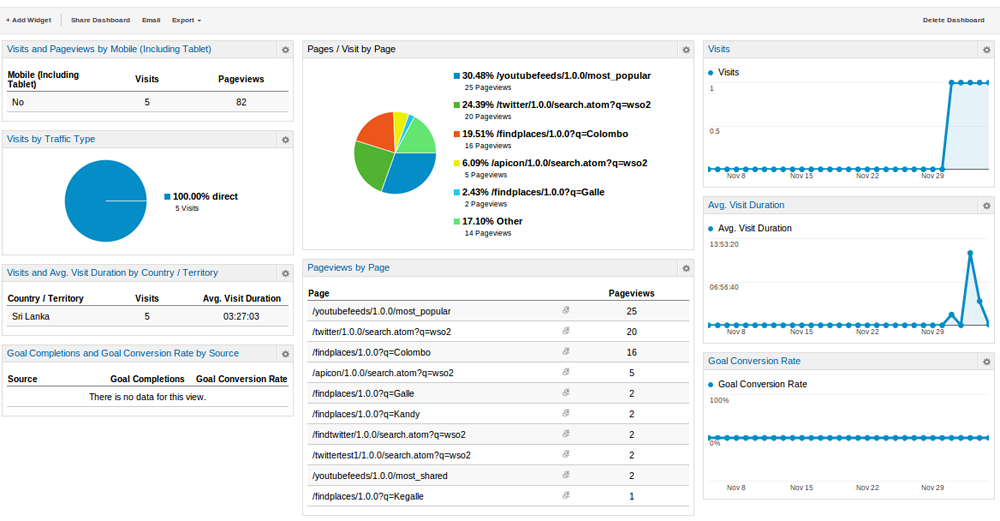
There are widgets with statistics related to Audience, Traffic, Page Content, Visit Duration etc. You can add any widget of your preference to dashboard.