Monitoring with Prometheus
Prometheus is an open source toolkit that can monitor systems and produce useful information such as graphs and alerts. It collects statistical data exposed over an HTTP endpoint in the form of multi dimensional time series data, which can be then be visualized and queried. See the Prometheus documentation for more information.
Overview
WSO2 API Manager exposes its statistical data through JMX as MBeans. To monitor these metrics using Prometheus, the Prometheus JMX Exporter is configured as a Java agent during APIM startup. This exporter reads the JMX MBeans and converts them to the Prometheus format. The converted metrics are then exposed through an HTTP endpoint, which is used by Prometheus to scrape the statistical data.
Configuring the Prometheus server
- Download and install Prometheus.
-
Open the
PROMETHEUS_HOME/prometheus.ymlfile. Add a scrape config with a preferred job name (ex: apim_stats) to this file as shown below. The port number and the endpoint name should be as specified below. -
Save the configuration file.
Starting the Prometheus server
To start the Prometheus server, navigate to the PROMETHEUS_HOME and execute the start-up script located there. For Linux distributions the command is as follows.
Configuring the API-Manager
-
To use Prometheus, you need to create a YAML file (e.g. wso2config.yaml) with the following content and save it. The path to the file will be used in the configurations as described in the later steps.
-
Download the JMX exporter’s JAR
jmx_prometheus_javaagent-1.3.0.jar. -
Add the following line under $JAVA_VER_BASED_OPTS of the
<APIM_HOME>/bin/api-manager.shfile. Please note the port given below (1234) which will be used to expose the JMX Mbeans via the Prometheus server as the /metrics endpoint. -
Start the WSO2 API-Manager server as usual.
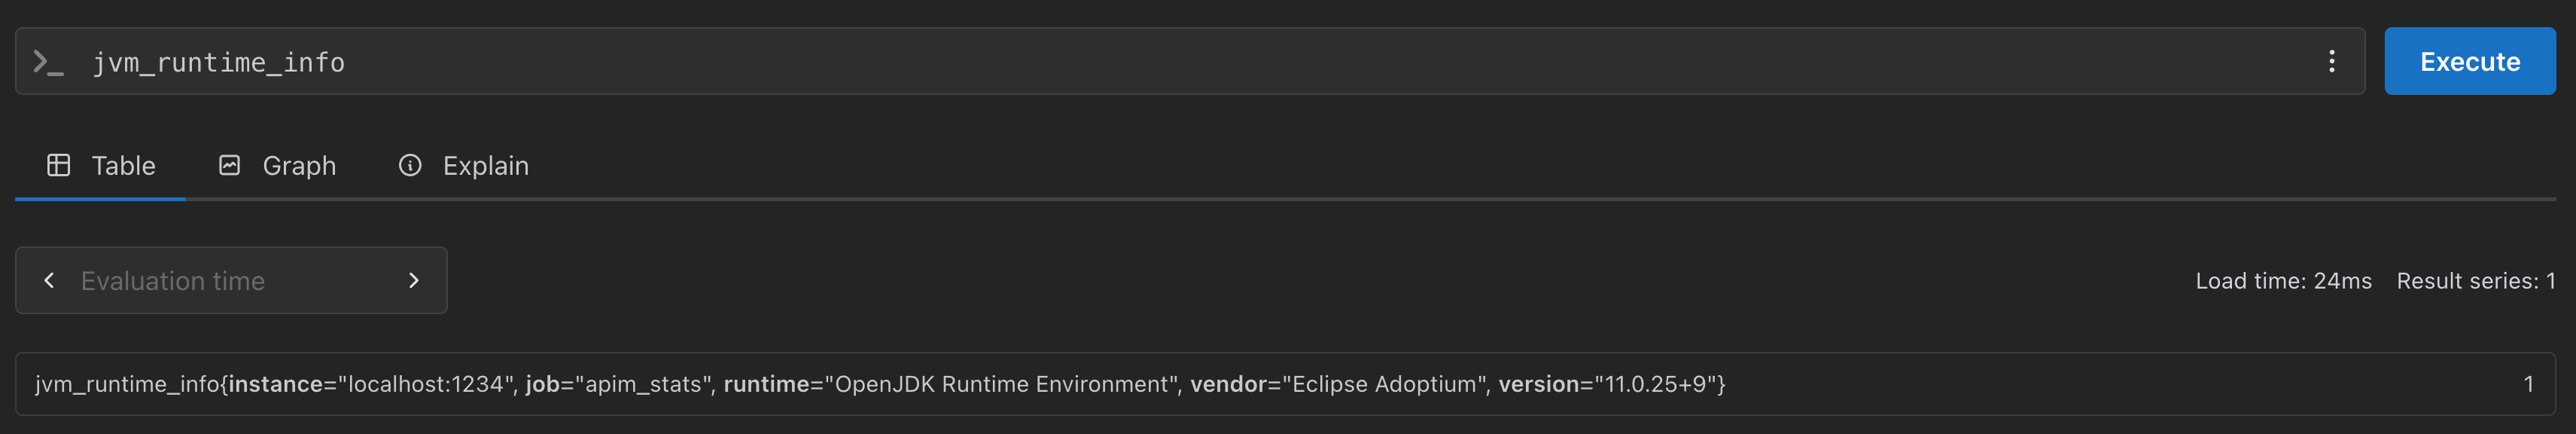
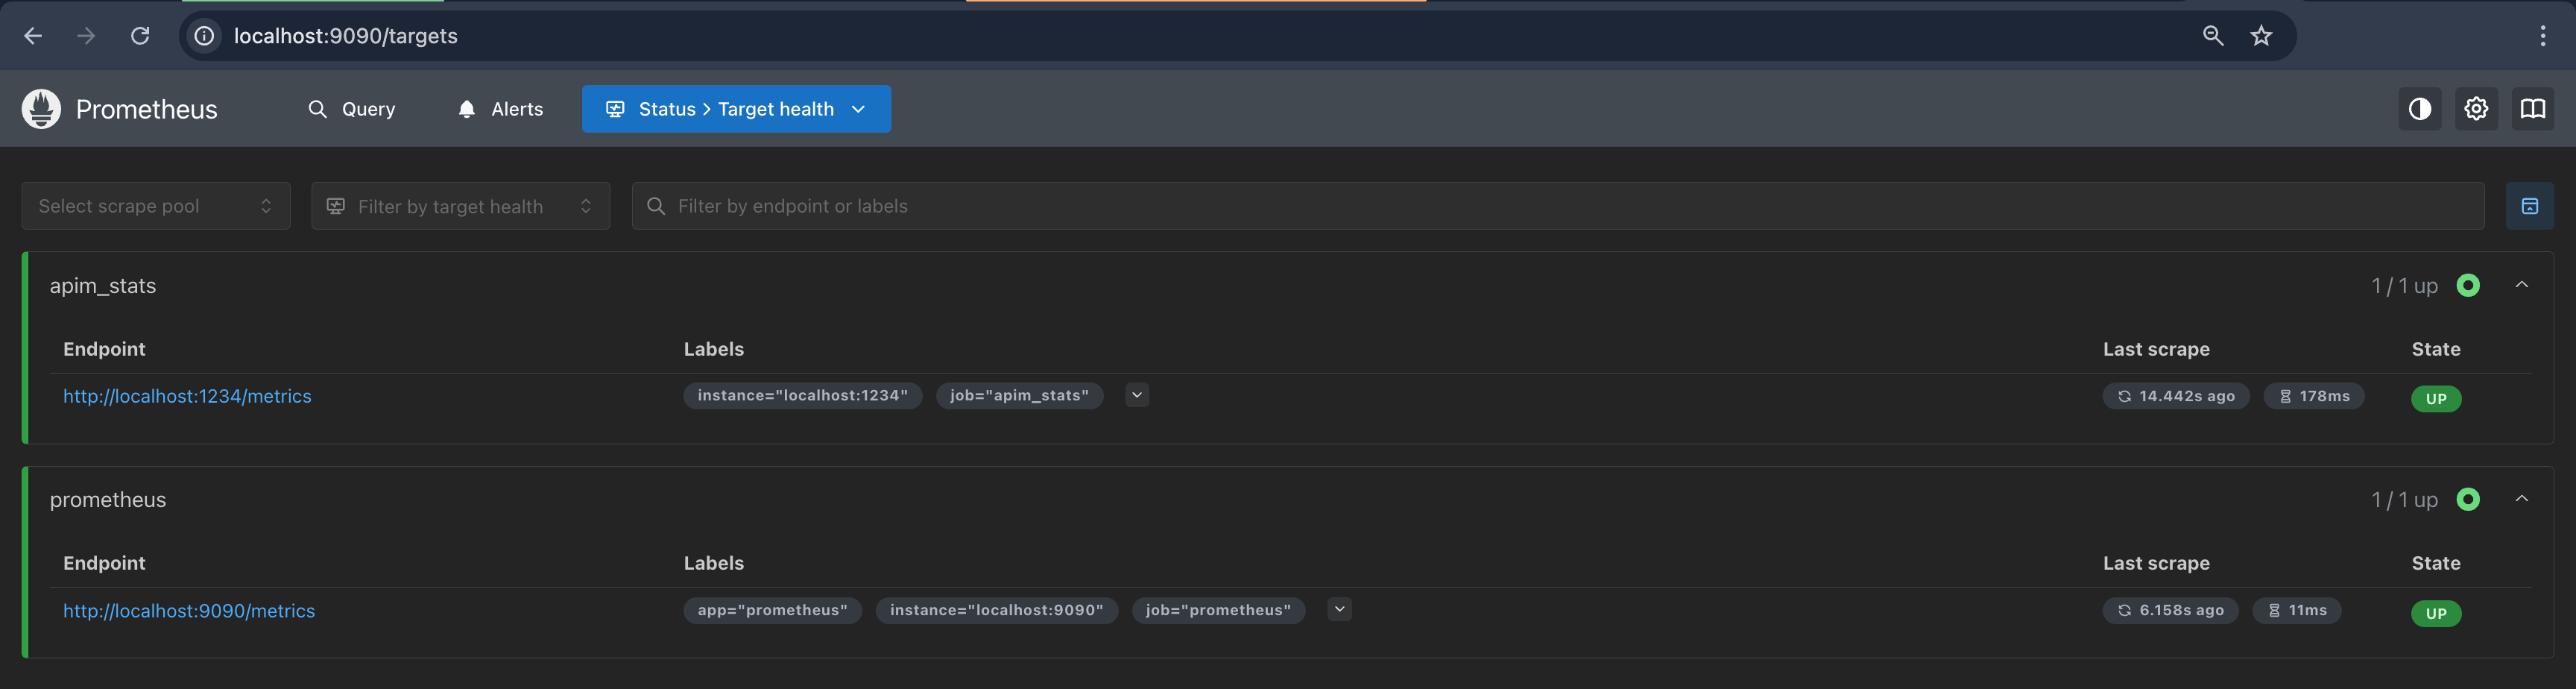
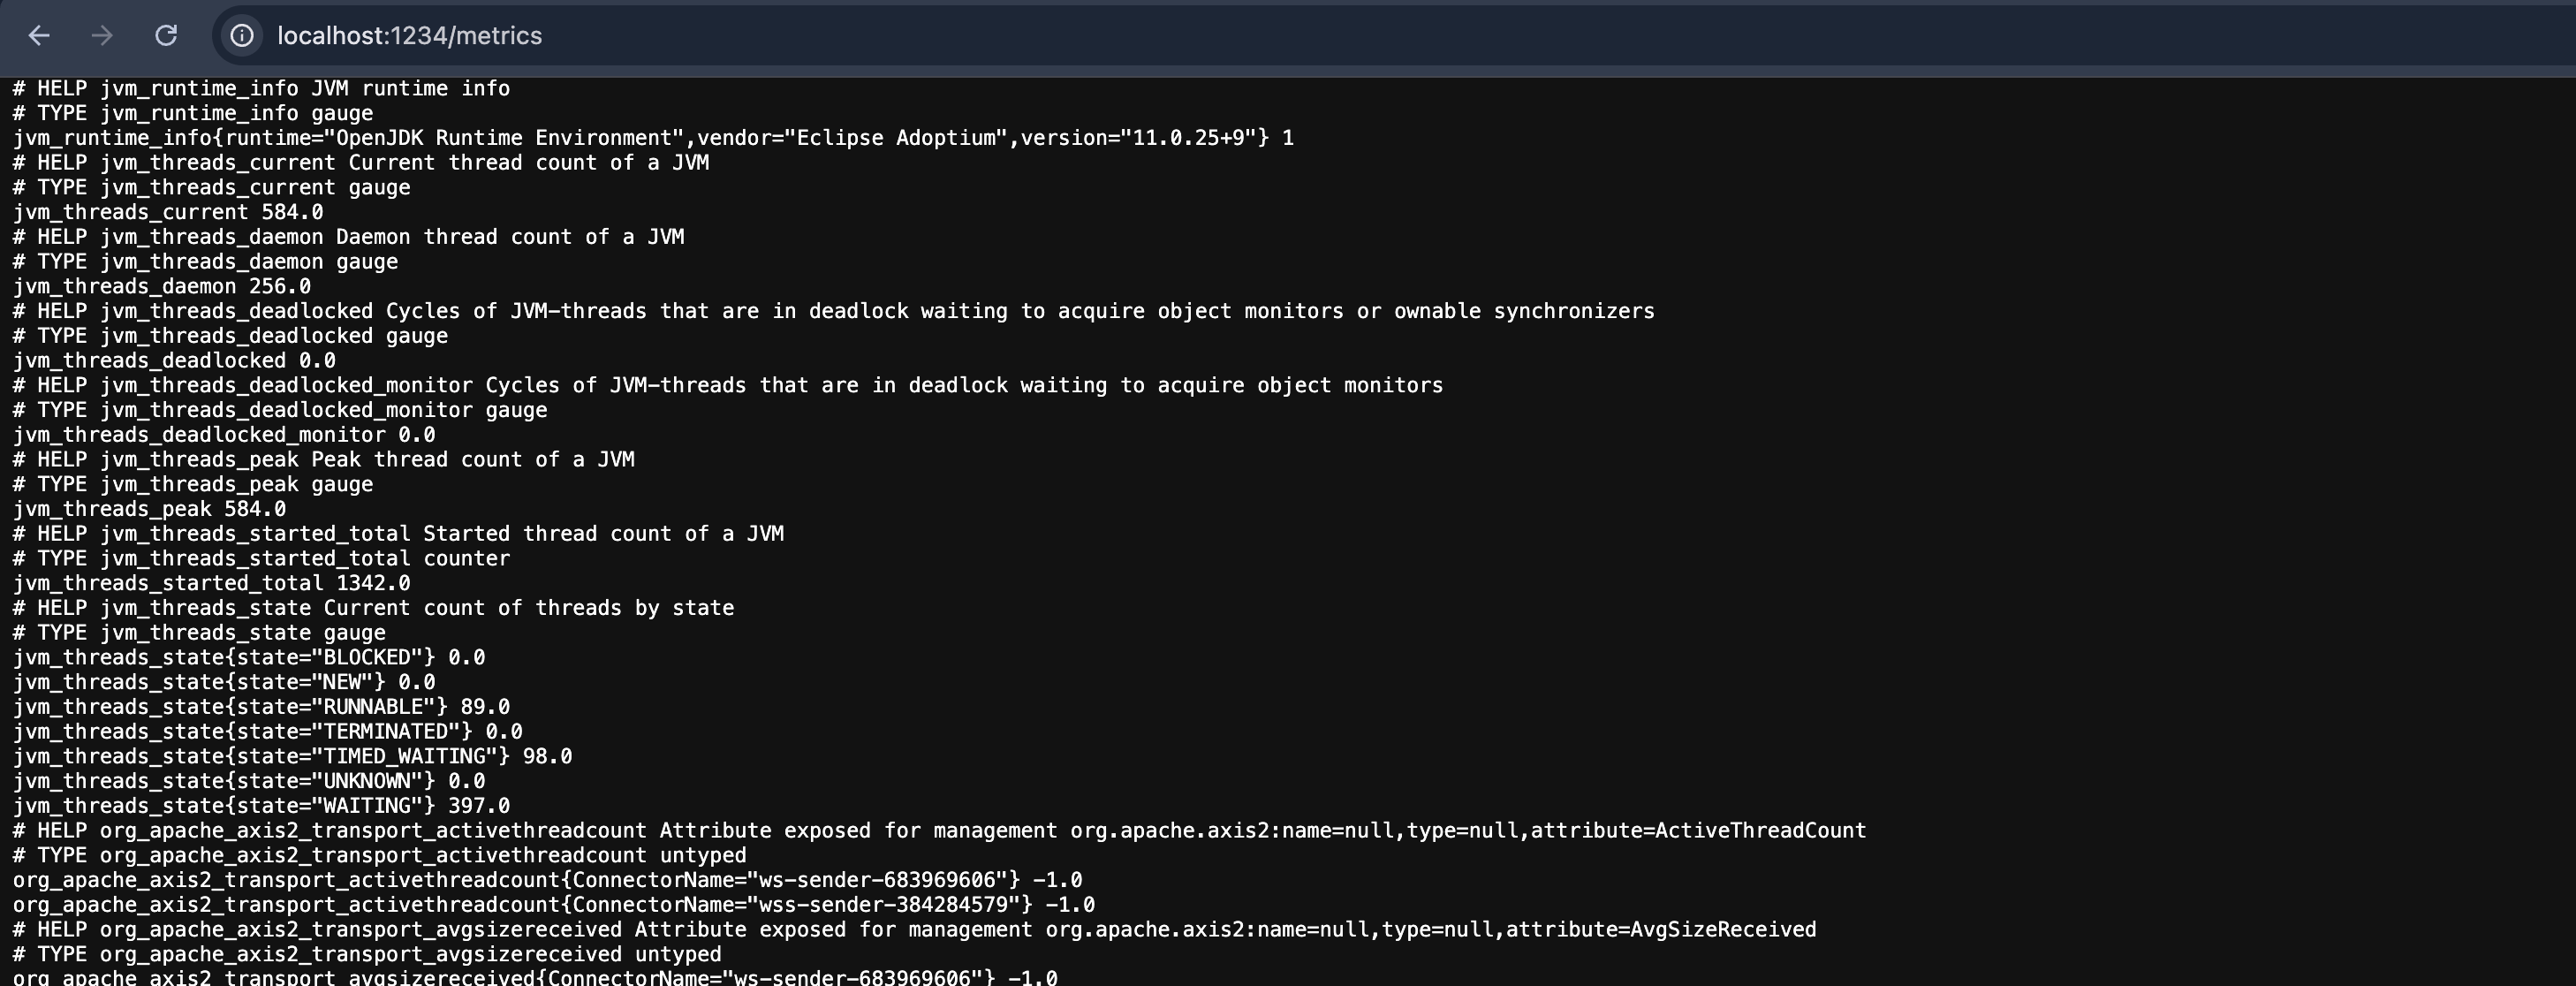
Once the above steps are completed you would be able to observe the above targets through the Prometheus console (http://localhost:9090/targets) as follows and the /metrics endpoint (http://localhost:1234/metrics) will also be accessible.
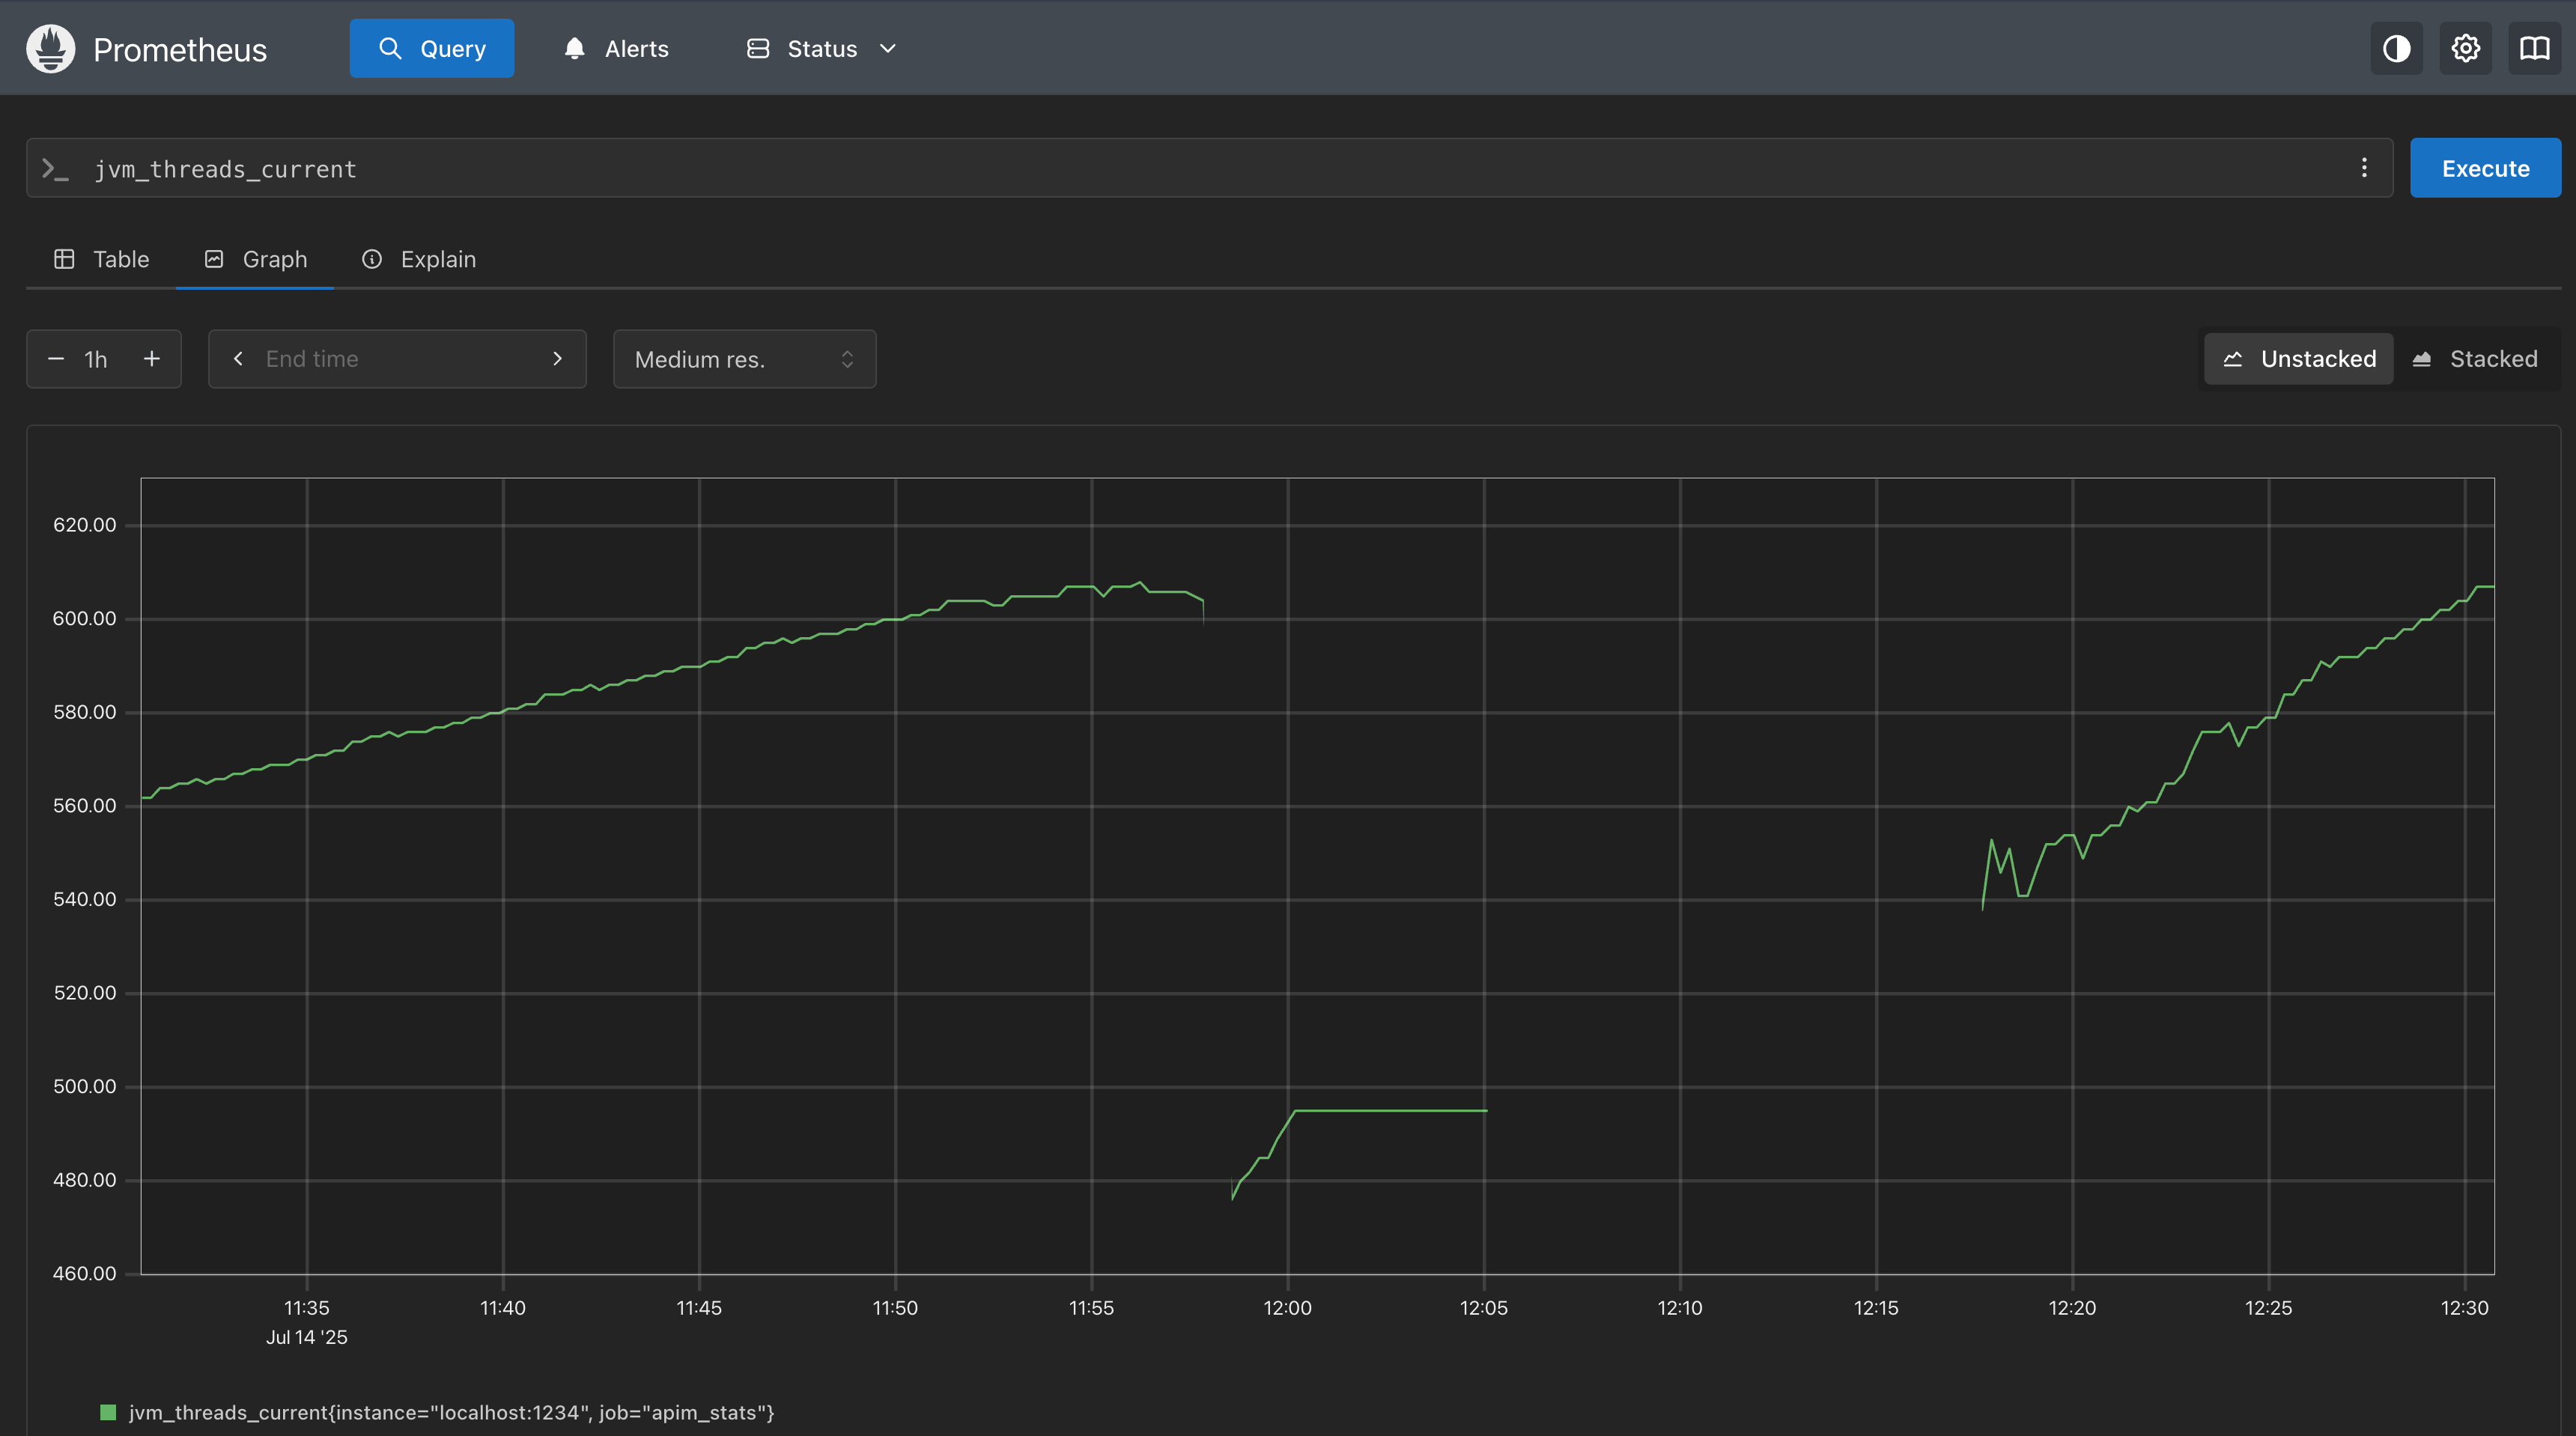
Viewing statistics
You may also visit the following url in Prometheus server to plot the graphs.