Setting up Cloud Native Observability on a VM
Follow the instructions given below to set up a cloud native observability solution for your Micro Integrator (MI) deployment in a VM environment.
You need to start with the minimum deployment, which enables metric monitoring. Once you have set up the minimum deployment, you can add log processing and message tracing capabilities to your solution.
Step 1 - Set up the minimum deployment
The minimum cloud native observability deployment requires Prometheus and Grafana. The Micro Integrator uses Prometheus to expose its statistics to Grafana. Grafana is used to visualize the statistics.
Step 1.1 - Set up Prometheus
Follow the instructions below to set up the Prometheus server:
-
Download Prometheus from the Prometheus site.
Tip
Select the appropriate operating system and the architecture based on your operating system and requirements.
-
Extract the downloaded file and navigate to that directory.
Info
This directory is referred to as
<PROMETHEUS_HOME>from hereon. -
Open the
<PROMETHEUS_HOME>/prometheus.ymlfile, and in thescrape_configssection, add a configuration as follows:global: scrape_interval: 15s evaluation_interval: 15s scrape_configs: - job_name: 'prometheus' static_configs: - targets: ['localhost:9090'] - job_name: esb_stats metrics_path: /metric-service/metrics static_configs: - targets: ['localhost:9201']Note
- Do not add or remove spaces when you copy the above configuration to the
prometheus.ymalfile. - In the
targetssection, you need to add your IP address and the port in which you are running the Micro Integrator server.
- Do not add or remove spaces when you copy the above configuration to the
-
To start the Prometheus server, open a terminal, navigate to
<PROMETHEUS_HOME>, and execute the following command:./prometheusWhen the Prometheus server is successfully started, you will see the following log:
Server is ready to receive web requests.
Step 1.2 - Set up Grafana
Follow the instructions below to set up the Grafana server:
-
Download and install Grafana.
Tip
Follow the instructions (for your operating system) on the Grafana website.
-
Start you Grafana server.
Tip
The procedure to start Grafana depends on your operating system and the installation process. For example, If your operating system is Mac OS and you have installed Grafana via Homebrew, you start Grafana by issuing the
brew services start grafanacommand. -
Access the Grafana UI from the
localhost:3000URL. - Sign in using
adminas both the username and the password.
Step 1.3 - Import dashboards to Grafana
The Micro Integrator provides pre-configured Grafana dashboards in which you can visualize MI statistics.
You can directly import the required dashboards to Grafana using the dashboard ID:
- Go to Grafana labs.
- Select the required dashboard and copy the dashboard ID.
- Provide this ID to Grafana and import the dashboard.
- Repeat the above steps to import all other Micro Integrator dashboards.
These dashboards are provided as JSON files that can be manually imported to Grafana. To import the dashboards as JSON files:
- Go to Grafana labs, select the required dashboard and download the JSON file.
-
Sign in to Grafana, click the + icon in the left pane, and then click Import.
The Import dialog box opens as follows.
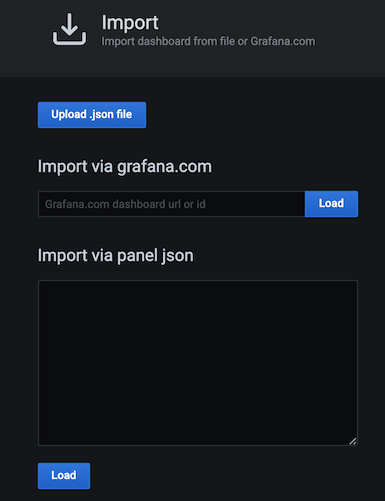
-
Click Upload.json file. Then browse for one of the dashboards that you downloaded as a JSON file.
-
Repeat the above two steps to import all the required dashboards that you downloaded and saved.
Step 1.4 - Set up the Micro Integrator
To enable observability for the Micro Integrator servers, add the following Synapse handler to the deployment.toml file (stored in the <MI_HOME>/conf/ folder).
[[synapse_handlers]]
name="CustomObservabilityHandler"
class="org.wso2.micro.integrator.observability.metric.handler.MetricHandler"
-DenablePrometheusApi=true
Step 2 - Optionally, integrate the Log Processing add-on
Once you have successfully set up the minimum deployment, you need to set up the log processing add-on to process logs. To achieve this, you can use Grafana Loki-based logging stack.
A Loki-based logging stack consists of three components:
- fluentBit is the agent that gathers logs and sends them to Loki.
- loki is the main server that stores logs and processes queries.
- Grafana queries and displays the logs.
Follow the steps below to set up Fluent Bit and Grafana Loki:
Step 2.1 - Set up Fluent Bit
Follow the instructions below to set up Fluent Bit:
-
Download Fluent Bit.
-
Extract the downloaded file.
Tip
The directory is referred to as
<FluentBit_Home>from hereon. -
Create the following files and save them with the given extension in a preferred location. You can use any text editor of your choice.
Info
In this example, the files are saved in the
<HOME_DIRECTORY>/confdirectory.-
labelmap.jsonfile{ "instance": "instance", "log_level": "log_level", "service": "service" } -
parsers.conffile[PARSER] Name observability Format json Time_Key time Time_Format %Y-%m-%dT%H:%M:%S.%L [PARSER] Name wso2 Format regex Regex \[(?<date>\d{2,4}\-\d{2,4}\-\d{2,4} \d{2,4}\:\d{2,4}\:\d{2,4}\,\d{1,6})\] (?<log_level>[^\s]+) \{(?<class>[\s\S]*)\} ([-]) (?<service>\{[\s\S]*\})?(?<message>.*) Time_Key date Time_Format %Y-%m-%d %H:%M:%S,%L -
fluentBit.conffile[SERVICE] Flush 1 Daemon Off Log_Level info Parsers_File <Location/parsers.conf> [INPUT] Name tail Path <MI_HOME>/repository/logs/*.log Mem_Buf_Limit 500MB Parser wso2 [OUTPUT] Name loki Match * Url http://localhost:3100/loki/api/v1/push BatchWait 1 BatchSize 30720 Labels {job="fluent-bit"} LineFormat json LabelMapPath <Location/labelmap.json>
-
-
Follow the instructions below to build the Fluent Bit output plugin before starting Fluent Bit:
- Clone the grafana/loki git repository.
-
To build the Fluent Bit plugin, execute the following command.
make fluent-bit-pluginFor more details, see Fluent Bit Output Plugin readme file.
-
Copy and save the path of the
out_loki.sofile.
-
Open a new terminal and navigate to the
<FluentBit_Home>directory. -
Execute the following command:
Tip
Replace
<location of out_loki.so file>with the path that you copied and saved in the previous step.fluent-bit -e <location of out_loki.so file> -c <fluentbit.conf file path>When Fluent Bit is successfully installed, you will see a log message.
Step 2.2 - Set up the Loki server
Grafana Loki aggregates and processes the logs from Fluent Bit.
Follow the instructions below to set up Grafana Loki:
-
Download Loki v1.6.1 from the
grafana/lokiGit repository.Tip
Be sure to select the appropriate OS version before downloading.
-
Create a configuration file named
loki-local-config.yamlfor Loki, similar to the sample given below, and save it in a preferred location.Tip
- You can use a text editor of your choice for this purpose.
- You can change the given parameter values based on your requirement.
auth_enabled: false server: http_listen_port: 3100 ingester: lifecycler: address: 127.0.0.1 ring: kvstore: store: inmemory replication_factor: 1 final_sleep: 0s chunk_idle_period: 5m chunk_retain_period: 30s max_transfer_retries: 0 schema_config: configs: - from: 2018-04-15 store: boltdb object_store: filesystem schema: v11 index: prefix: index_ period: 168h storage_config: boltdb: directory: /tmp/loki/index filesystem: directory: /tmp/loki/chunks limits_config: enforce_metric_name: false reject_old_samples: true reject_old_samples_max_age: 168h chunk_store_config: max_look_back_period: 0s table_manager: retention_deletes_enabled: false retention_period: 0s -
Unzip the file you downloaded in step 1.
The directory that is created as a result is referred to as
<GrafanaLoki_Home>from hereon. -
Open a new terminal and navigate to
<GrafanaLoki_Home>. -
Execute the following command:
./loki-darwin-amd64 -config.file=./loki-local-config.yaml
Step 2.3 - Configure Grafana to visualize logs
Follow the instructions below to add Loki as a datasource in Grafana:
You need to do this in order to configure Grafana to display logs.
-
Start you Grafana server.
Tip
The procedure to start Grafana depends on your operating system and the installation process. For example, If your operating system is Mac OS and you have installed Grafana via Homebrew, you start Grafana by issuing the
brew services start grafanacommand. -
Access Grafana via
http://localhost:3000/. -
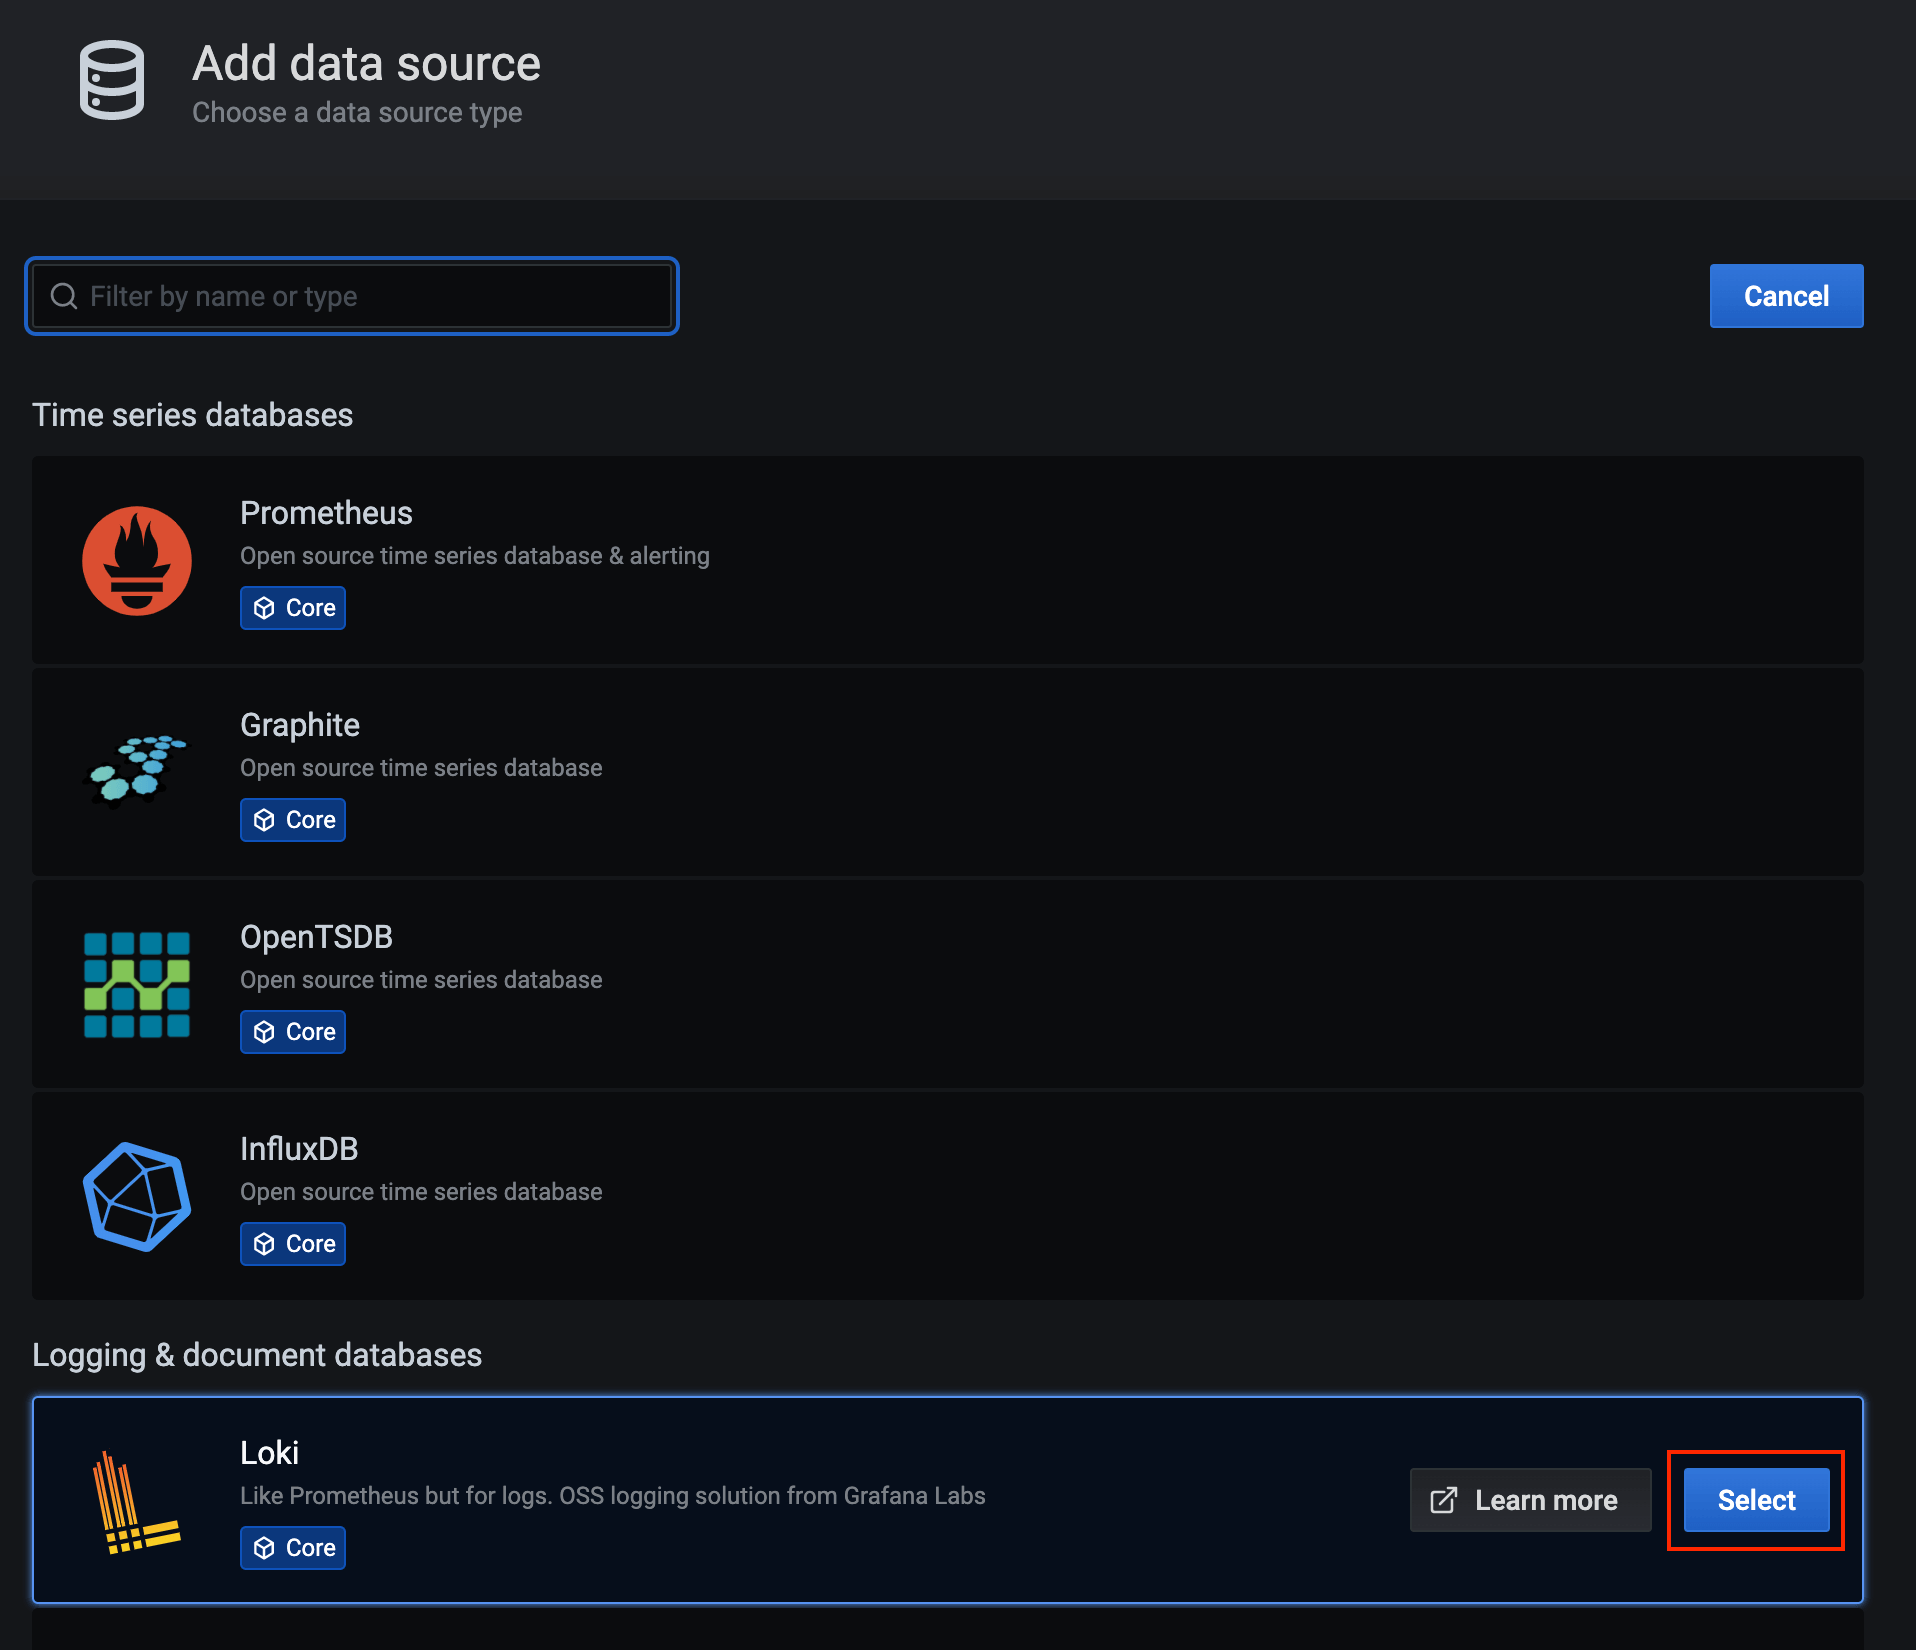
In the Data Sources section, click Add your first data source. In the Add data source page that appears, click Select for Loki.
-
In the Add data source page -> Settings tab, update the configurations for Loki.
-
Click Save & Test.
If the datasource is successfully configured, it is indicated via a message.
Step 3 - Optionally, integrate the Message Tracing add-on
Once you have successfully set up the minimum deployment, you need to set up the message tracing add-on using Jaeger.
Step 3.1 - Set up Jaeger
Download and install Jaeger.
Note
- There are some limitations in the Jaeger client, which by default uses a UDP sender as mentioned in the Jaeger documentation. If the payload size exceeds 65 KB, spans might get lost in the Jaeger console.
- Jaeger sampler types can also play a major role in tracing. Depending on the TPS, the sampler type should be carefully chosen.
- In general, before including tracing in production deployments, it is essential to look into performance tests and scaling requirements. For details on how to achieve better performance, see the Jaeger performance tuning guide.
Step 3.2 - Set up the Micro Integrator
Follow the instructions below to configure the Micro Integrator to publish tracing information:
-
Add the following configurations to the
deployment.tomlfile (stored in the<MI_HOME>/conf/).[mediation] flow.statistics.capture_all= true stat.tracer.collect_payloads= true stat.tracer.collect_mediation_properties= true [opentracing] enable = true logs = true manager_host = "localhost" agent_host = "localhost” -
Add the following entries to the
<MI_HOME>/repository/resources/conf/keyMappings.jsonfile.
Note
The service name used to initialize the JaegerTracer can be configured using the environment variable SERVICE_NAME
as shown below.
export SERVICE_NAME=customServiceName
SERVICE_NAME is set to WSO2-SYNAPSE by default.
Step 3.3 - Configure Grafana to visualize tracing data
In order to configure Grafana to display tracing information, follow the steps given below.
-
Add Jaeger as a datasource:
-
Access Grafana via
localhost:3000and sign in. -
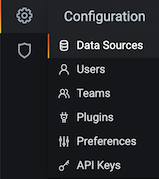
Click the Configuration icon in the left menu and then click Data Sources.
-
Click Add data source to open the Add data source page where all the available data source types are displayed. Here, click Jaeger.
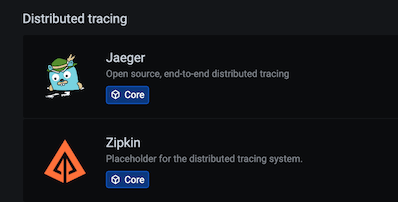
This opens the Data Sources/Jaeger dialog box.
-
In the Data Sources/Jaeger dialog box, enter the URL of the Jaeger query component in the URL field in the
http://host:portformat as shown below.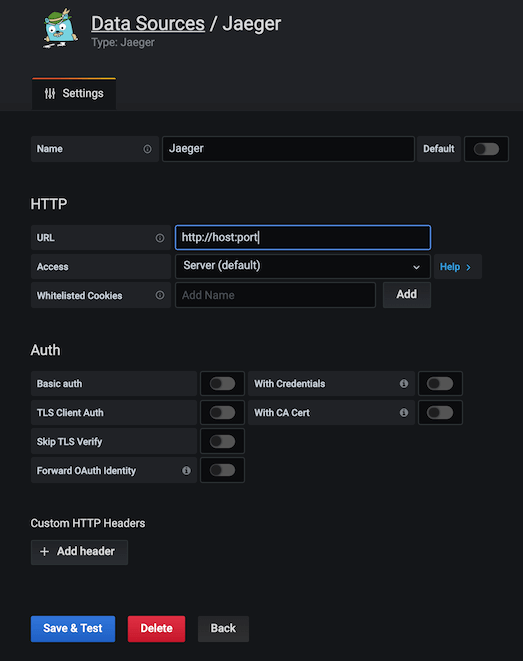
-
Click Save and Test. If the data source is successfully configured, it is indicated via a message.
-
-
Set up drill-down links to the Jaeger UI in service-level dashboards.
-
Navigate to the settings section of the service-level dashboard by clicking the cogwheel icon in the upper-right corner.
-
Click Variable. This opens the following view.
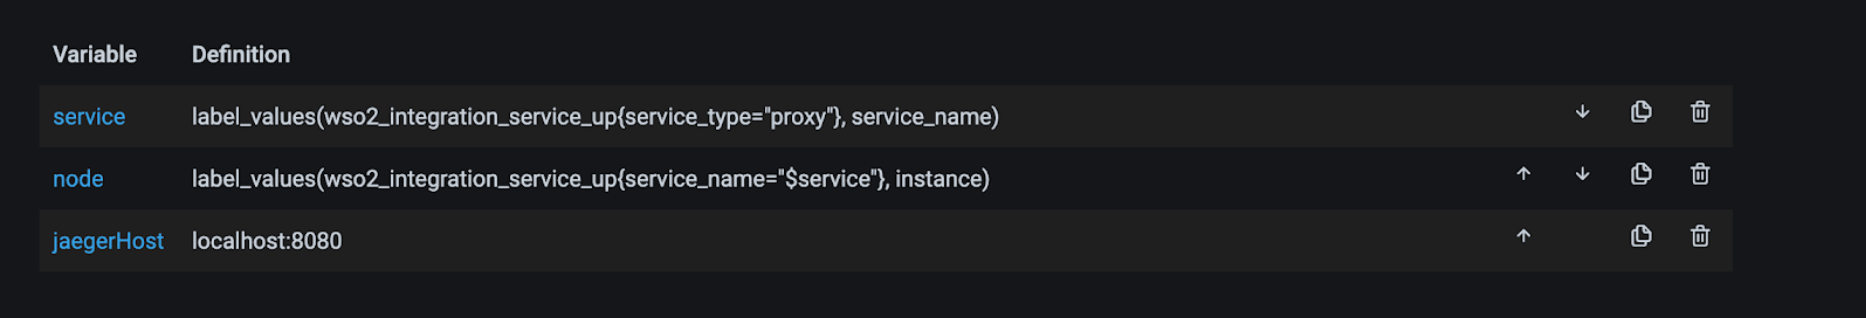
-
Edit the JaegerHost variable and provide your Jaeger query component hostname and port in the
host:portsyntax as shown below.
-
Click Save
You need to perform the above steps for all the service-level dashboards (i.e., Proxy Service dashboard, API Service Dashboard, and Inbound Endpoint dashboard).
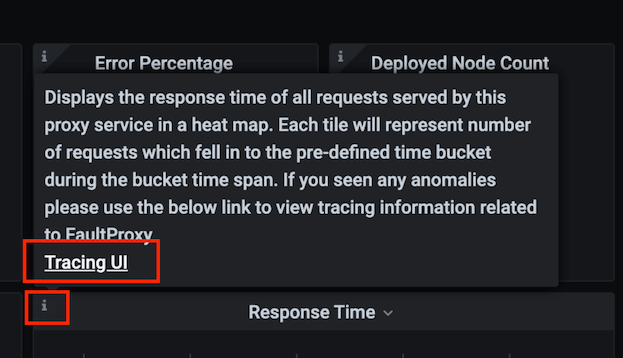
-
Once Grafana is successfully configured to visualize statistics, you should be correctly redirected to the Jaeger UI from the Response Time widget of each service-level dashboard as shown below.
What's Next?
If you have successfully set up your analytics deployment, see the instructions on viewing cloud native observability statistics.