JMX Monitoring
Java Management Extensions (JMX) is a technology that lets you implement management interfaces for Java applications. A management interface, as defined by JMX is composed of named objects called MBeans (Management Beans). MBeans are registered with a name (an ObjectName) in an MBeanServer. To manage a resource or many resources in your application, you can write an MBean defining its management interface and register that MBean in your MBeanServer. The content of the MBeanServer can then be exposed through various protocols, implemented by protocol connectors or protocol adaptors.
Note
Prometheus-based monitoring is recommended for remote monitoring in more recent versions of the Micro Integrator.
Configuring JMX in Micro Integrator
With JConsole, you can attach the Micro Integrator as a local process and monitor the MBeans that are provided. There is nothing explicitly enable.
Monitoring with JConsole
Jconsole is a JMX-compliant monitoring tool, which comes with the Java Development Kit (JDK). You can find this tool inside your <JDK_HOME>/bin directory.
Starting JConsole
Once the product server is started, you can start the JConsole tool as follows:
- Open a command prompt and navigate to the
<JDK_HOME>/bindirectory. -
Execute the
jconsolecommand to open the log-in screen of the Java Monitoring & Management Console as shown below.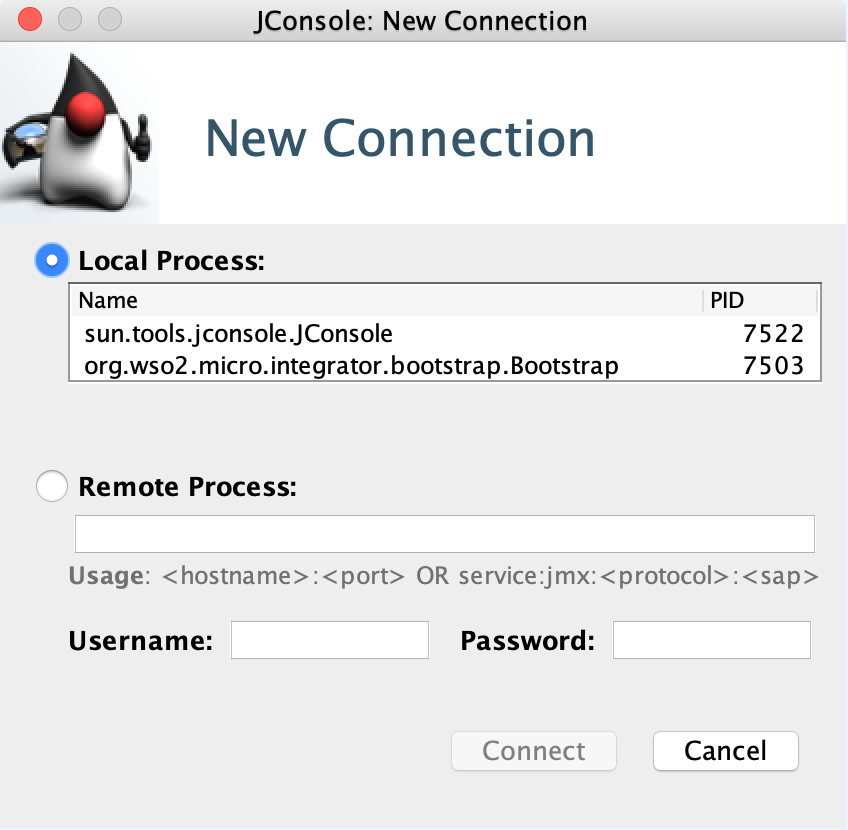
-
Click on the
org.wso2.micro.integrator.bootstrap.Bootstrapprocess (which is the Micro Integrator) under the Local Process. -
Click Connect to open the Java Monitoring & Management Console.
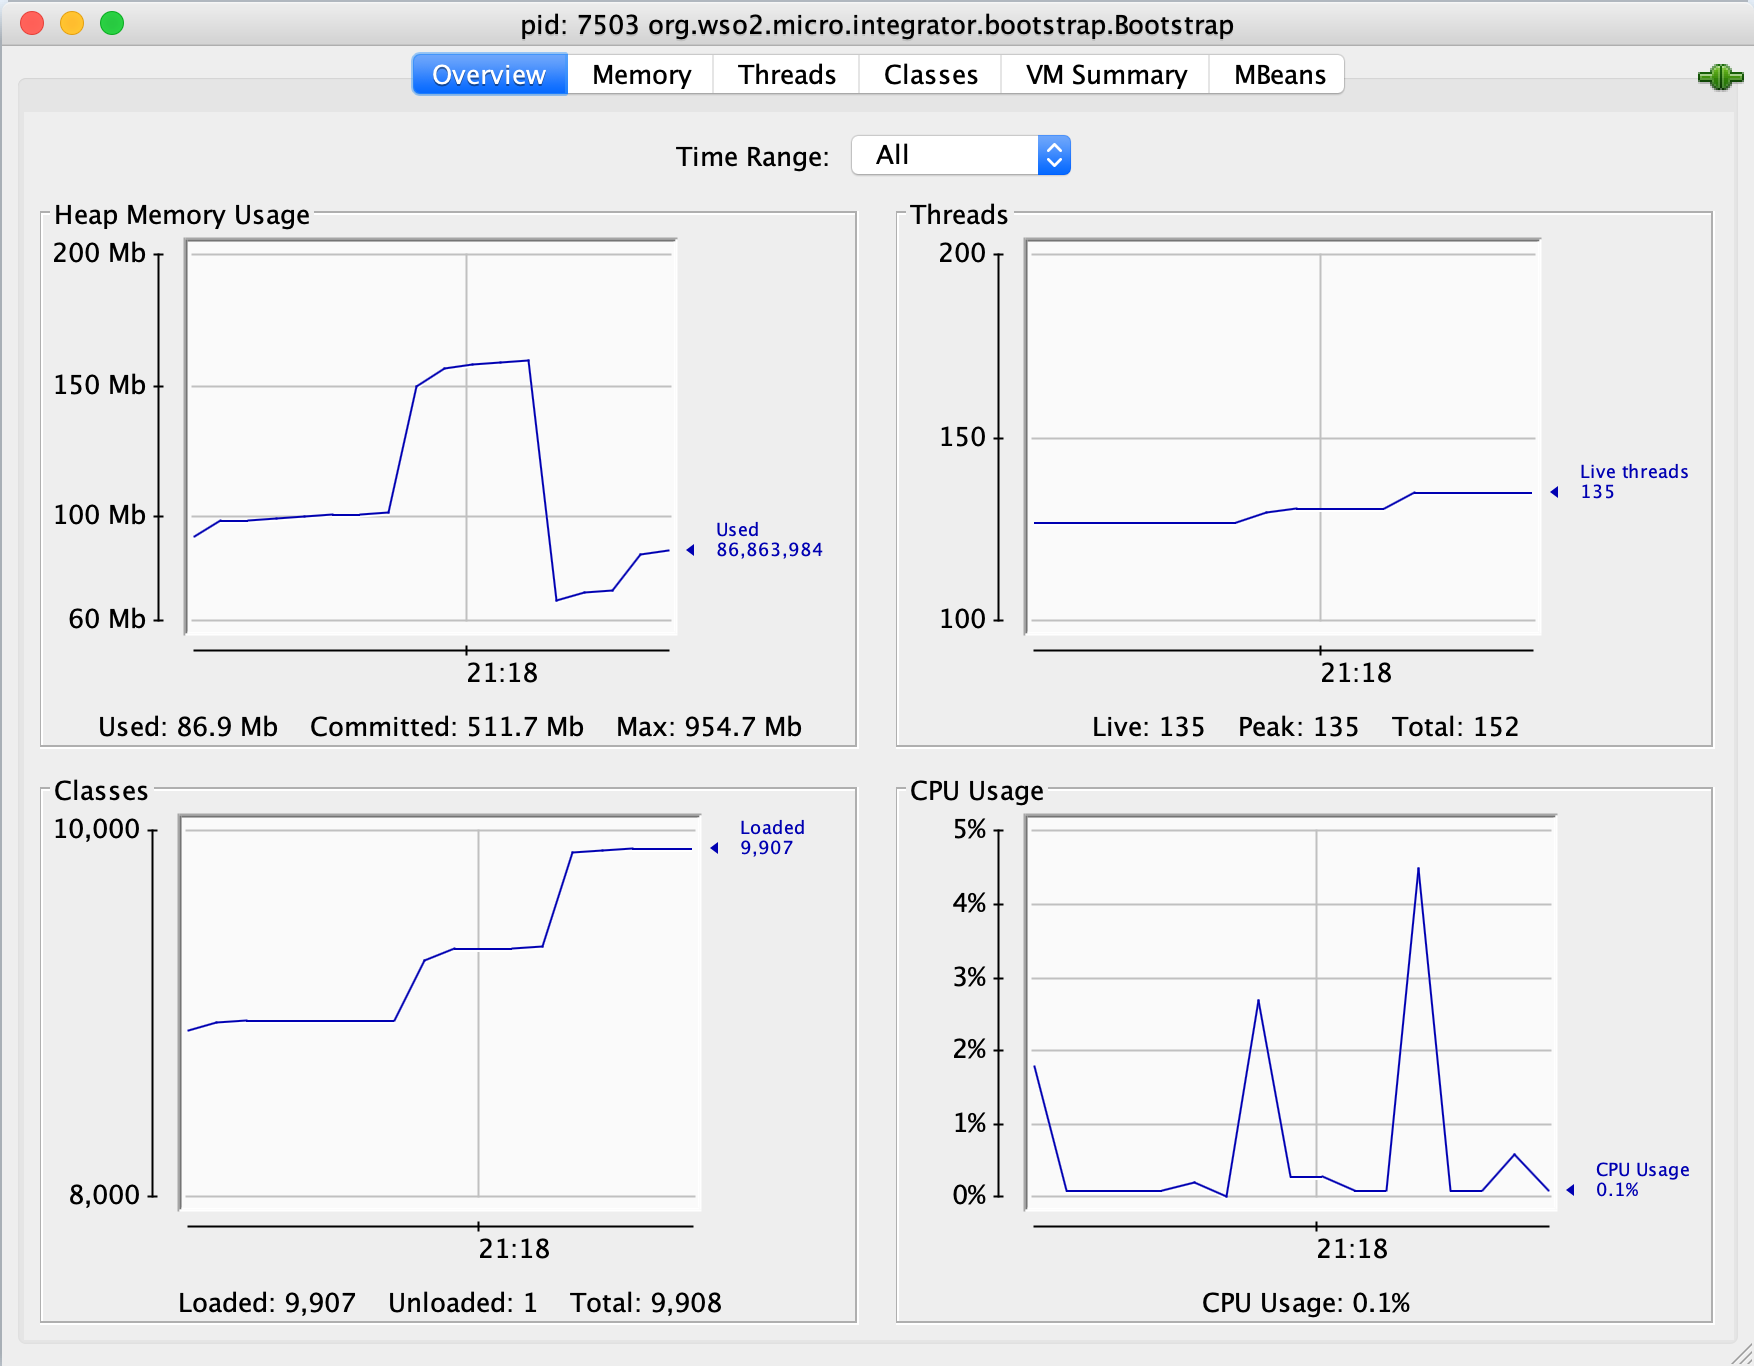
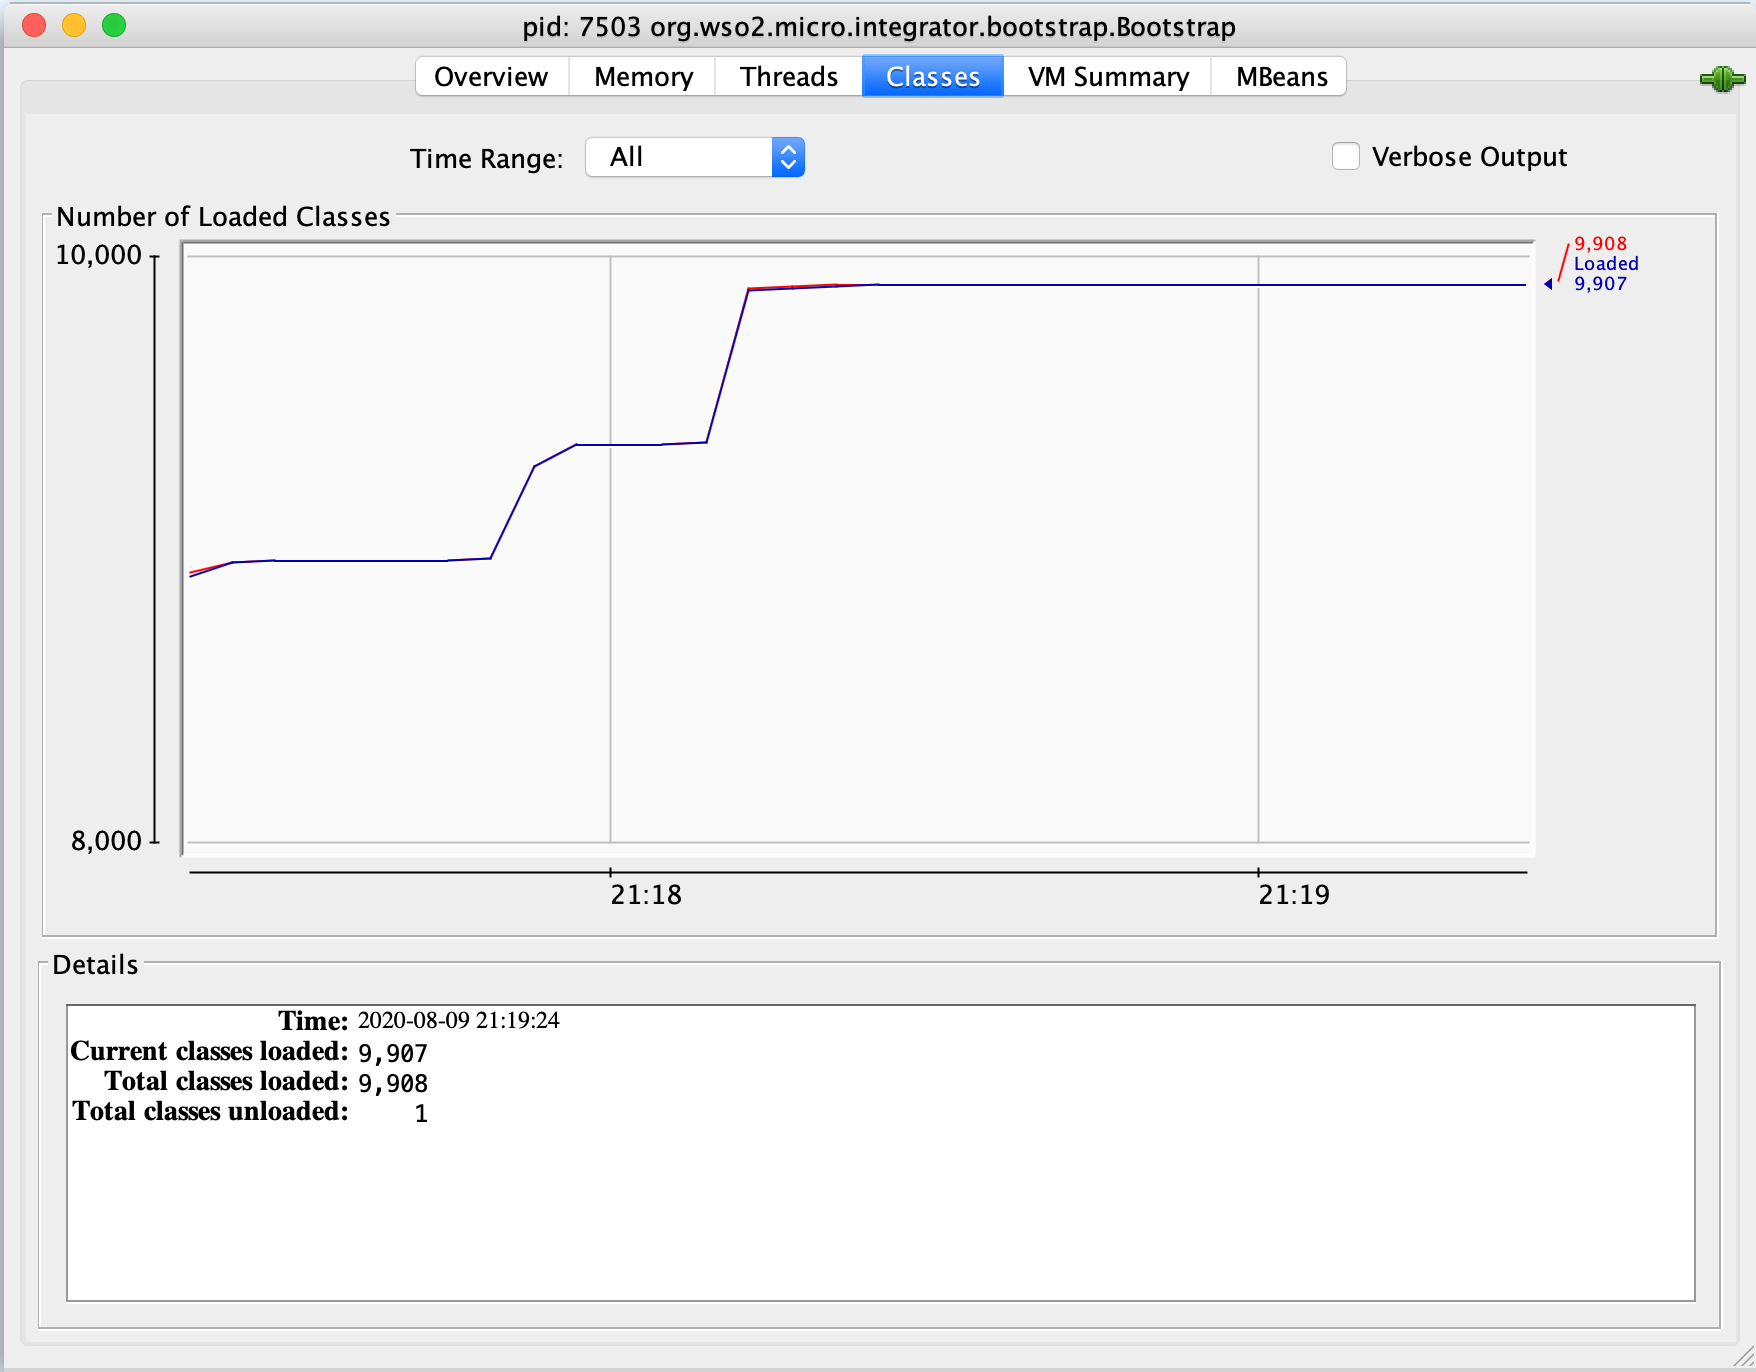
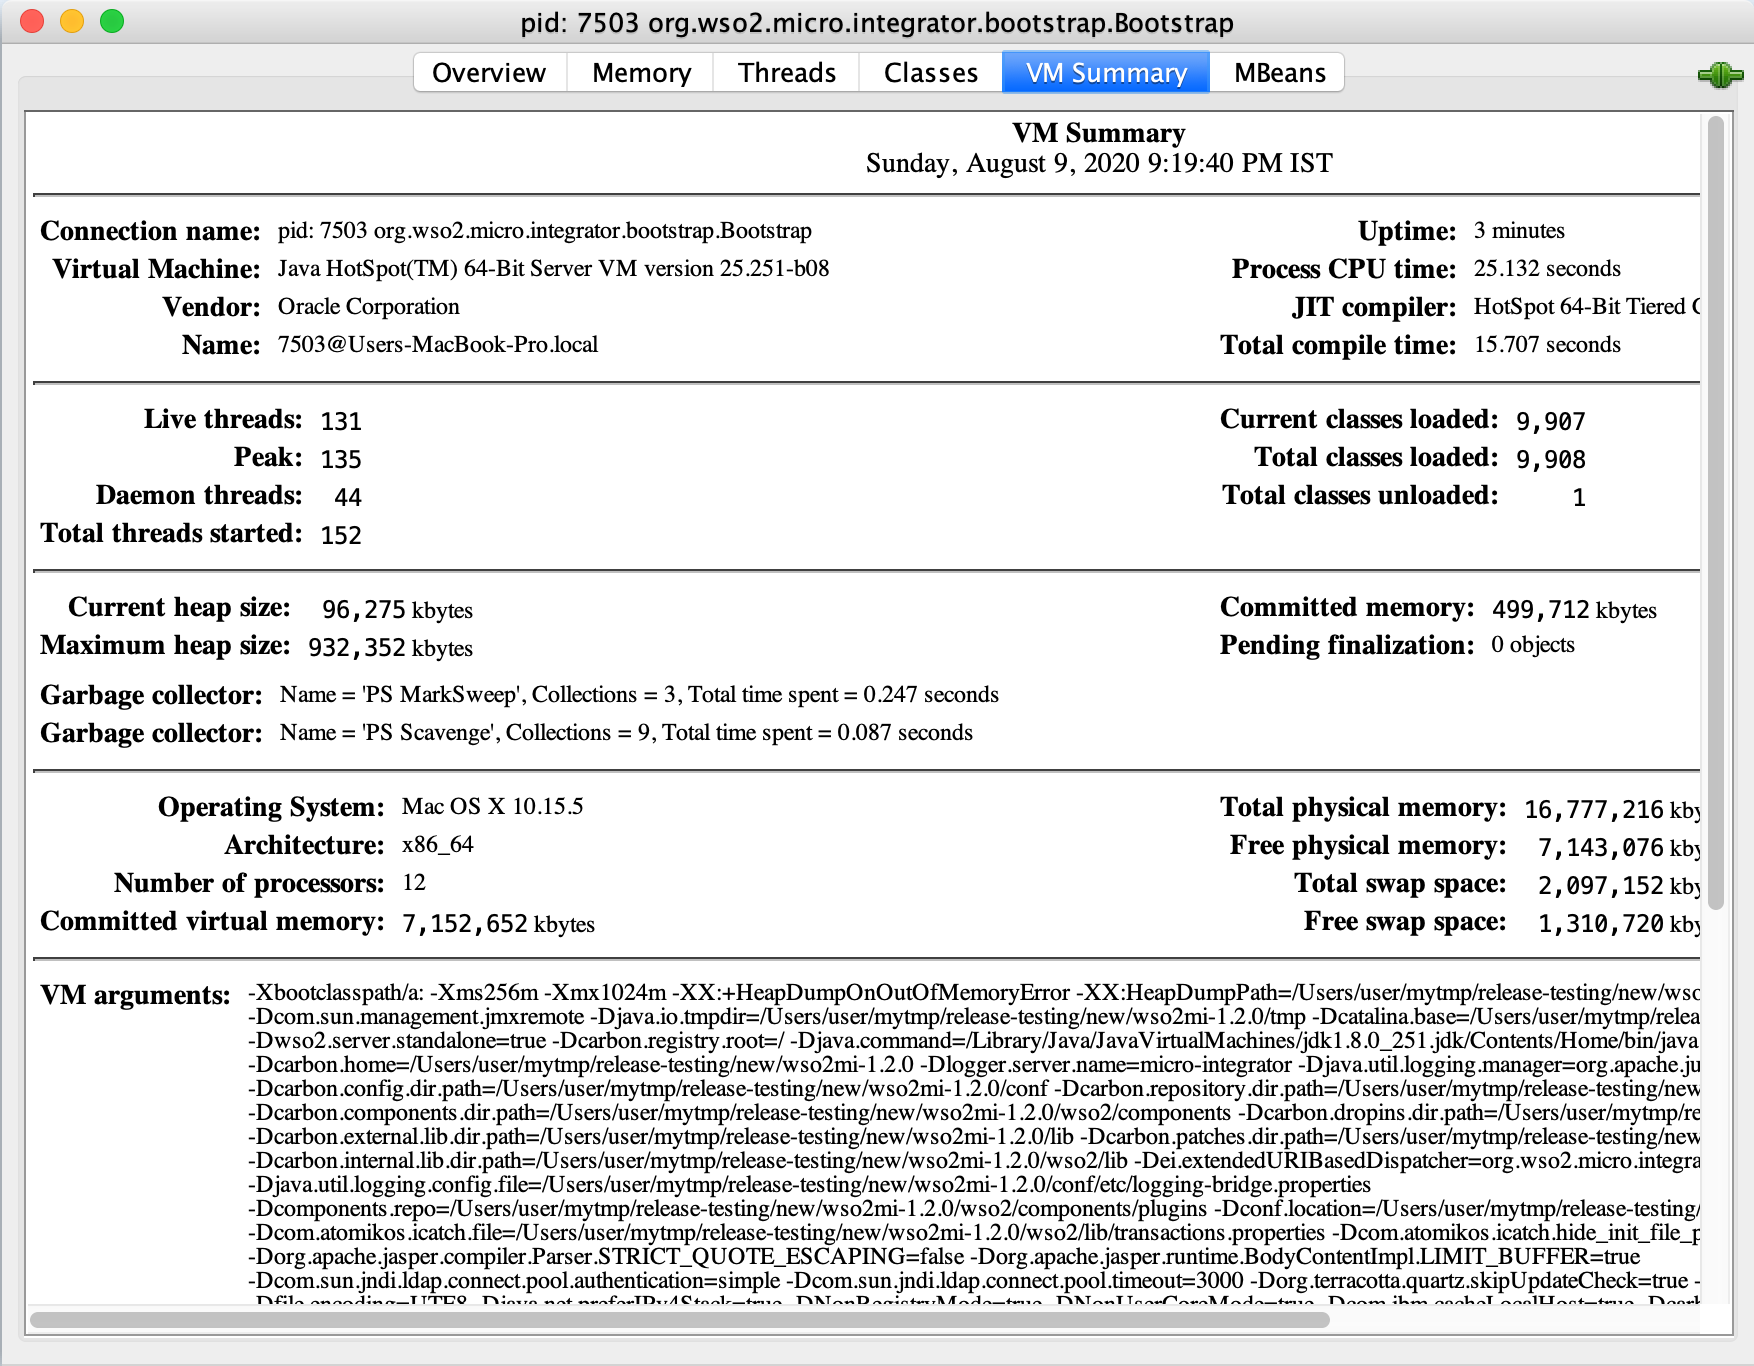
See the Oracle documentation on using JConsole. The following tabs will be available:
-
Overview
-
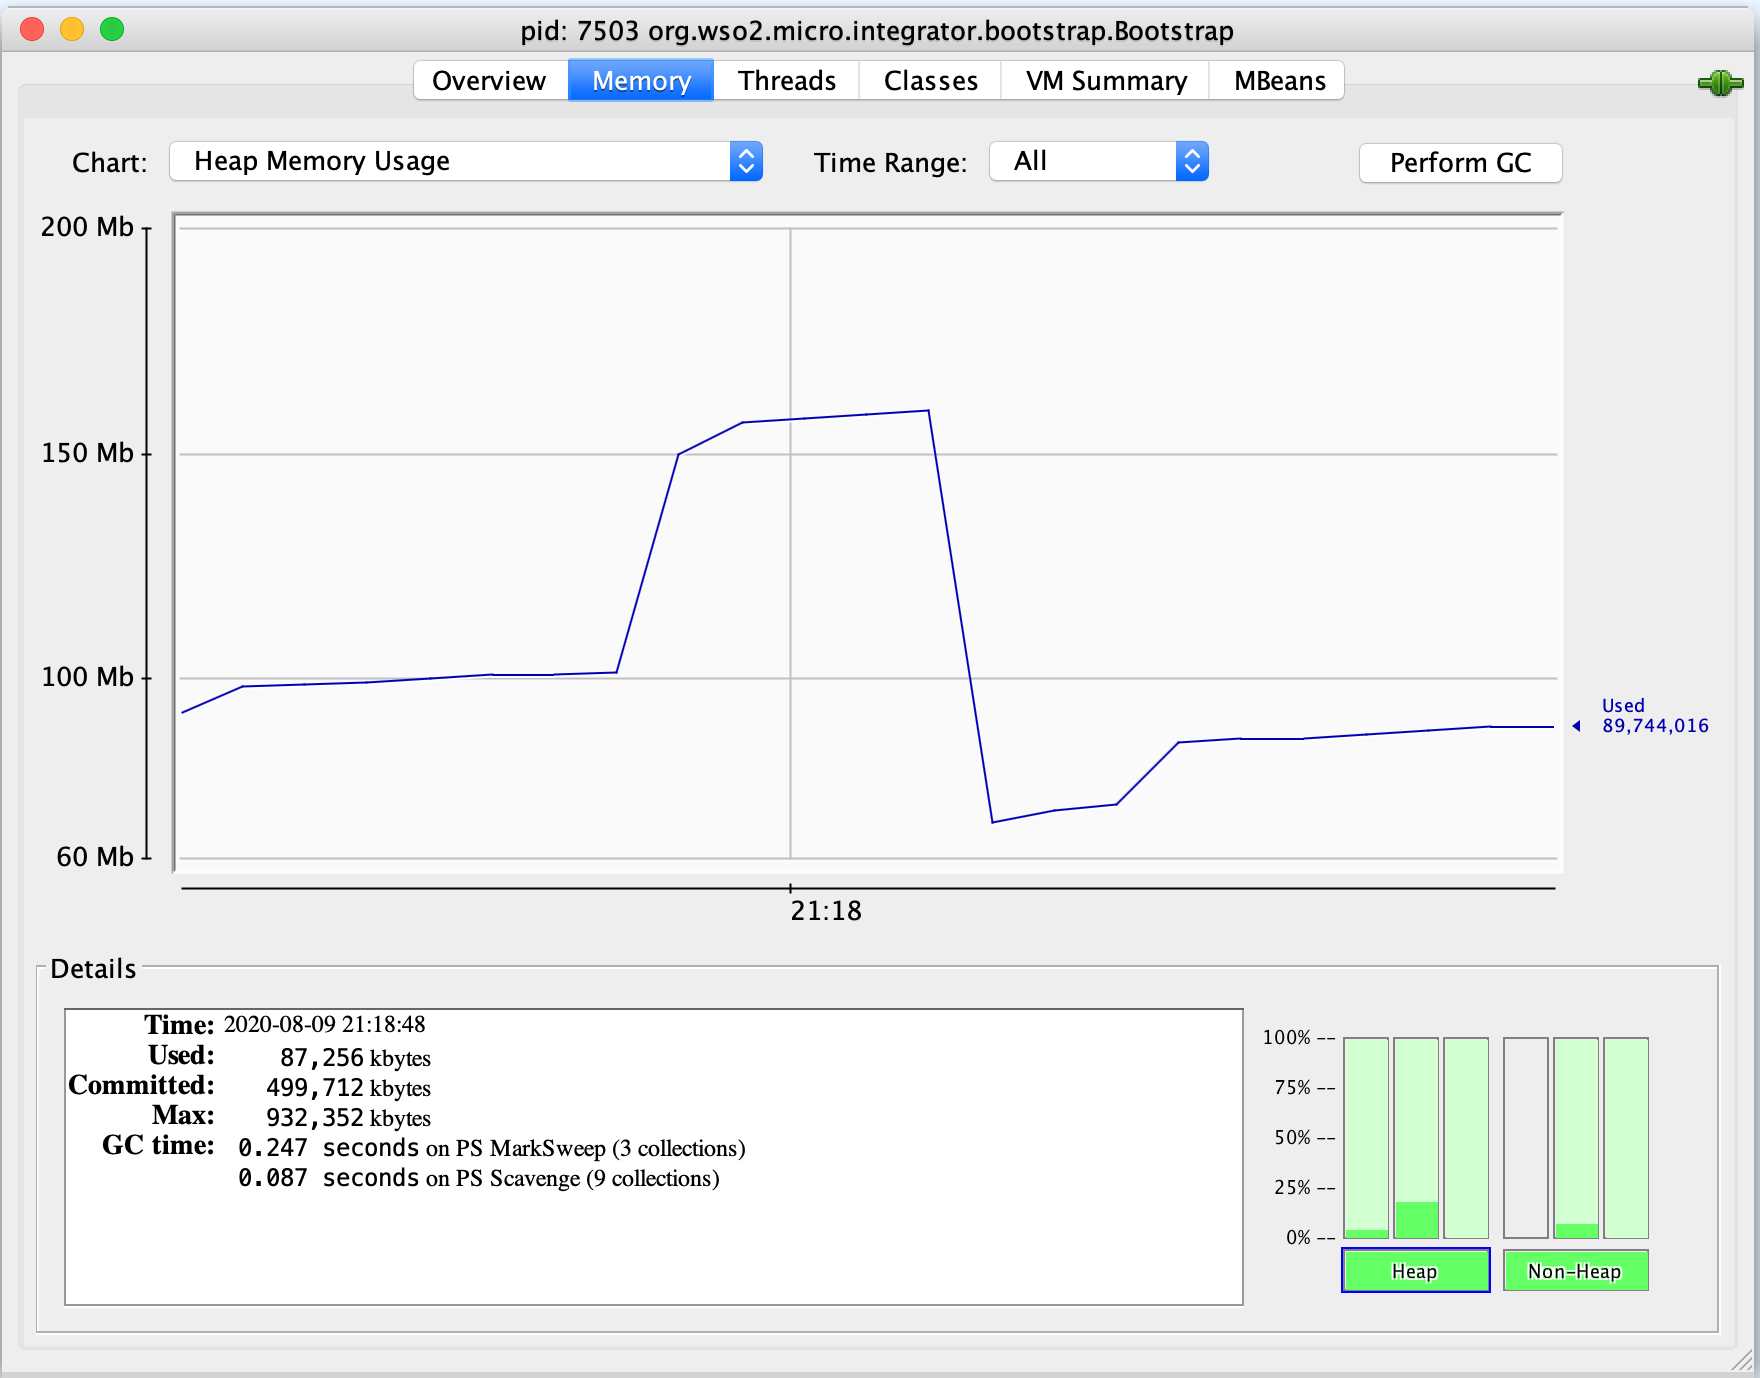
Memory
-
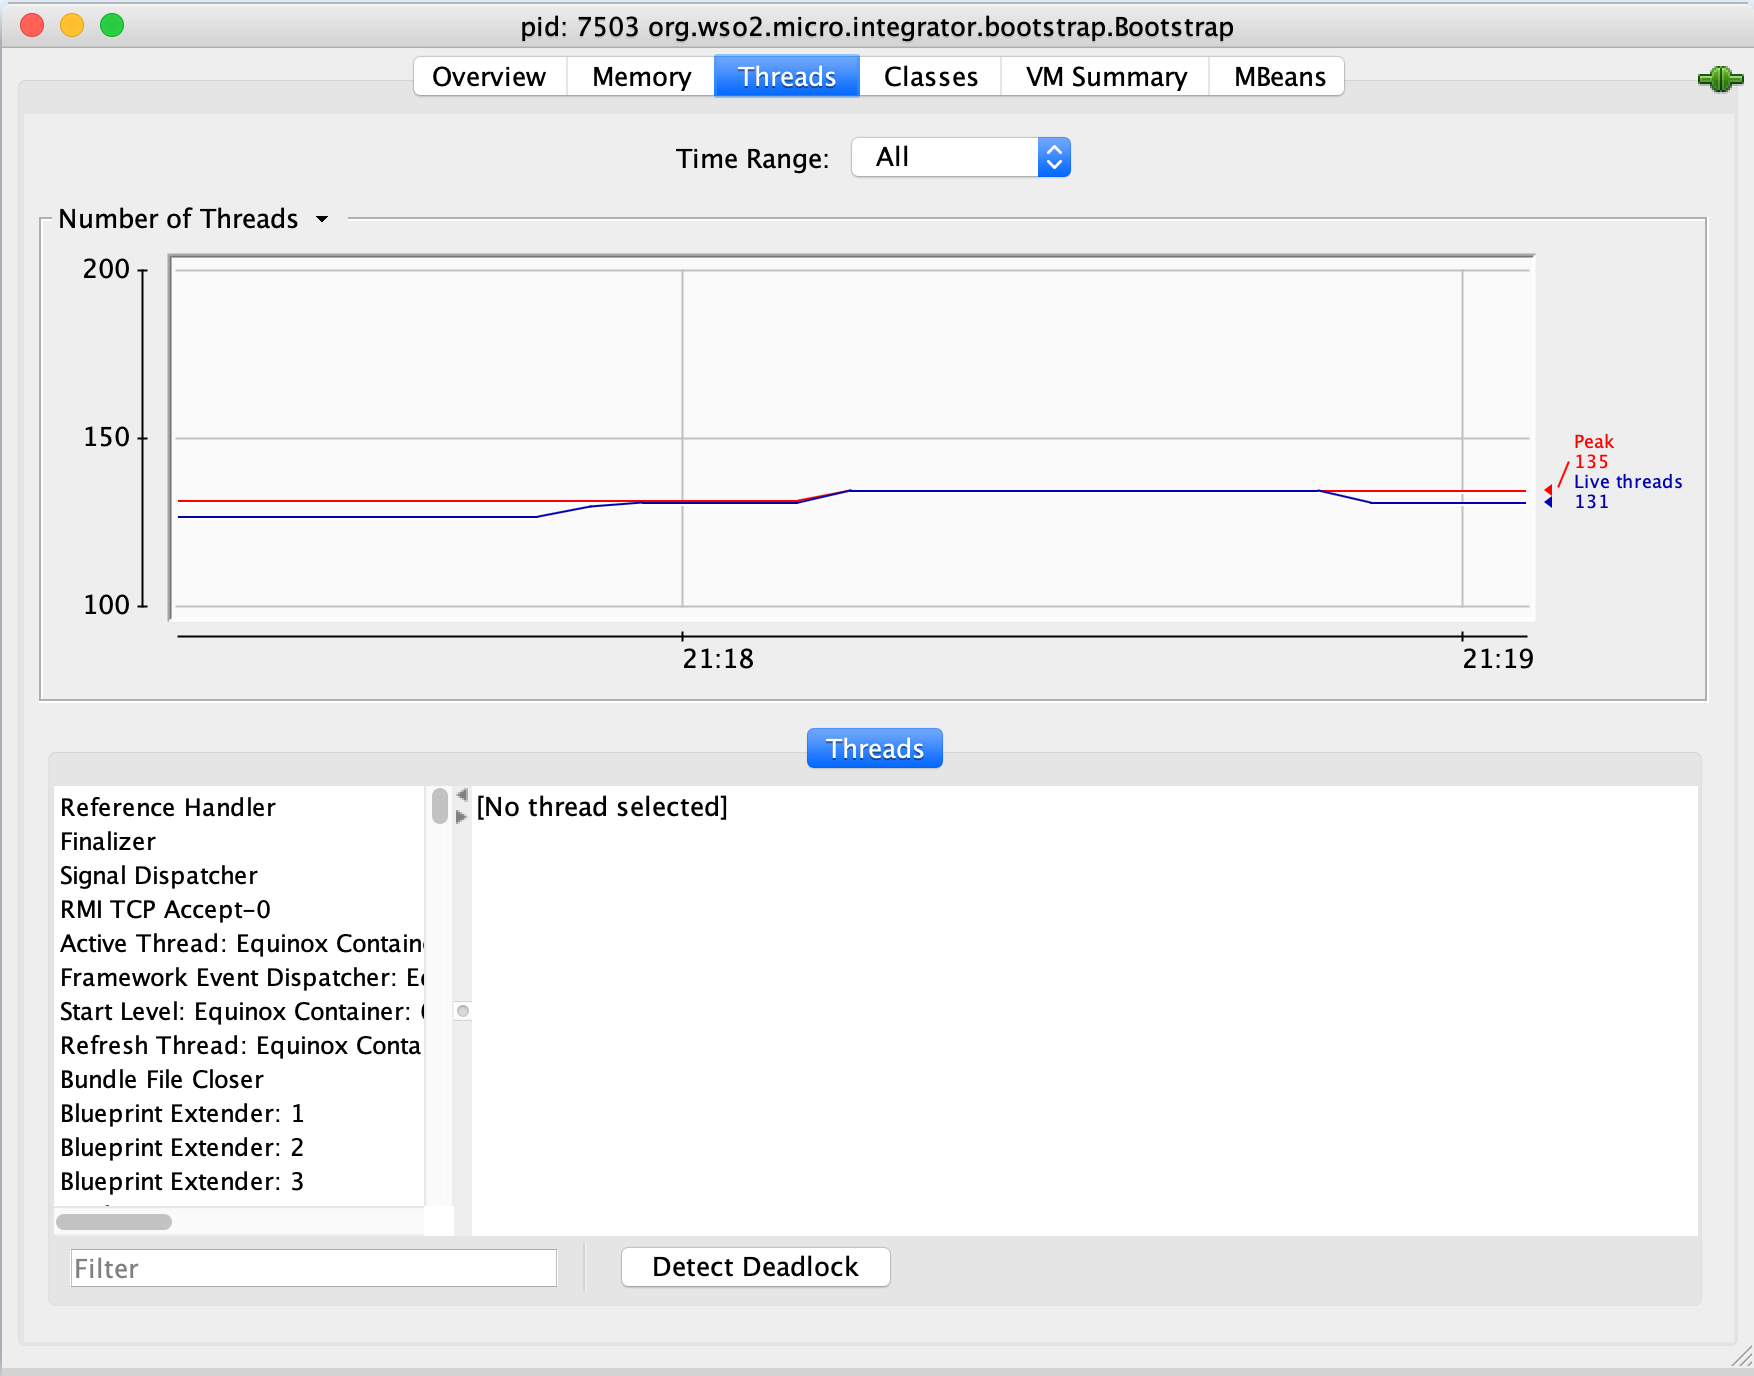
Threads
-
Classes
-
VM
-
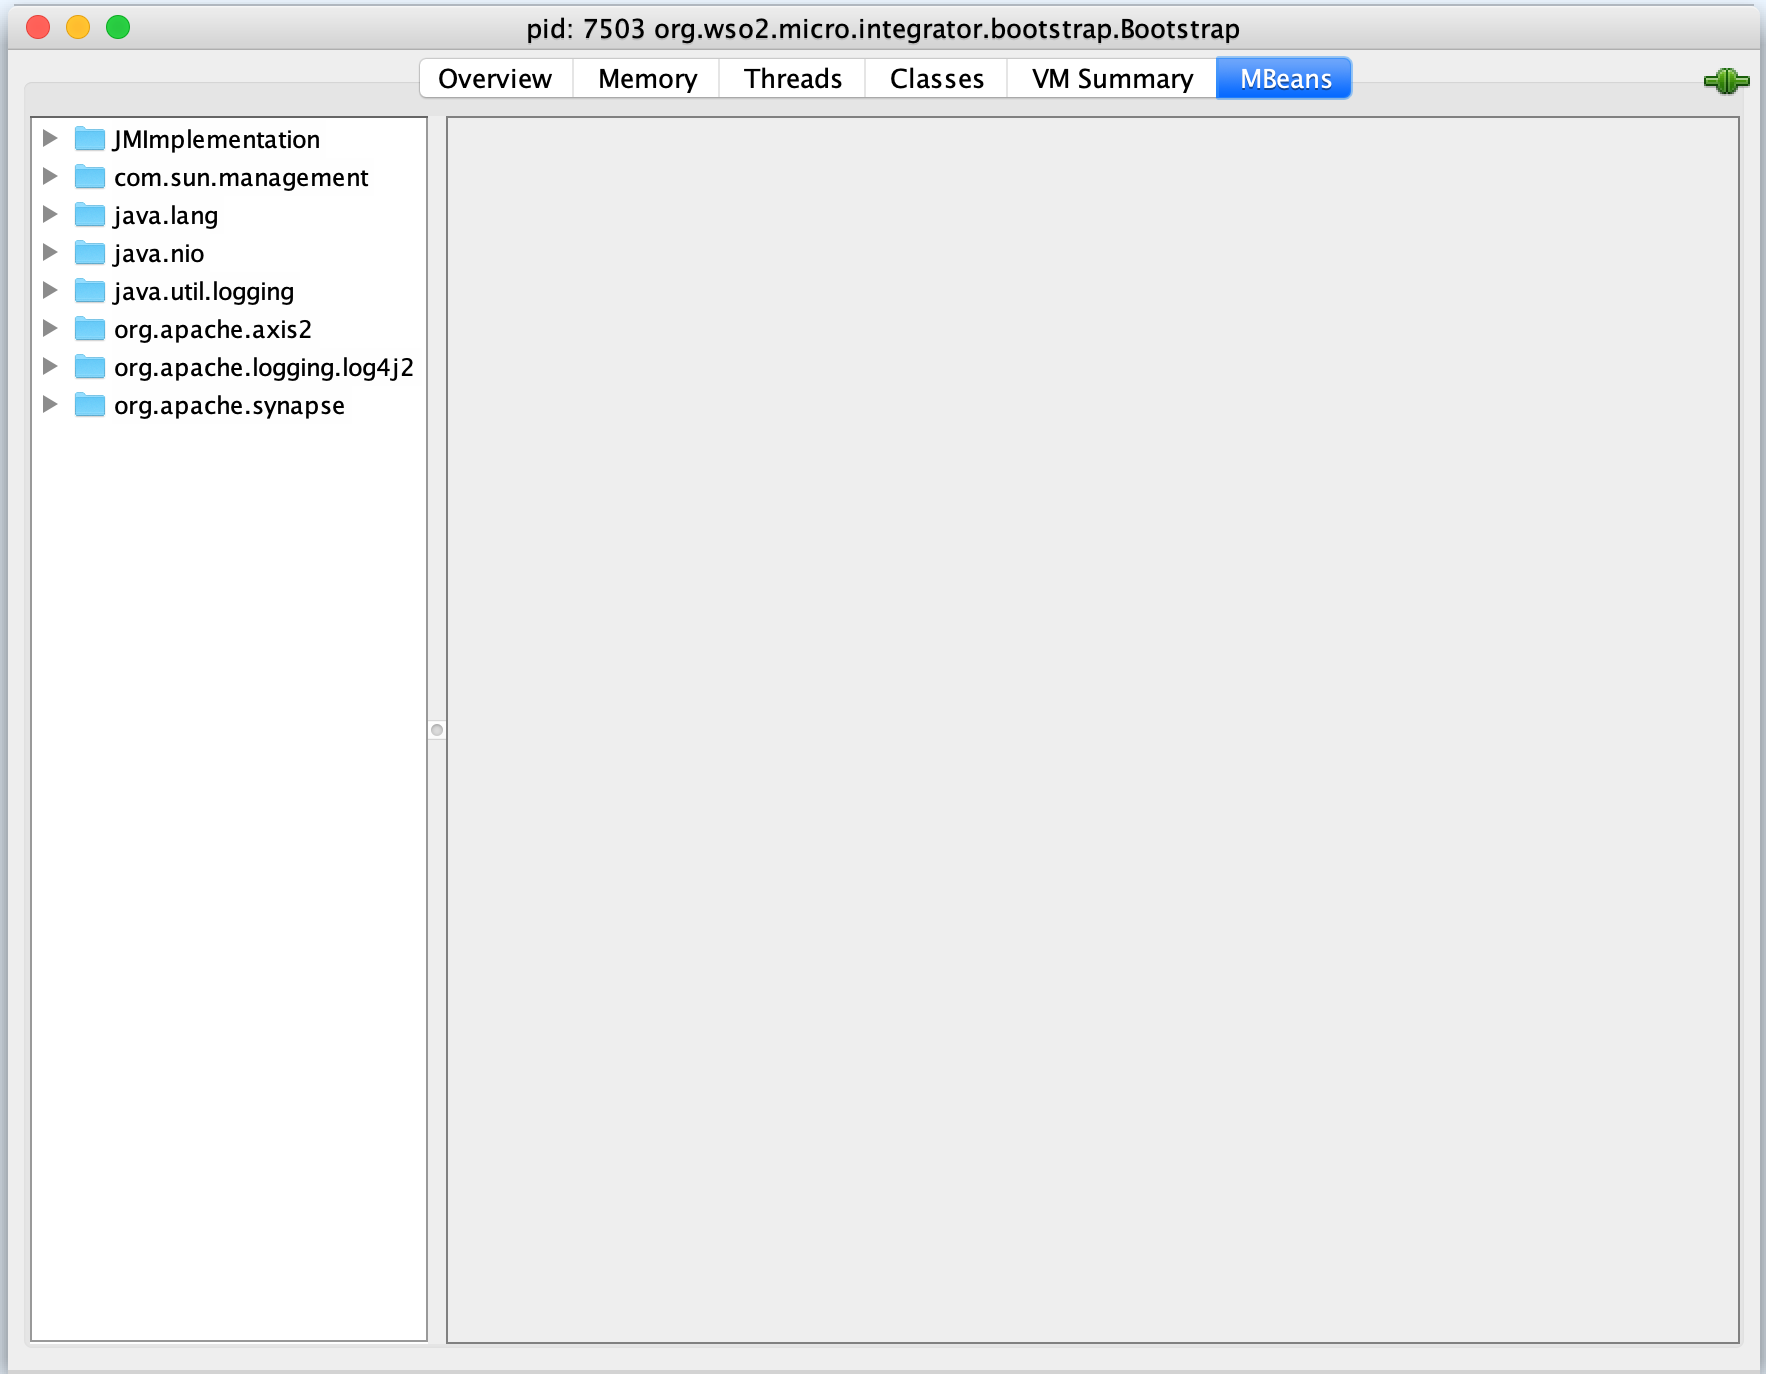
MBeans
-
See the list of Micro Integrator MBeans that you can monitor.
Monitoring a WSO2 product with Jolokia
Jolokia is a JMX-HTTP bridge, which is an alternative to JSR-160 connectors. It is an agent-based approach that supports many platforms. In addition to basic JMX operations, it enhances JMX monitoring with unique features like bulk requests and fine-grained security policies.
Follow the steps below to use Jolokia to monitor a WSO2 product using a JVM Agent. It can be dynamically attached (and detached) to an already running Java process. This universal agent uses the JVM agent API and is available for every Sun/Oracle JVM 1.6 and later.
- Download JVM-Agent. (These instructions are tested with the Jolokia JVM-Agent version 1.7.1 by downloading the
jolokia-jvm-1.7.1.jarfile.) - Add it to the
<MI_HOME>/dropins/directory. - Start the WSO2 product server.
- Get the PID of wso2 server
- Start the JVM Agent ex: java -jar jolokia-jvm-1.7.1.jar --host=localhost --port=9764 start
- Also you can call it with --help to get a short usage information:
Once the server starts, you can read MBeans using Jolokia APIs. The following are a few examples.
-   List all available MBeans: `http://localhost:9763/jolokia/list` (Change the appropriate hostname and port accordingly.)
-   WSO2 ESB MBean:
    ```
    http://localhost:9763/jolokia/read/org.apache.synapse:Name=https-sender,Type=PassThroughConnections/ActiveConnections
    ```

-   Reading Heap Memory: `http://localhost:9763/jolokia/read/java.lang:type=Memory/HeapMemoryUsage`
Follow the steps below to use Jolokia to monitor a WSO2 product using OSGi Agent.
- Download Osgi-Agent (full bundle). (These instructions are tested with the Jolokia OSGI Agent version 1.7.1 by downloading the
jolokia-osgi-bundle-1.7.1.jarfile.) - Add it to the
<MI_HOME>/dropins/directory. - Start the WSO2 product server.
- You can define the port with system variables. E.g.,
./micro-integrator.sh -Dorg.osgi.service.http.port=9763
Once the server starts, you can read MBeans using Jolokia APIs. The following are a few examples.
- List all available MBeans: `http://localhost:9763/jolokia/list` (Change the appropriate hostname and port accordingly.)
- WSO2 ESB MBean:
    ```
    http://localhost:9763/jolokia/read/org.apache.synapse:Name=https-sender,Type=PassThroughConnections/ActiveConnections
    ```

- Reading Heap Memory: `http://localhost:9763/jolokia/read/java.lang:type=Memory/HeapMemoryUsage`
MBeans for the Micro Integrator
When JMX is enabled, the Micro Integrator exposes a number of management resources as JMX Management Beans (MBeans) that can be used for managing and monitoring the running server. When you start JConsole, you can monitor these MBeans from the MBeans tab. Most of the MBeans are exposed from the underlying Synapse mediation engine.
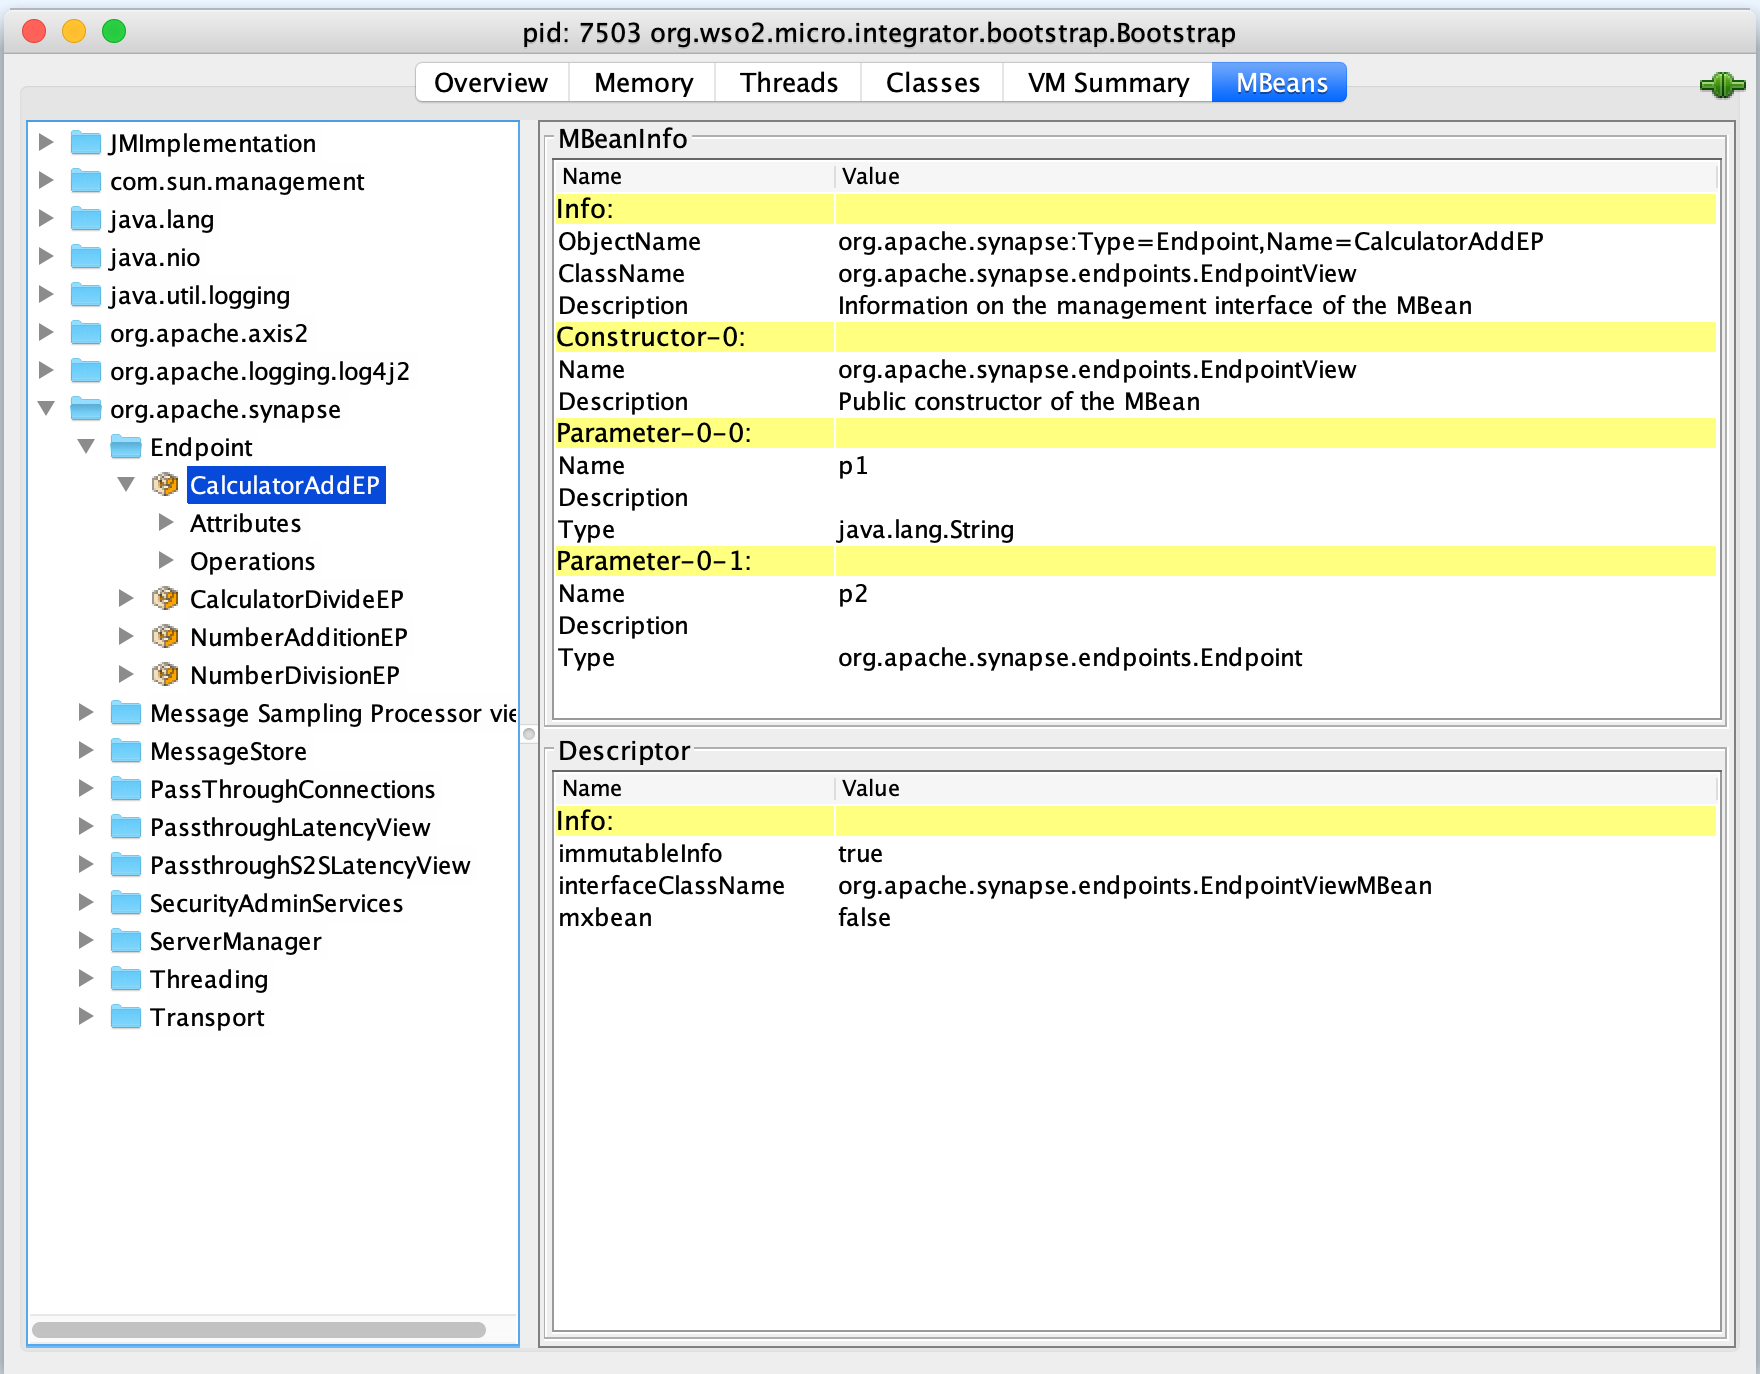
The following section summarizes the common MBeans for all WSO2 products:
Connection MBeans
These MBeans provide connection statistics for the HTTP and HTTPS transports.
You can view the following Connection MBeans:
org.apache.synapse/PassThroughConnections/http-listenerorg.apache.synapse/PassThroughConnections/http-senderorg.apache.synapse/PassThroughConnections/https-listenerorg.apache.synapse/PassThroughConnections/https-sender
Attributes
| Attribute Name | Description |
|---|---|
ActiveConnections |
Number of currently active connections. |
ActiveConnectionsPerHosts |
A map of the number of connections against hosts. |
LastXxxConnections |
The number of connections created during last Xxx time period. |
RequestSizesMap |
A map of the number of requests against their sizes. |
ResponseSizesMap |
A map of the number of responses against their sizes. |
LastResetTime |
The time when the connection-statistic recordings were last reset. |
Operations
| Operation Name | Description |
|---|---|
reset() |
Clear recorded connection statistics and restart recording. |
Latency MBeans
This view provides statistics of the latencies from all backend services connected through the HTTP and HTTPS transports. These statistics are provided as an aggregate value.
You can view the following Latency MBeans:
org.apache.synapse/PassthroughLatencyView/nio-http-httporg.apache.synapse/PassthroughLatencyView/nio-https-https
Attributes
| Attribute Name | Description |
|---|---|
AllTimeAvgLatency |
Average latency since the latency recording was last reset. |
LastxxxAvgLatency |
Average latency for last xxx time period. For example, LastHourAvgLatency returns the average latency for the last hour. |
LastResetTime |
The time when the latency-statistic recordings were last reset. |
Operations
| Operation Name | Description |
|---|---|
reset() |
Clear recorded latency statistics and restart recording. |
Transport MBeans
For each transport listener and sender enabled in the Micro Integrator, there will be an MBean under the org.apache.axis2/Transport domain.
For example, when the JMS transport is enabled, the following MBean will be exposed:
org.apache.axis2/Transport/jms-sender-n
You can also view the following Transport MBeans:
org.apache.synapse/Transport/passthru-http-receiverorg.apache.synapse/Transport/passthru-http-senderorg.apache.synapse/Transport/passthru-https-receiverorg.apache.synapse/Transport/passthru-https-sender
Attributes
| Attribute Name | Description |
|---|---|
ActiveThreadCount |
Threads active in this transport listener/sender. |
AvgSizeReceived |
The average size of received messages. |
AvgSizeSent |
The average size of sent messages. |
BytesReceived |
The number of bytes received through this transport. |
BytesSent |
The number of bytes sent through this transport. |
FaultsReceiving |
The number of faults encountered while receiving. |
FaultsSending |
The number of faults encountered while sending. |
LastResetTime |
The time when the last transport listener/sender statistic recording was reset. |
MaxSizeReceived |
Maximum message size of received messages. |
MaxSizeSent |
Maximum message size of sent messages. |
MetricsWindow |
Time difference between current time and last reset time in milliseconds. |
MinSizeReceived |
Minimum message size of received messages. |
MinSizeSent |
Minimum message size of sent messages. |
MessagesReceived |
The total number of messages received through this transport. |
MessagesSent |
The total number of messages sent through this transport. |
QueueSize |
The number of messages currently queued. Messages get queued if all the worker threads in this transport thread pool are busy. |
ResponseCodeTable |
The number of messages sent against their response codes. |
TimeoutsReceiving |
Message receiving timeout. |
TimeoutsSending |
Message sending timeout. |
Operations
| Operation Name | Description |
|---|---|
start() |
Start this transport listener/sender. |
stop() |
Stop this transport listener/sender. |
resume() |
Resume this transport listener/sender which is currently paused. |
resetStatistics() |
Clear recorded transport listener/sender statistics and restart recording. |
pause() |
Pause this transport listener/sender which has been started. |
maintenenceShutdown(long gracePeriod) |
Stop processing new messages, and wait the specified maximum time for in-flight requests to complete before a controlled shutdown for maintenance. |