Quick Tour - WSO2 Integration Studio
WSO2 Integration Studio is your development environment for designing, developing, debugging, and testing integration solutions. As an integration developer, you can execute all the phases of the development lifecycle using this tool. When your integration solutions are production-ready, you can easily push the artifacts to your continuous integration/continuous deployment pipeline.
Tip
The base of the WSO2 Integration Studio is Eclipse IDE. You can install any supported Eclipse plugin for Integration Studio by navigating to Help -> Install New Software.
Getting Started
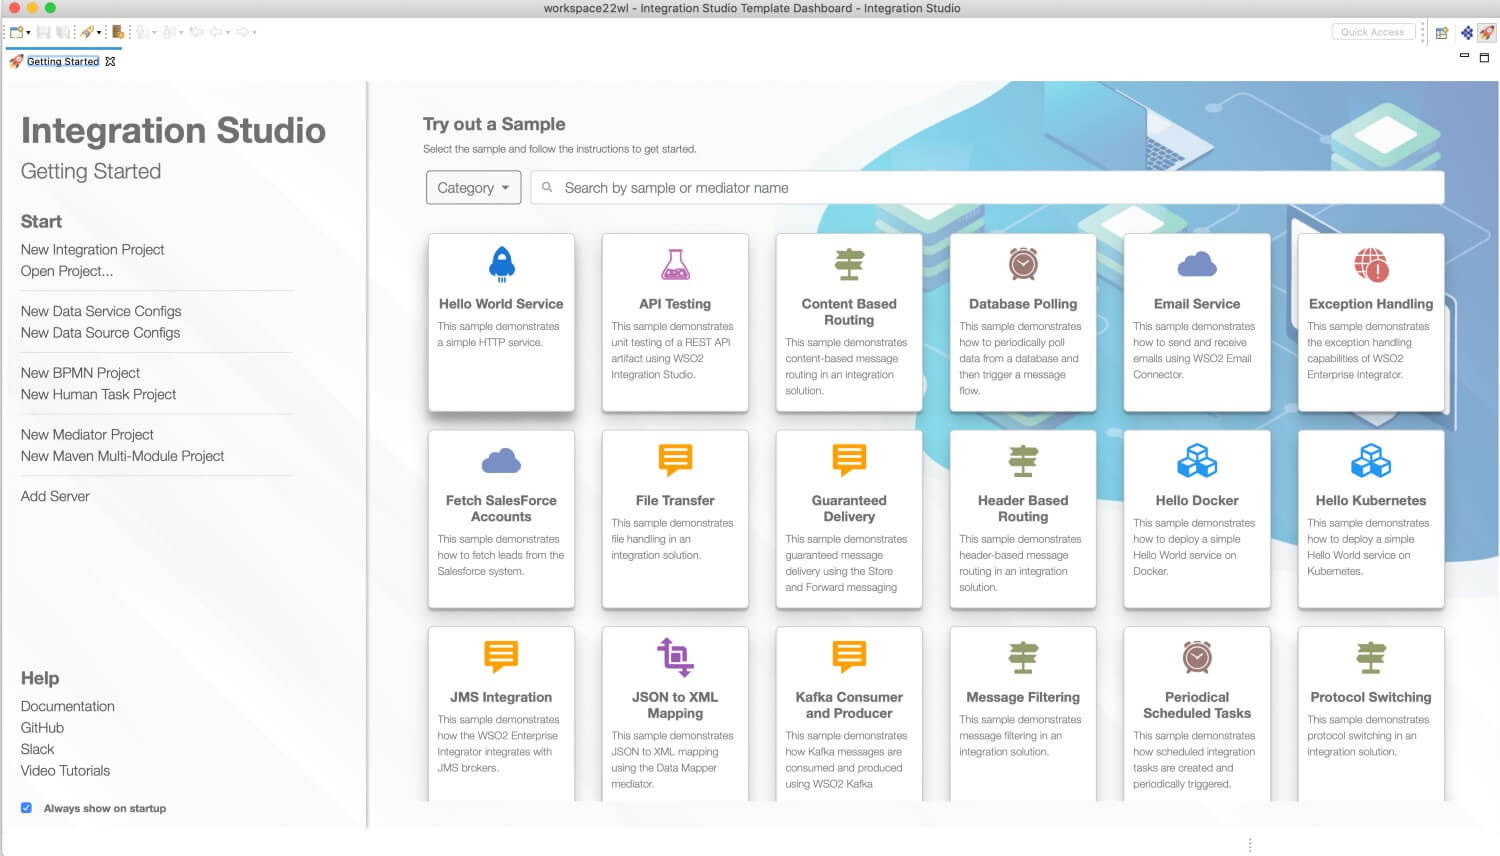
When you open WSO2 Integration Studio, you will see the Getting Started view in the tool's workbench.
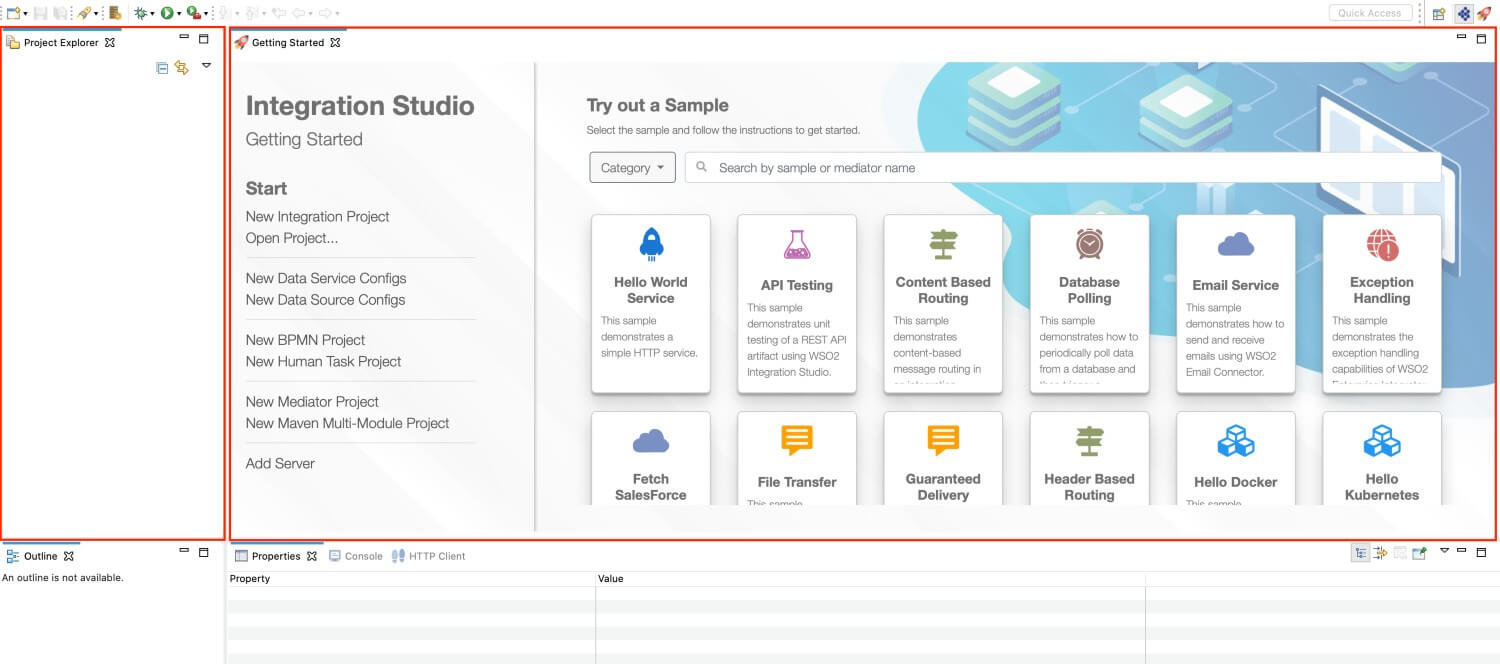
You can also click the ![]() icon at the top-right of the workbench to open the Project Explorer alongside the Getting Started tab as shown below.
icon at the top-right of the workbench to open the Project Explorer alongside the Getting Started tab as shown below.
To get started, you need to first create the required project directories. Alternatively, you can use an integration sample, which will generate the required projects and files for a specific use case.
| Project Directories |
Use the links on the Getting Started view to create the required projects. These project directories are saved to your workspace and they can later be accessed from the Project Explorer view of WSO2 Integration Studio.
|
|---|---|
| Samples |
The Getting Started view lists a set of sample projects and integration artifacts that represent common integration scenarios. You can use these to explore WSO2 Micro Integrator and to try out common integration use cases. The sample guide will provide instructions on how to run the samples. 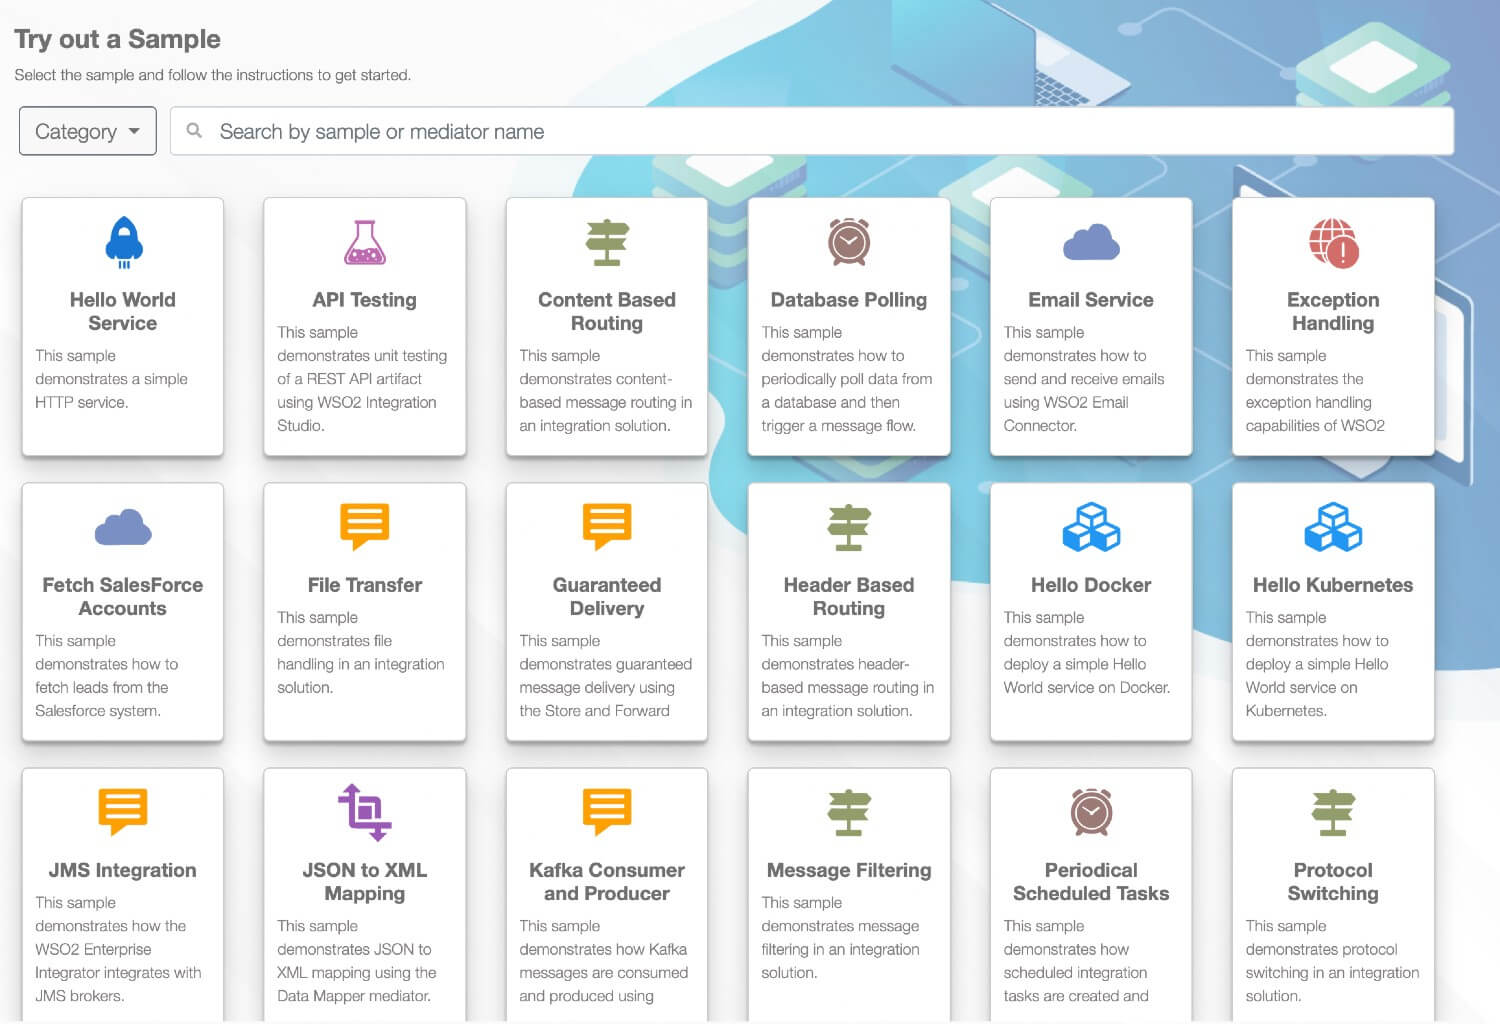
|
| Sample Guide |
The sample guide is a Help pane, which provides documentation on how to use the integration sample scenarios. You can follow the instructions given in the guides to deploy and test each sample scenario. 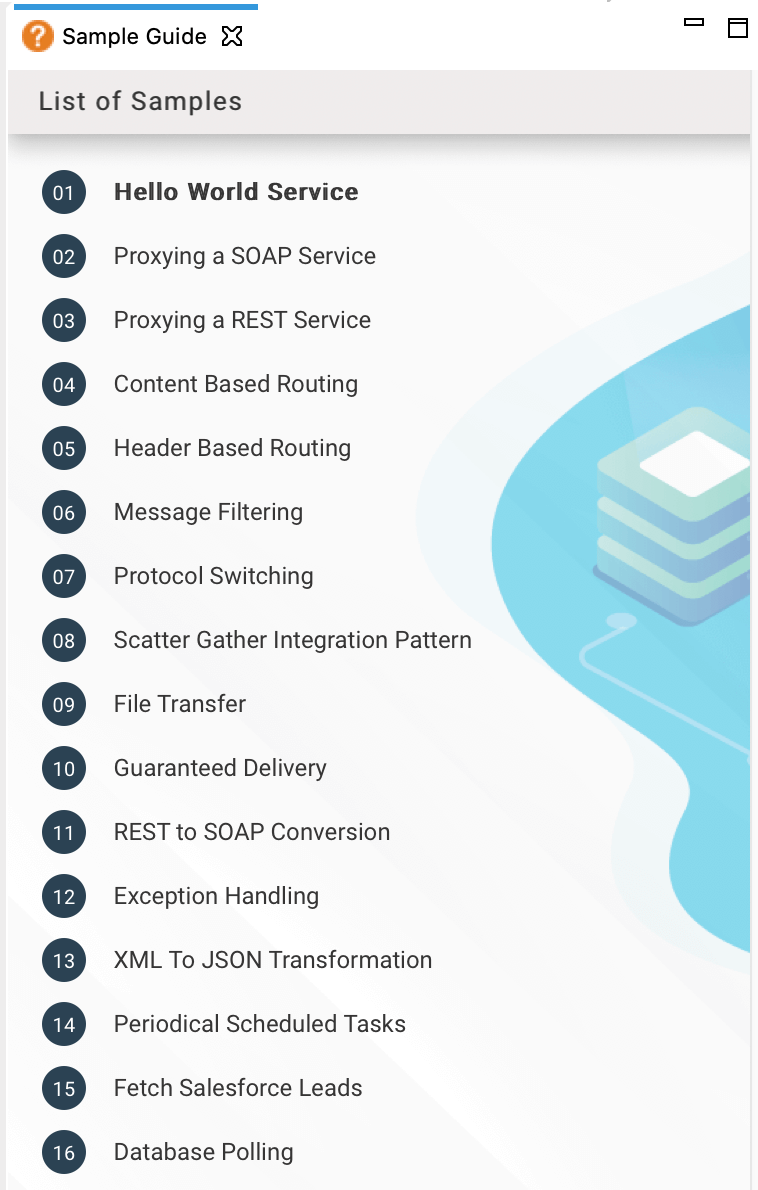
|
Once you have created the required set of projects and artifacts, you can start working with the project directories and artifact editors shown below.
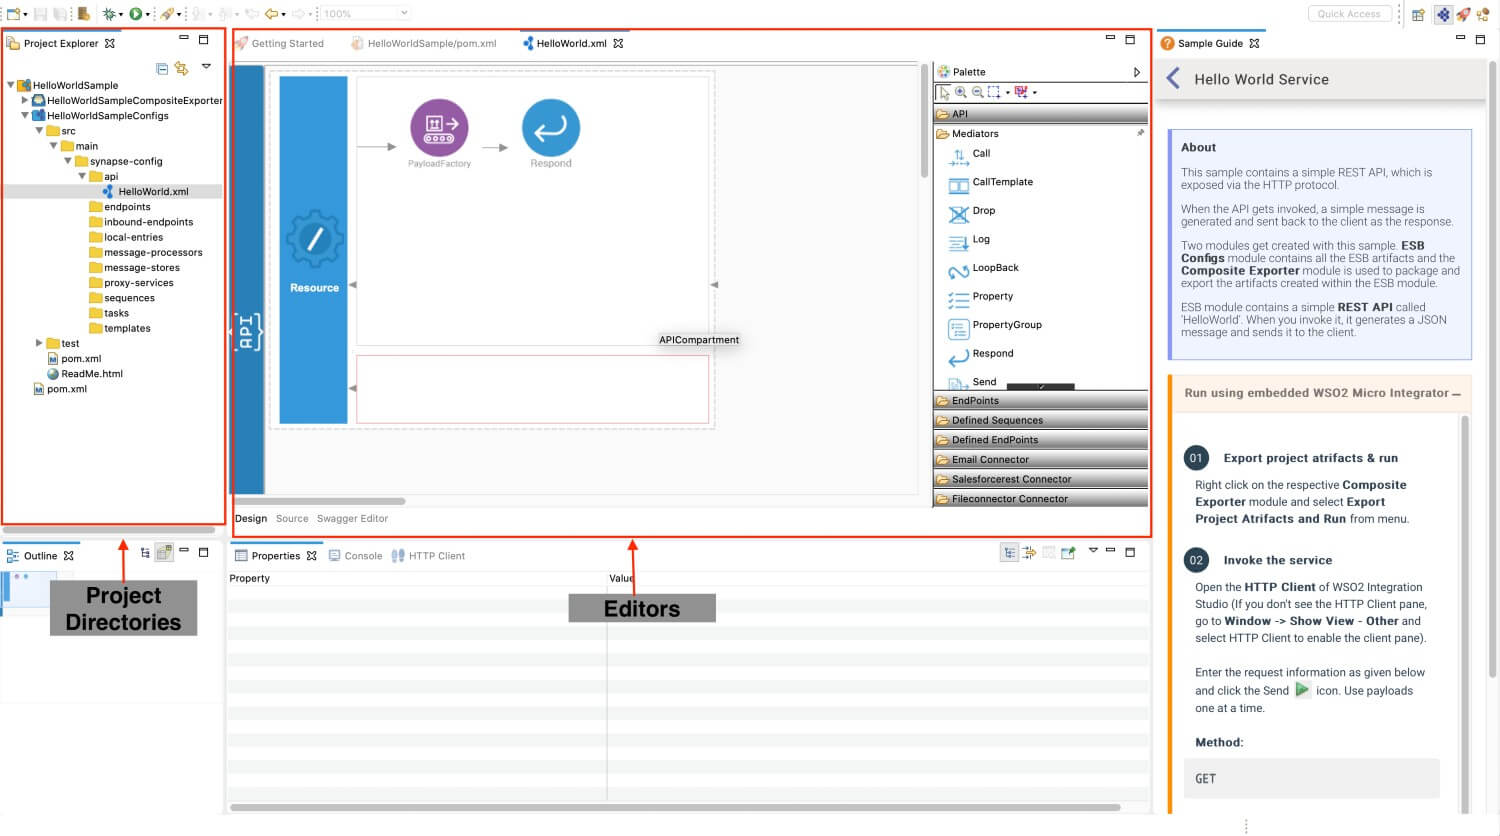
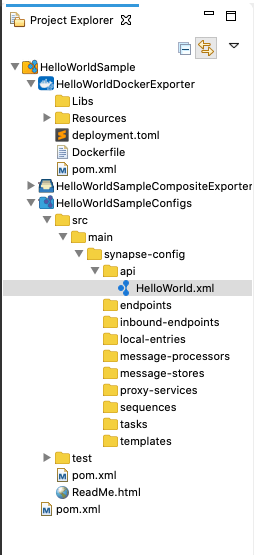
Project Explorer
The project explorer provides a view of all the project directories created for your integration solution. Shown below is the project explorer of a working project.
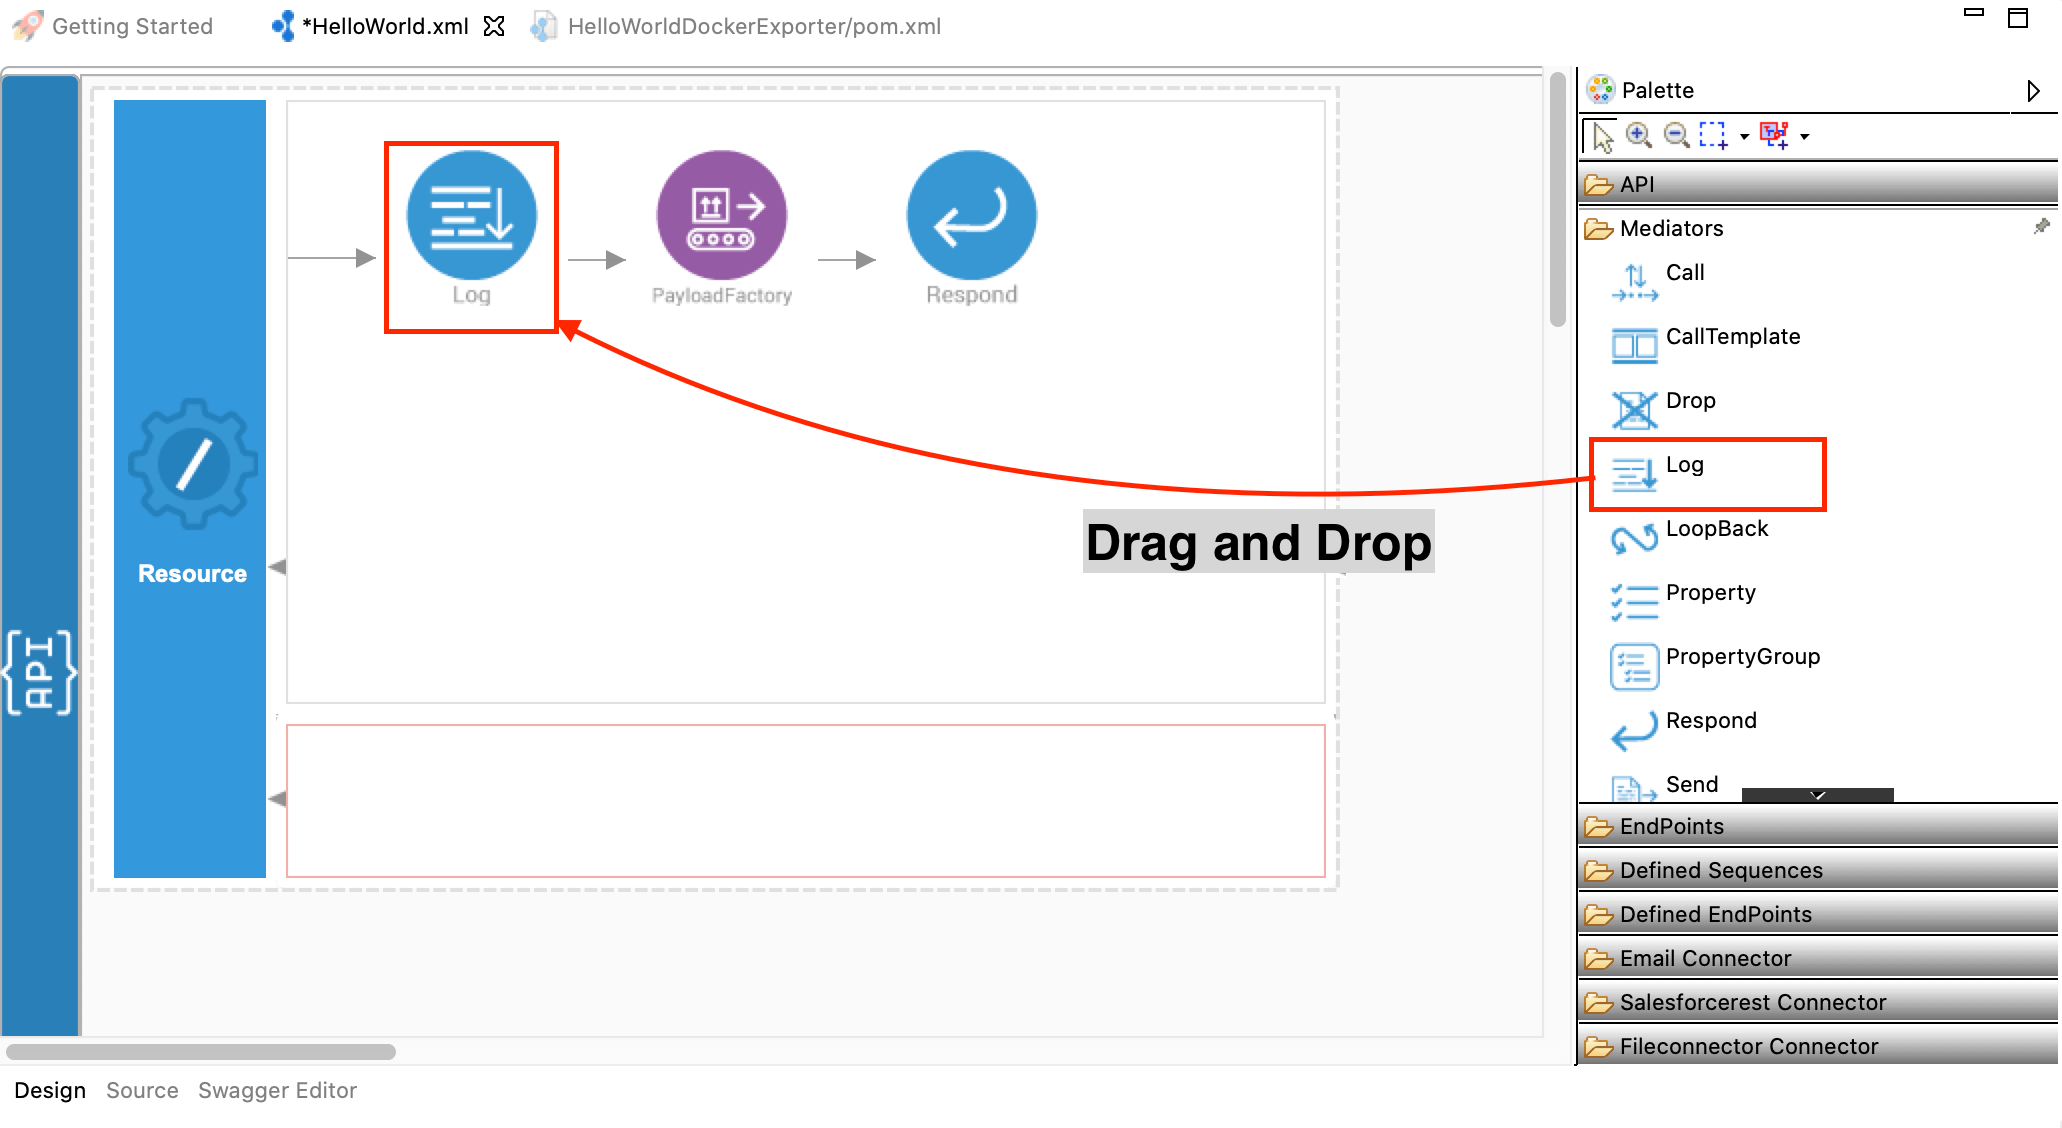
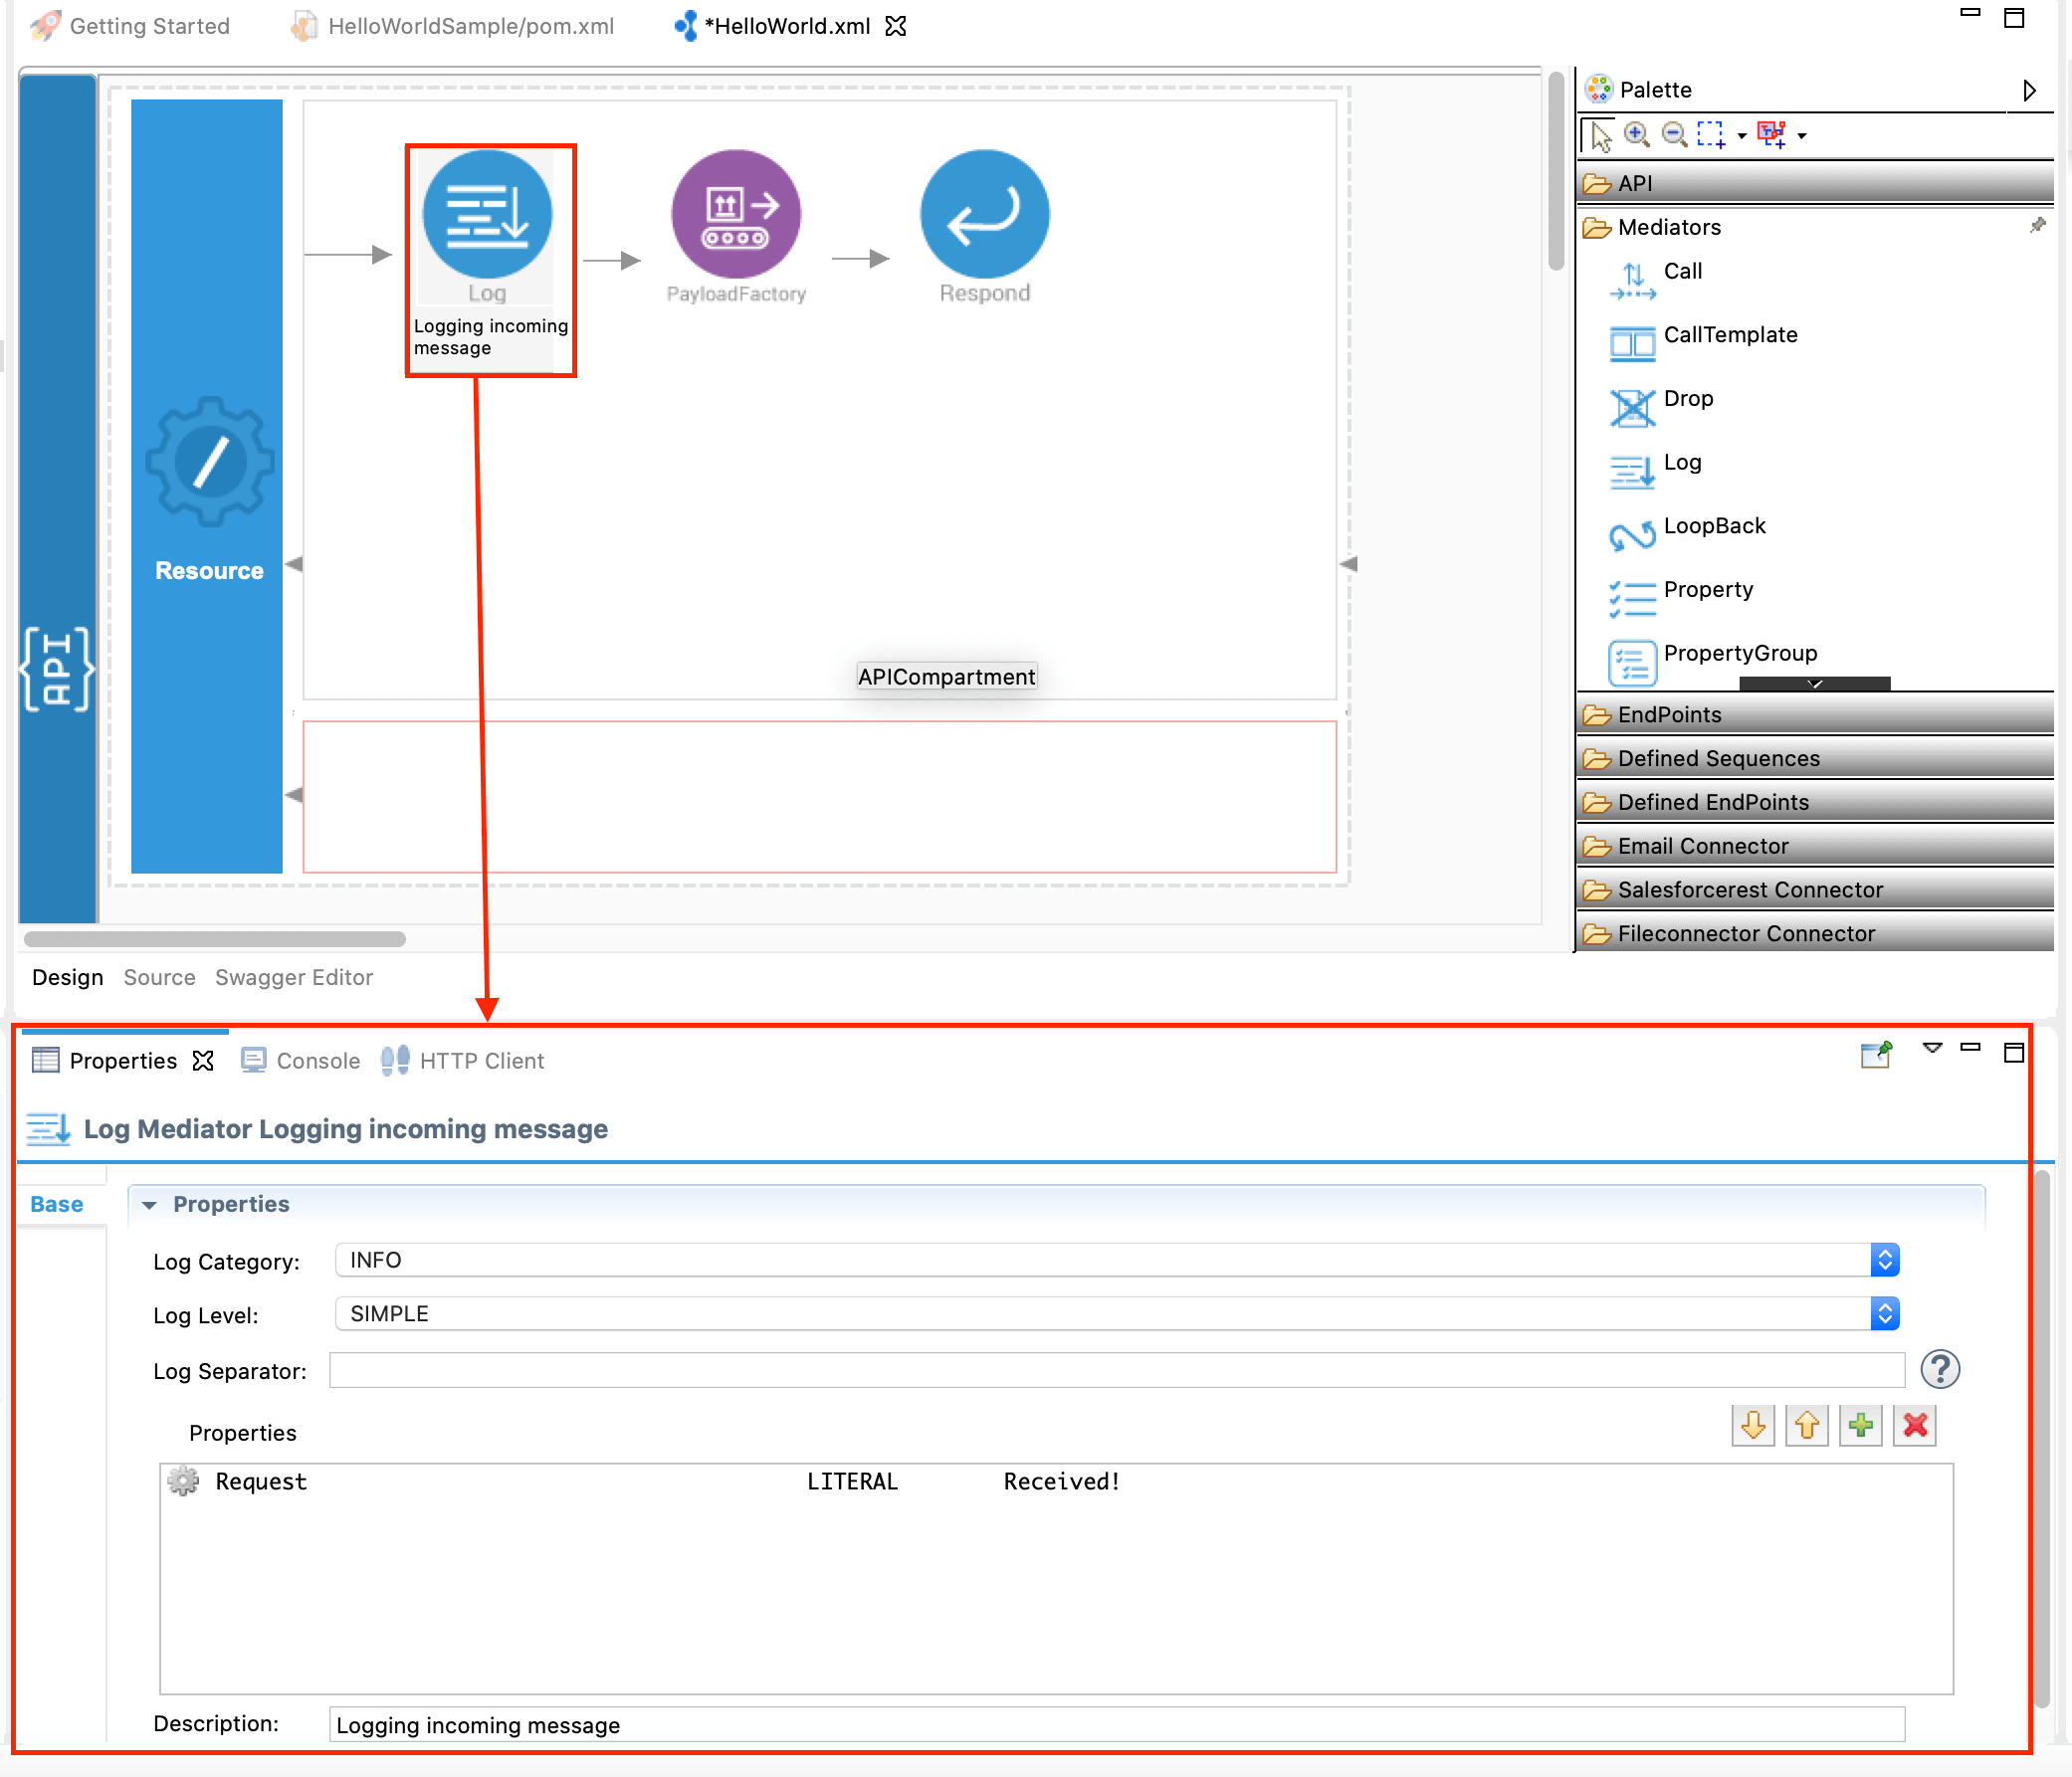
Graphical Editor
The graphical editor of WSO2 Integration Studio is a drag-and-drop editor for designing integration workflows. To access the graphical editor, you must first create a REST API, Proxy Service, Inbound Endpoint, or Sequence artifact.
Once you open the graphical editor, the Palette to your left lists all the integration artifacts that you can use. You can drag the required artifacts to the canvas on your right and design your integration flow. The parameters for each artifact can be configured using the Properties view.
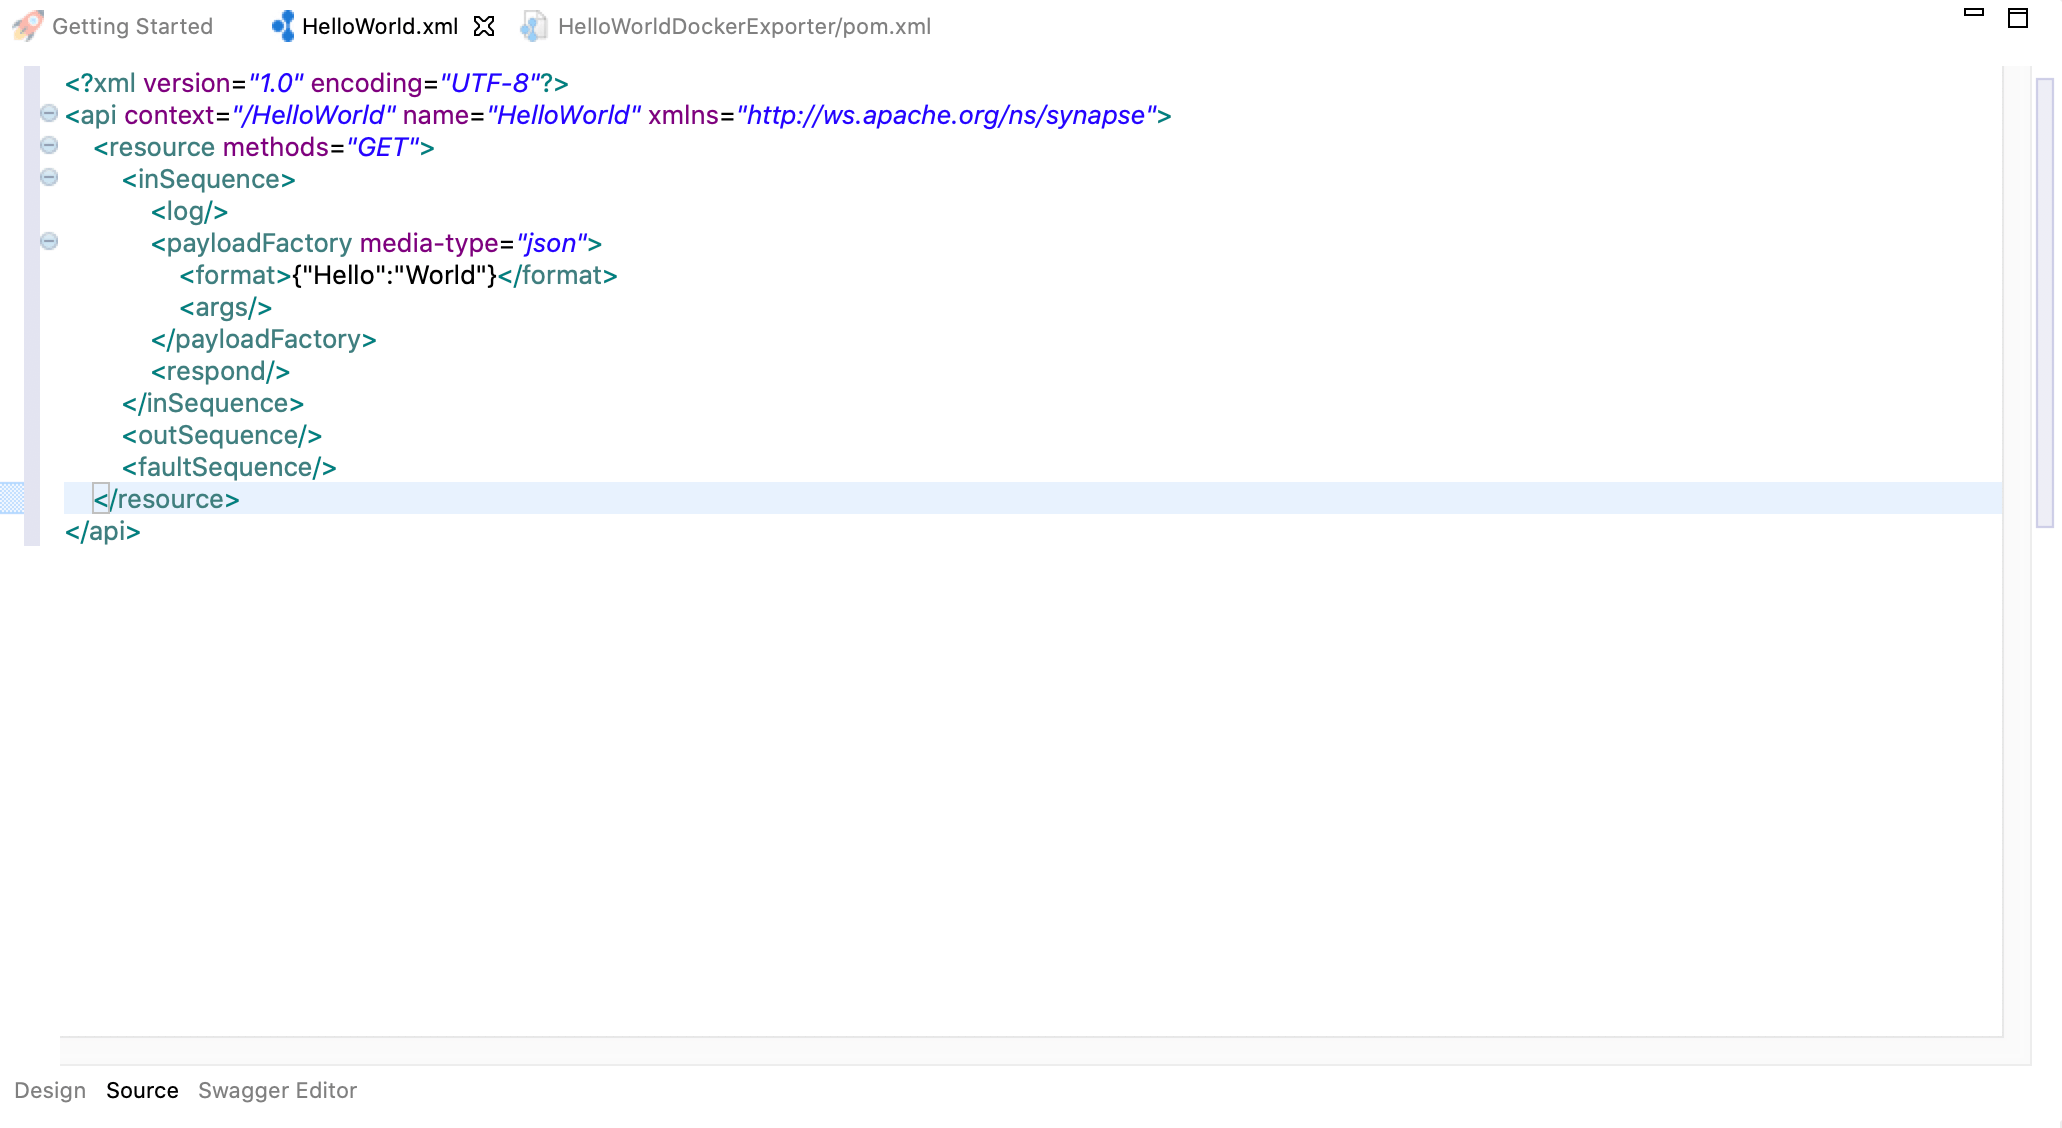
Source Editor
When you open any integration artifact from the project explorer, you will have a source editor in addition to the graphical editor. This editor allows you to write or edit your integration solution using the source code (synapse).
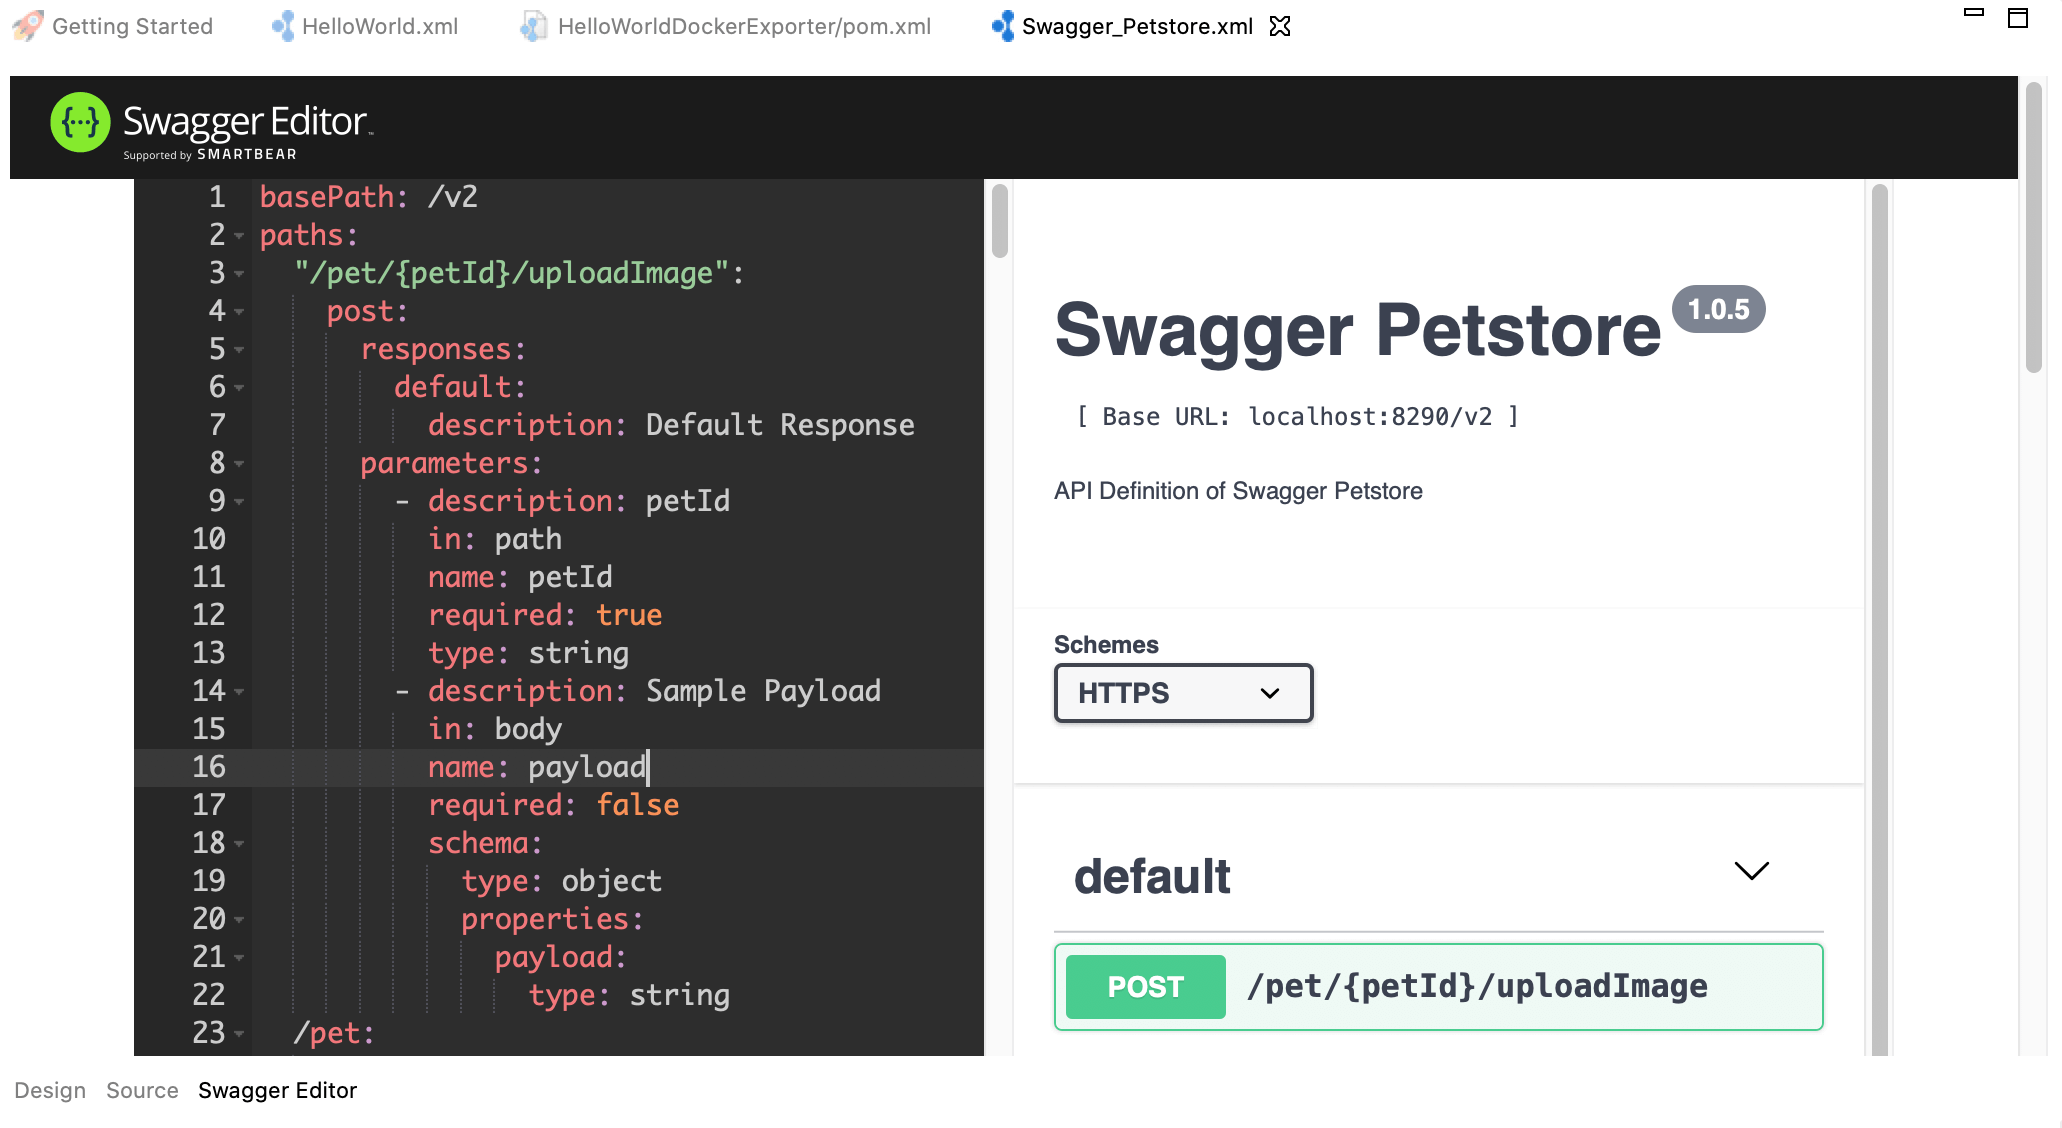
Swagger Editor
The swagger editor is available when you create a REST API. This is in addition to the graphical editor and the source editor. The swagger editor can be used to write or edit your integration solution using the swagger definition. The Swagger UI allows you to visualize and interact with the REST API.
Properties
The properties view allows you to configure the properties and parameters that define the integration artifacts in your integration flow. When you double-click an artifact in the graphical editor, the Properties view for that artifact will open. Alternatively, you can right-click the artifact and click Show Properties to open this view.
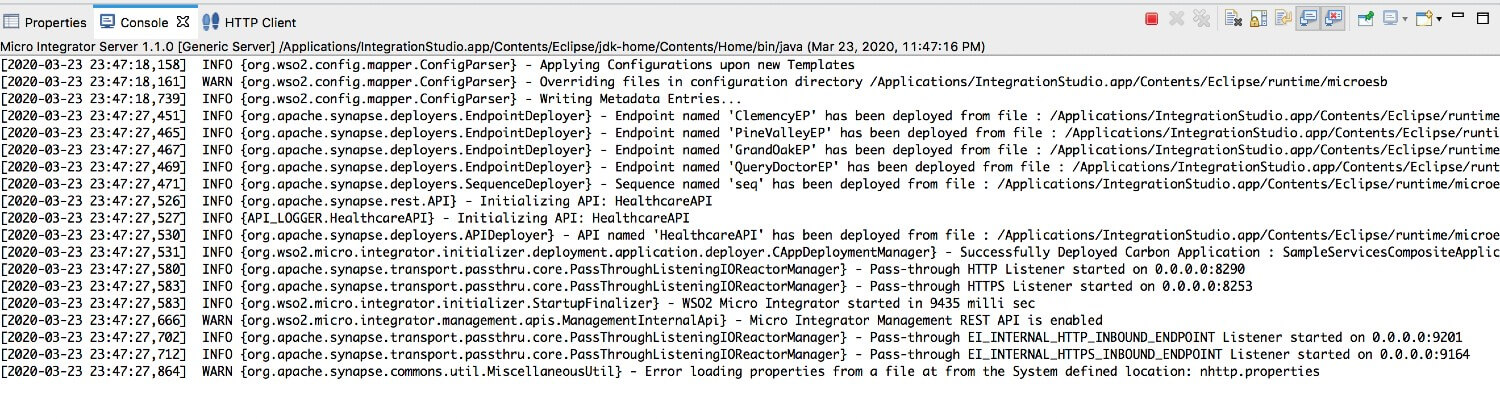
Console
The Console view displays a variety of console types depending on the type of development and the current set of user settings. The three consoles that are provided by default with WSO2 Integration Studio are:
- Process Console: Shows standard output, error, and input.
- Stacktrace Console: Well-formatted Java stack trace with hyperlinks to specific source code locations.
- CVS Console: Displays output from CVS operations.
HTTP Client
An embedded RESTful HTTP client is shipped with WSO2 Integration Studio to support testing. Once you have deployed your integration solutions in the Micro Integrator server, you can invoke the solutions using this client within WSO2 Integration Studio.
![]()
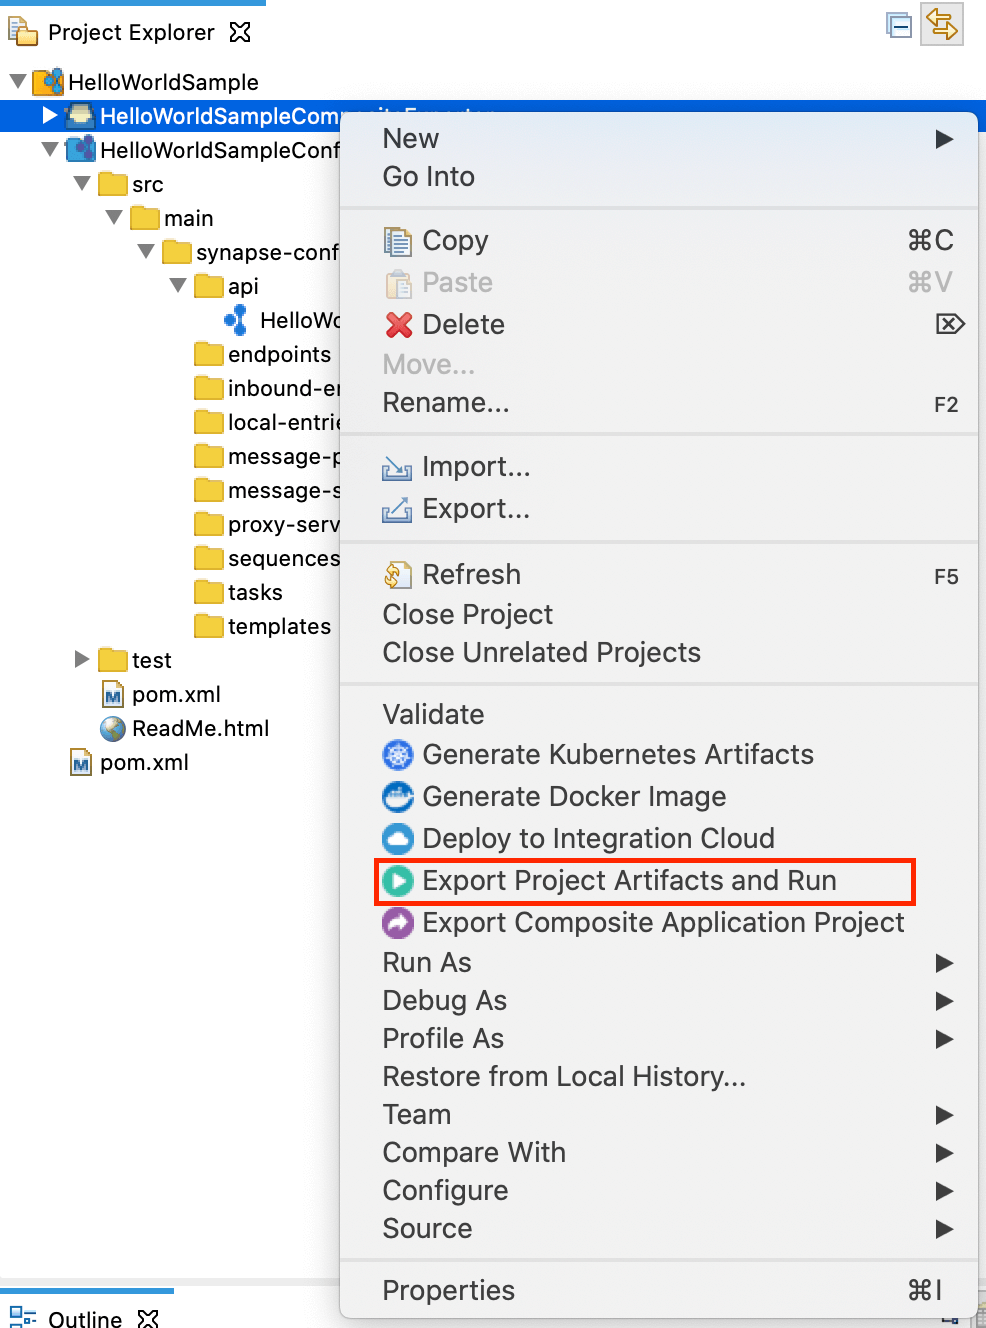
Embedded Micro Integrator
WSO2 Integration Studio is shipped with an embedded Micro Integrator server, which allows developers to deploy and run integration artifacts during the development phase. To deploy the artifacts and to run the embedded Micro Integrator, right-click the composite application project (which includes your artifacts) and click Export Project Artifacts and Run.
Find out more about using the embedded Micro Integrator.
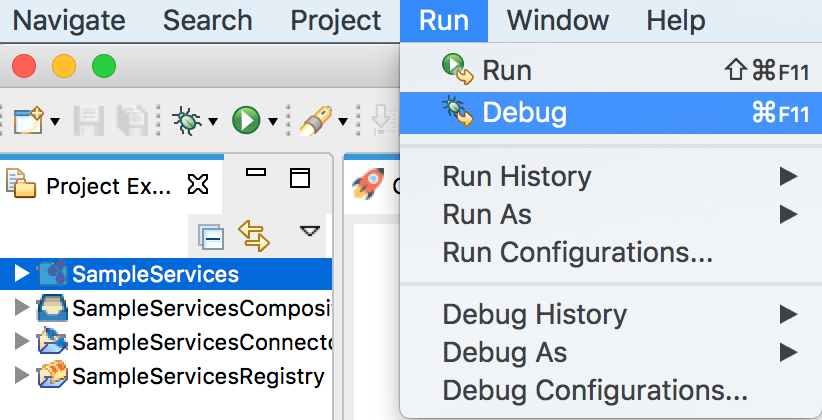
Inbuilt Debugging Capabilities
WSO2 Integration Studio is shipped with mediation debugging capabilities, which allows developers to debug an integration project using the tool. The embedded Micro Integrator server and debugging capabilities enable developers to comprehensively test, debug, and improve integration solutions before the artifacts are released to a production environment.
You need to select your integration project in the project explorer and go to Run -> Debug as shown below. Find out more about mediation debugging.
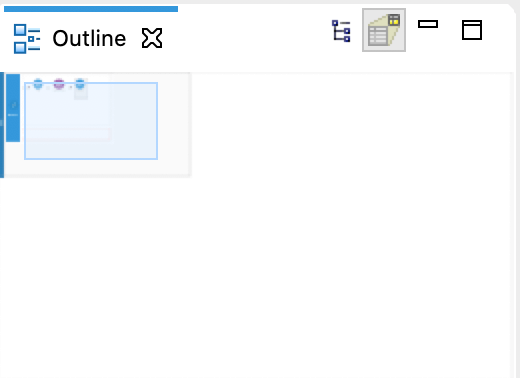
Outline
The Outline view displays an outline of a structured file that is currently open in the editor area and lists structural elements. It enables you to hide certain fields, methods, and types, and also allows you to sort and filter to find what you want. The contents of the outline are editor-specific. For example, in a Java source file, the structural elements are classes, fields, and methods. The contents of the toolbar are also editor-specific.
What's Next?
- See Installing WSO2 Integration Studio for installation instructions.
- See Working with WSO2 Integration Studio for more information on how to setup and use tooling.
- See Troubleshooting WSO2 Integration Studio for information on troubleshooting errors you may run into while using WSO2 Integration Studio.