Monitoring dashboard
Overview
API Error Analysis
Error page allows users to identify faulty and erroneous API(s) and isolate the cause. API Errors or Faulty behaviors include the throttled counts, 4xx, and 5xx responses from the API backend. Widgets on this page are helpful to identify the API(s) and Application(s) with the most errors for each mentioned type. A historical summary could also be viewed per API or per Application.
Top Error Summary
A pie chart is dedicated to each of the error types namely, 4xx, 5xx, faulty, and throttled count to represent the top APIs or Applications along with the error hit percentage out of total hits. Here you can toggle between APIs and Applications using the selection panel. Also, you can limit the number of APIs or Applications, adjusting the limit selector. Clicking on the APIs or Applications share on the pie chart will navigate to the Error Summary widget.
The following image shows the information can be found from this widget.
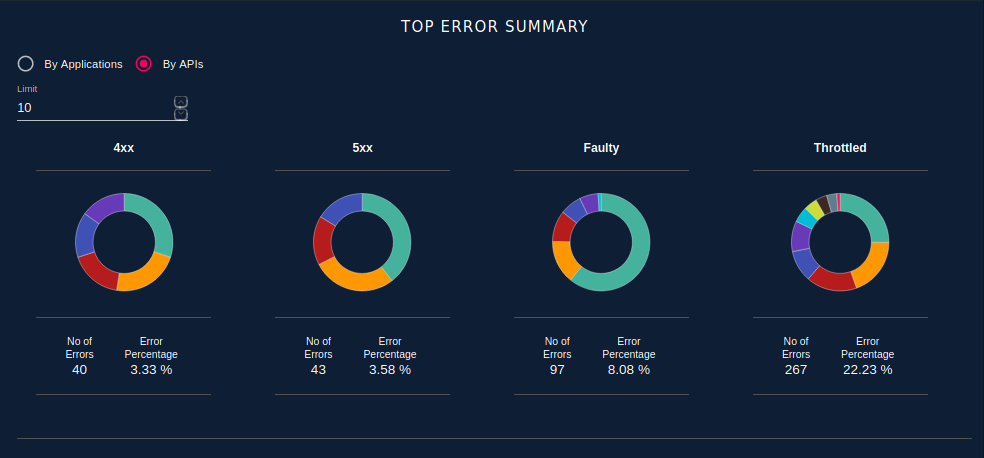
Note
Here the No of Errors represents the number of occurrences of that particular error type and Error Percentage represents the percentage of particular error hits out of the total API requests for any API during the selected time period.
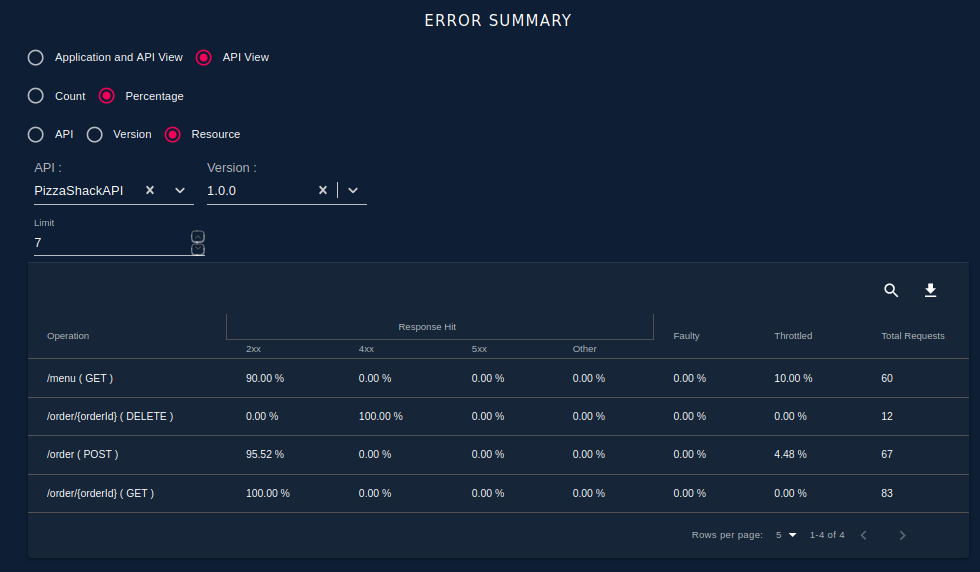
Error Summary
Provides the break down of total hits into each of the error types namely 4xx, 5xx, faulty, throttled, and success count for each of the APIs. You can view these statistics, either per API wise or Application and API pairwise by selecting the preferred type in View Selection Panel. Further, you can set the granularity for statistics choosing between API, Version, and Resource in Granularity Selection Panel. Also, you can view the statistics in terms of count or percentage by choosing the preferred option in View Type Selection Panel.
Once you set the required options you have to select the values for the above option keys. For example, if you select API View, Percentage, and Resource in the selection panels above then you have to select a specific API, Version, and Operation in the corresponding drop-down. Also, you can limit the number of results by adjusting the limit selector.
As a default, this table shows the results per API. When you click on an API, the table would render the statistics for available versions of that API, thereafter when you click on a version, the table would render the statistics for available resources of that specific API version. Finally, when you click on one of the resources, you would be navigated to the Error Summary Over Time widget where you can find the historical variation of error count for that particular resource.
The following image shows the information can be found from this widget.
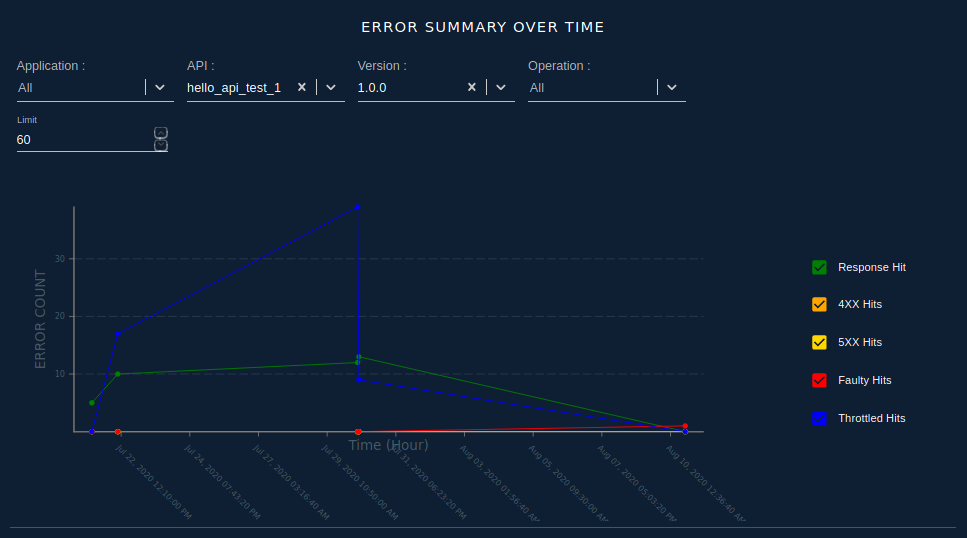
Error Summary Over Time
A line chart showing the overtime error count variation of selected API or set of APIs. As a default, it shows the aggregated error count variation among all the APIs. You can use the available drop-downs to select the specific API with different granularity levels of Version and Resource. Using the interactive legend, users can select the error components they need to compare. For example, disabling the Response Hit would reveal the finer variation between other types of errors.
The following image shows the information can be found from this widget.
API Latency Analysis
Latency page allows users to identify slow APIs and isolate the cause for their slowness. A single API has different stages of processing like applying security, Throttling, executing Mediation sequences, and executing the backend logic where each stage adds up to the latency of the overall API call. Charts on this page help to identify where the delay is coming from and how it varied historically.
API Latency Summary
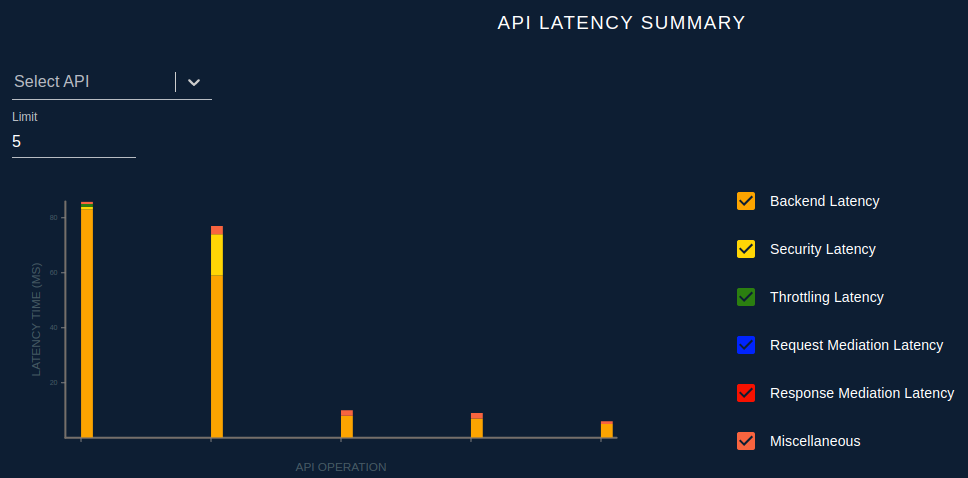
A stacked bar chart showing the latencies of the slowest resources arranged in descending order. Different latencies of a single API call like backend latency, security latency, Throttling latency, Mediation latencies, are shown in bars with different colors. Using the interactive legend, users can select the Latency components they need to compare.
For example, disabling one Backend Latency would reveal the finer variation between other types of Latencies. The input filters can be used to limit the bars according to the APIs, Versions, and Resources. The limit selector can be used to change the number of bars being displayed. Clicking on a bar would take to the API Latency Over Time chart.
The following image shows the information can be found from this widget.
API Latency Over Time
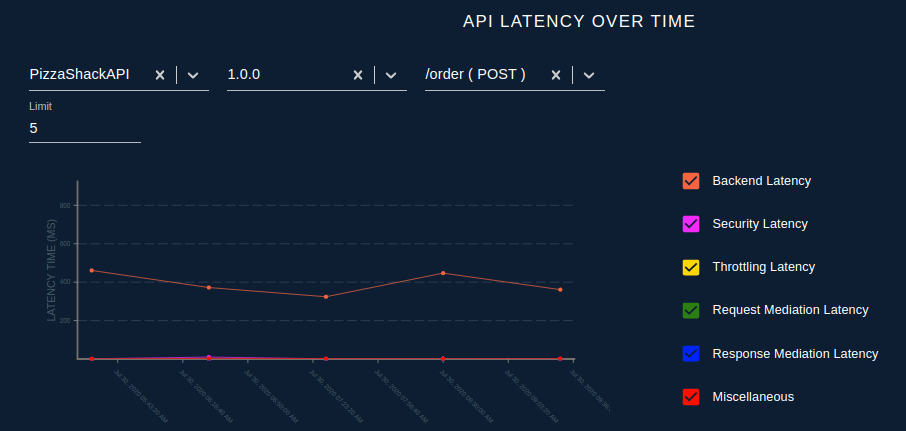
A stacked line chart showing the overtime latency variation of a selected API resource. You can use the available different drop-downs to select the specific API resource and limit the data points to be visualized. Similar to the previous widget, the interactive legend allows a comparison between specific latency components.
The following image shows the information can be found from this widget.
API usage analysis
API usage summary
This provides aggregated API invocation count in a selected time period. When an API request is received to the API gateway there can be multiple validations before the request goes to the backend service. Ex like API can be successfully forward to the backend or rejected due to authentication failure, throttling, or in case of internal errors/faulty. This widget successful, faulty, and throttled out API requested counts are visualized. If an API request dispatched the backend and received a response, consider as a successful request. In case a runtime error or a backend connection error occurred consider them as faulty requests. Currently, only the runtime or backend errors consider as faulty and authentication or throttled out requests don’t consider as faulty. If a request is throttled out due to any throttling level policy consider as throttled out request. So if a request comes to the gateway it can be either success, faulty, or throttled out. Hence total request GW received should equal success + faulty + throttle out.
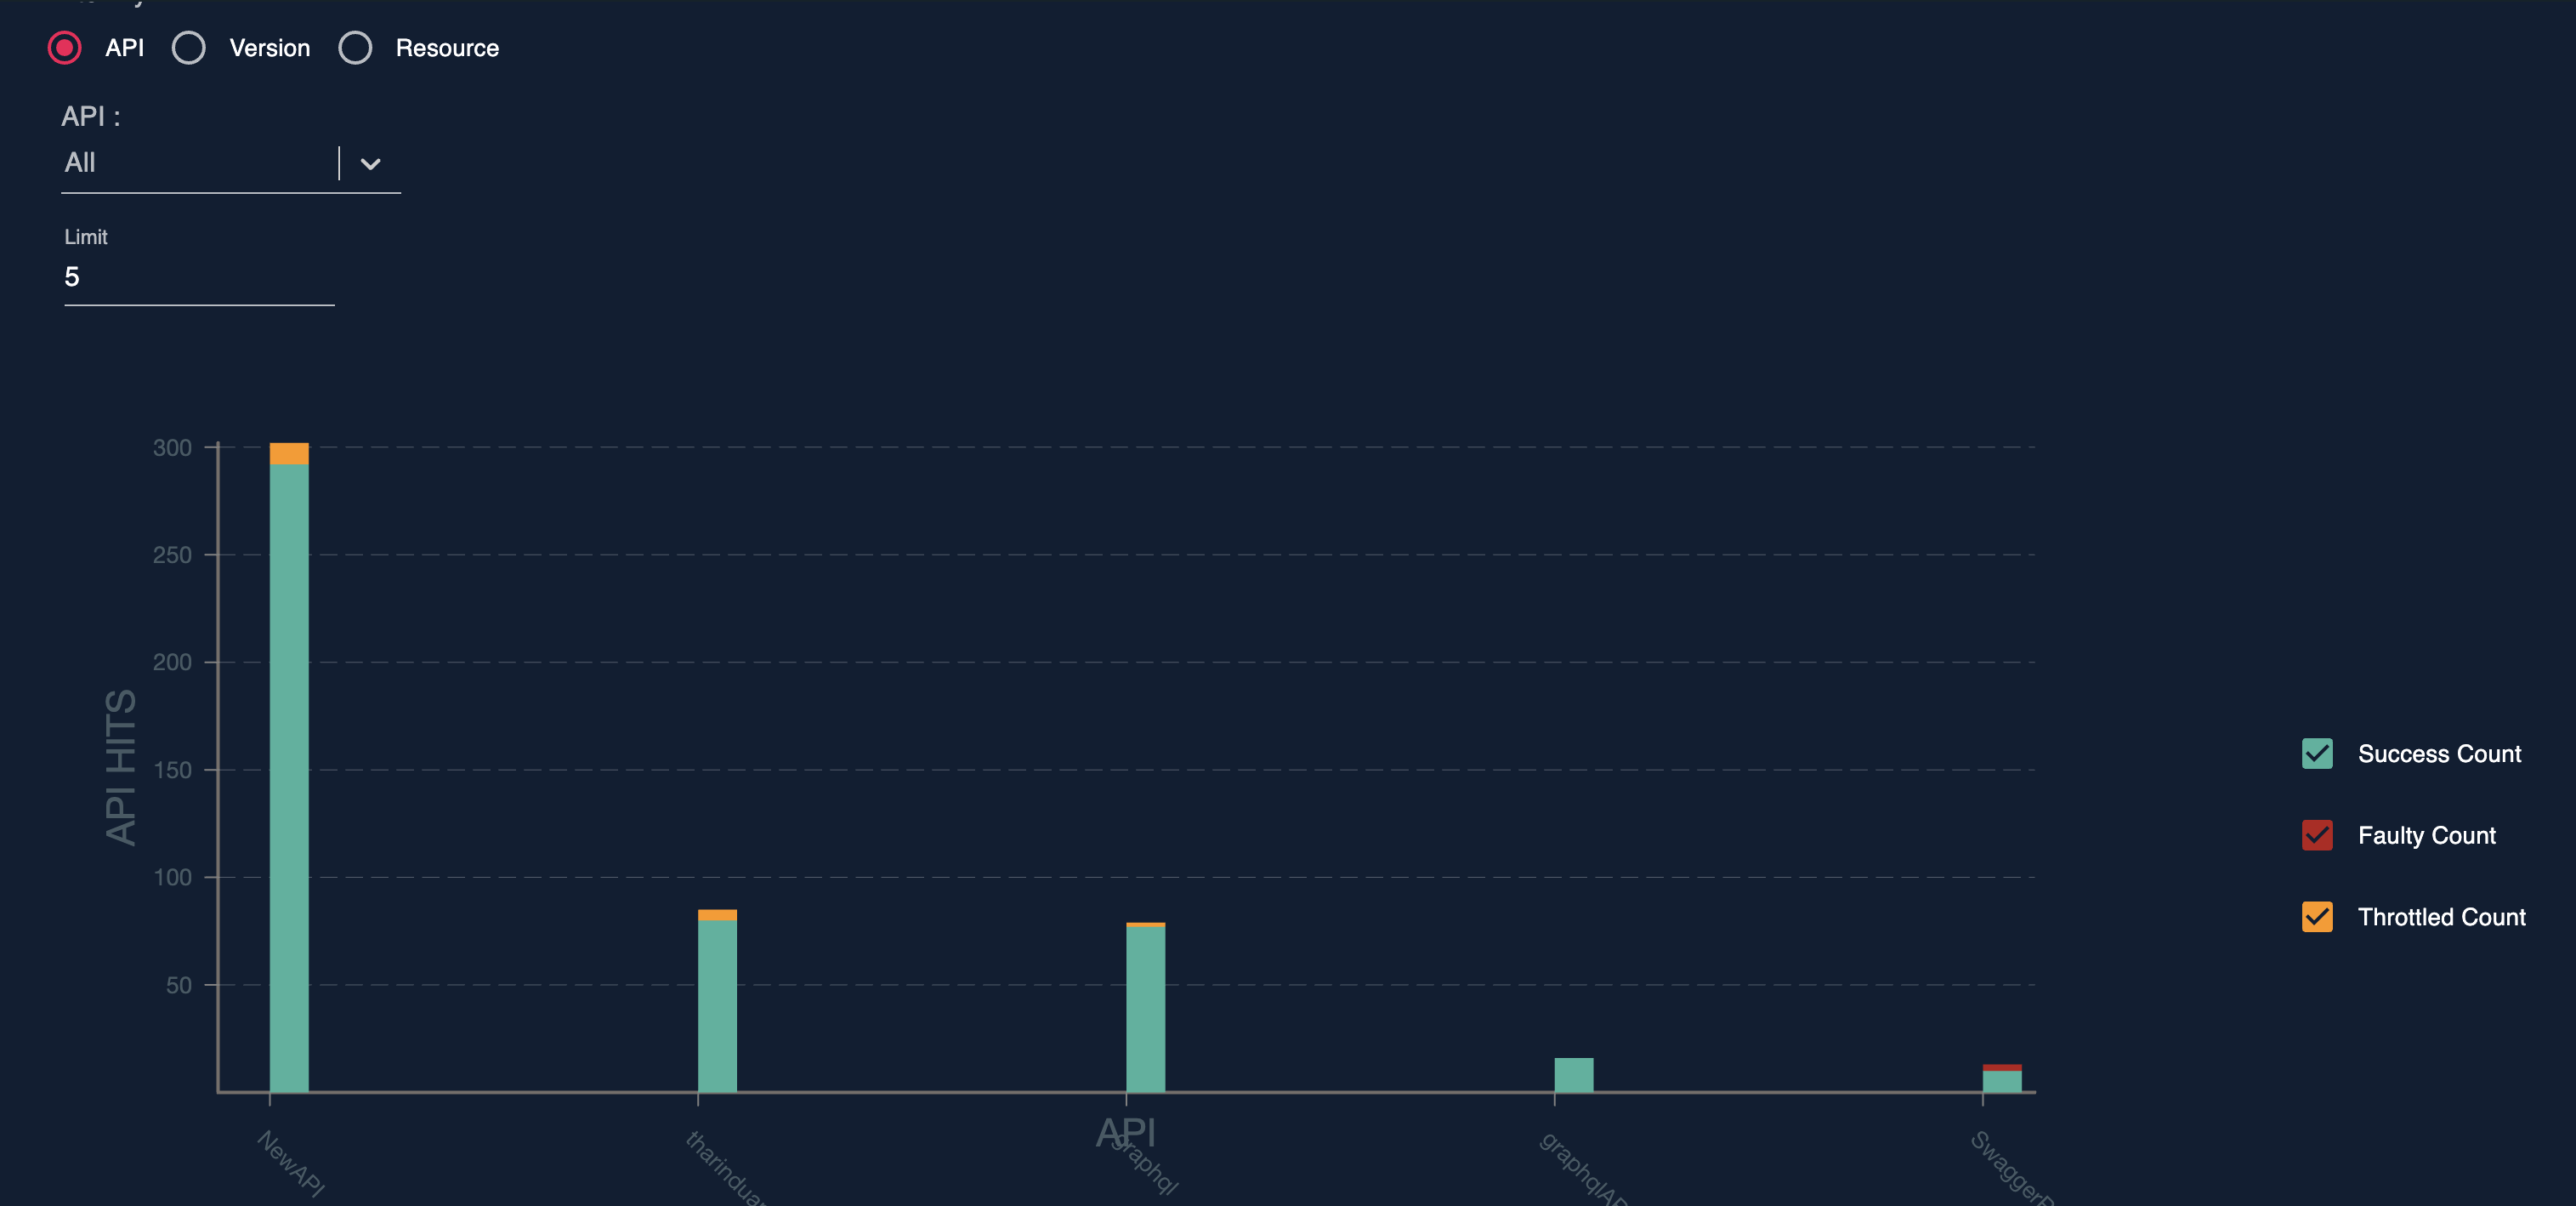
Usage summary can be broken into APIs, Versions, and Resources level. Drill down can be changed by selecting the provided radio buttons. By clicking on the bars can change the drill down from API, Versions, and Resources. Users can decide the expected summarization of the result data. The initial view is set to API and usage data are loaded against the APIs. When the view type is selected to version aggregating are done and return data against the version. Resource view types also work in the same manner.
There 3 separate stacked bars in each bar to represent it’s a success, faulty, and throttled out count. These are represented in a stacked bar chart for easily compare against these dimensions. Any dimensions (success, faulty, and throttled) can be enabled/disabled using the provided tickbox for a better view.
Version and Resource wise aggregations help to point out the issues or usage in depth. Filters support APIs, Version, and resources when a user needs to check data on a specific API when there are multiple APIs, Version, or Resources. Click on a specific data unit or bar in the chart redirect the user to the API USAGE OVER TIME widget for further analysis.
API usage over time
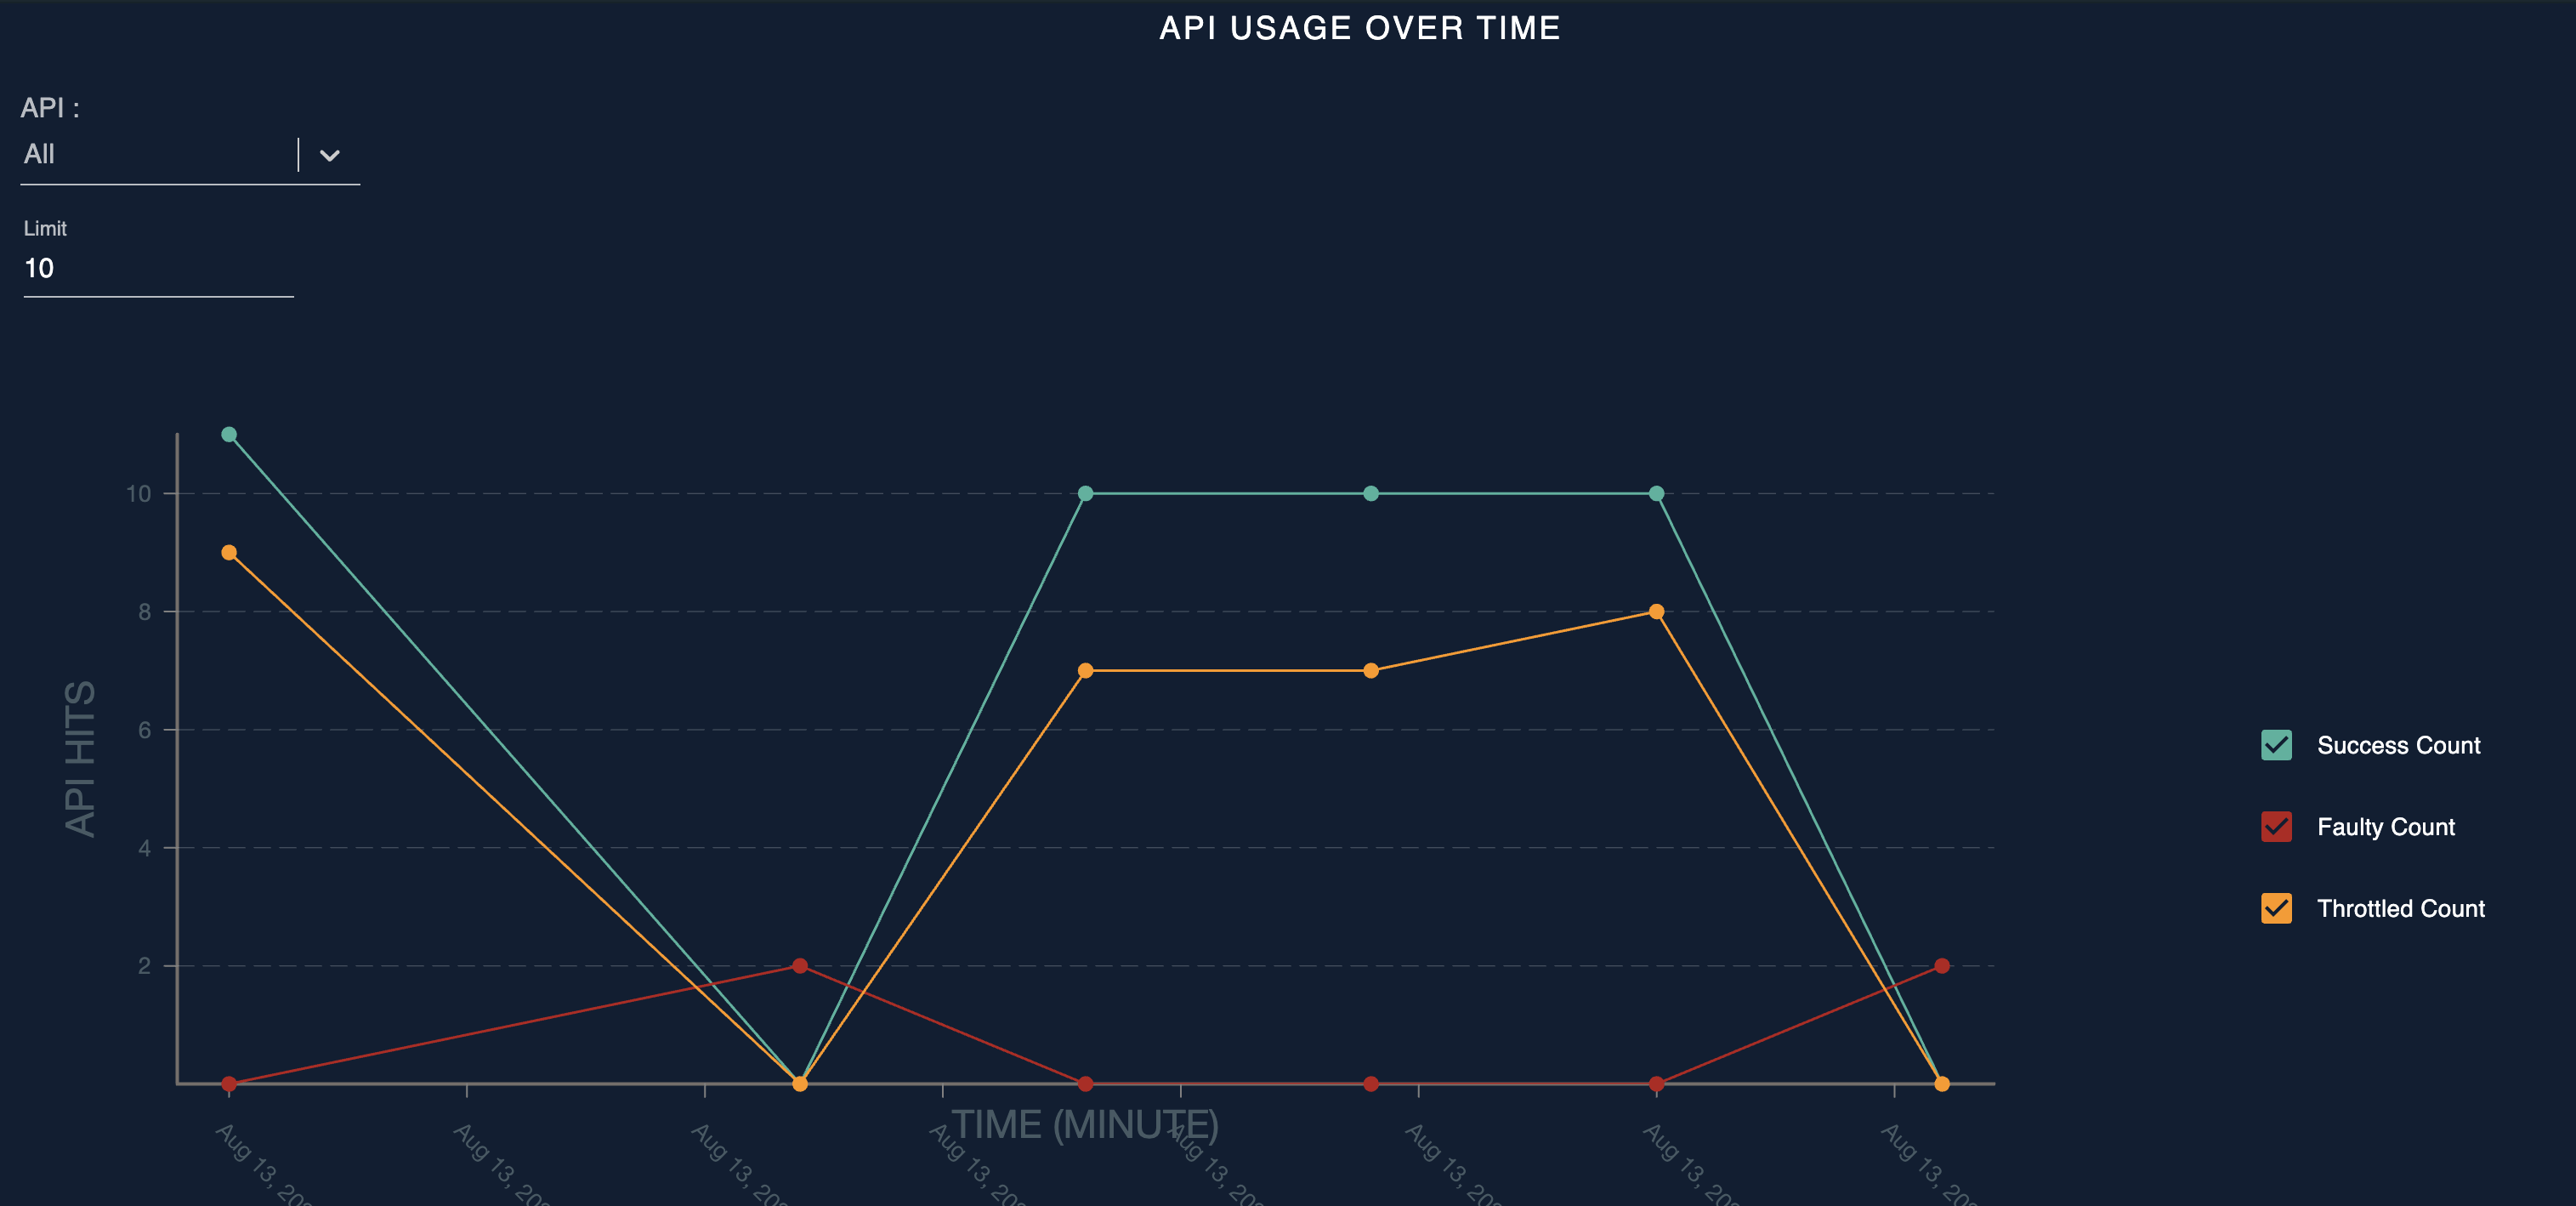
This widget provides the same information but in a time series. The same data including the success, Faulty, and throttled out usages are plotted as a line chart in this widget. A Time series graph is provided for analytics usage patterns over time. It can be used to identify anomalies and abnormal access patterns.
Example:
Observation:  Sudden drop in the success count and continue the same count
Reason: Connection issue to backend service limitation

Observation:  Multiple spikes in the throttled out a request in over the past few days
Reason: Planned rate limiting is not enough with the application growth
Multiple filtering level support similar to the previous behavior and API, Version and resource level filtering can be applied to drill down to resource level. An issue or pattern can be identified in each version and resource. Similar to the previous chart, the required dimensions can be enabled or disabled to clearly identify the lines.
Viewing API Health and System Alert
Widgets in this section are mainly focusing on the API Health and System related alerts. Details about the generated alerts are shown under these widgets.
API availability summary
Note
In order to view statistics of API Availability widget, it is required to enable alerts as described in Configuring Alerts.
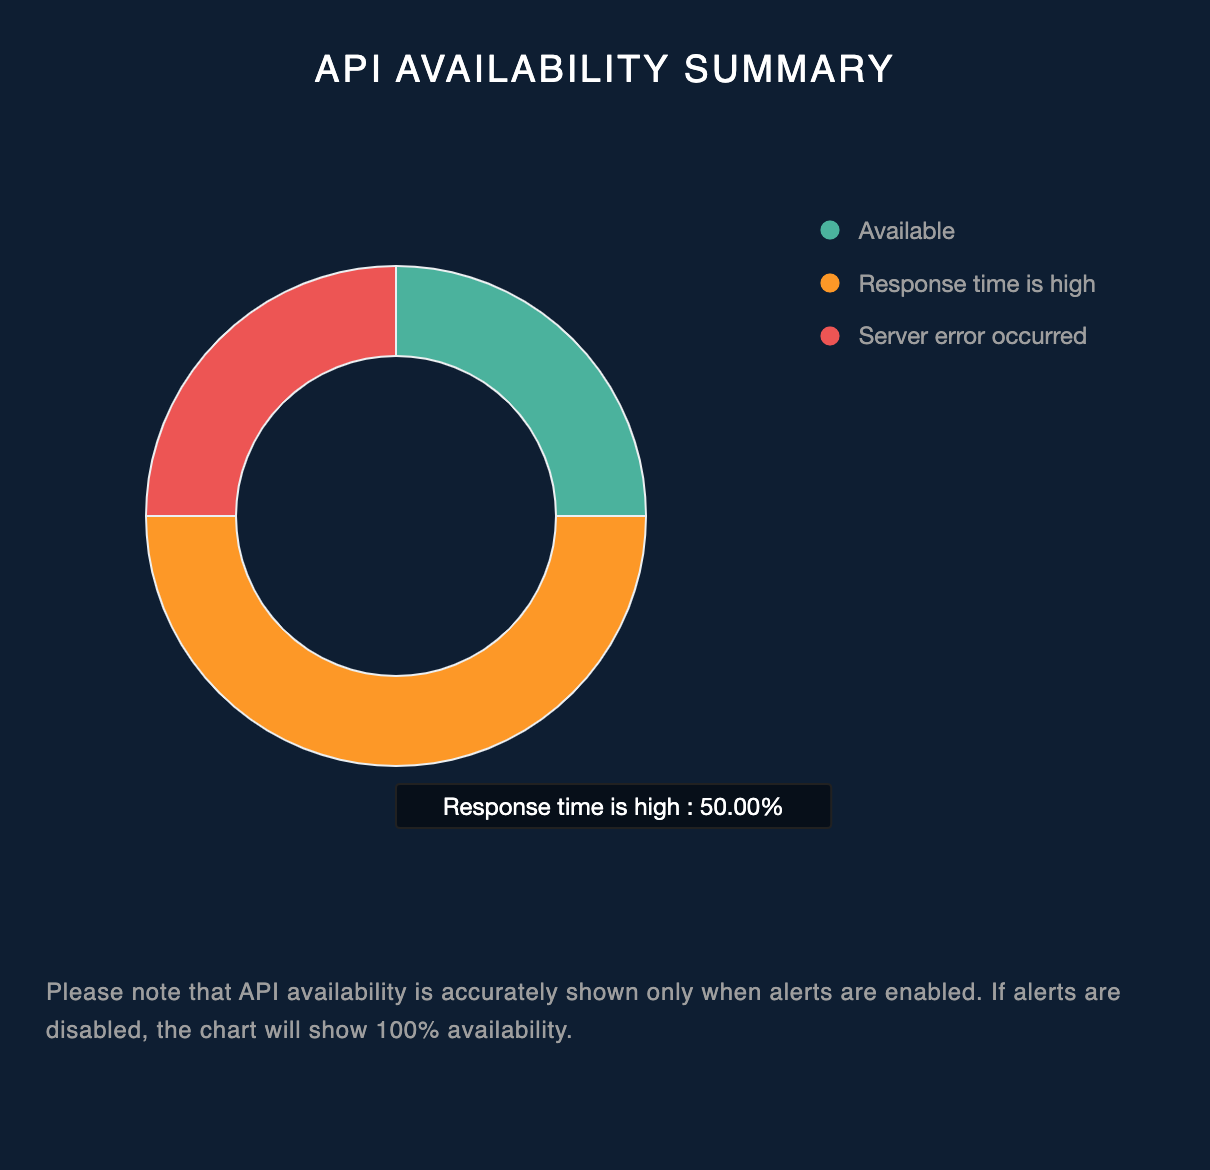
API availability summary widget provides an overall look on the availability of the APIs. It shows whether the API is available(which means API is in good health), whether the Response time of the API is high or whether a server error occurred when accessing the API as percentages for the APIs of the logged in user's tenant. The availability of API statistics are directly related to the Availability of APIs (health monitoring) alert type. Moreover, once the user clicks on one of the available three status for the API availability, it drills down to the API availability widget and shows details of the APIs which have the selected status.
Note
This widget works only when the alerts are enabled. If alerts are disabled, the chart will show 100% availability.
API availability
API availability widget shows detailed view of the availability of the APIs. If the API is in a healthy position it shows Available and if not it shows Limited as the status.
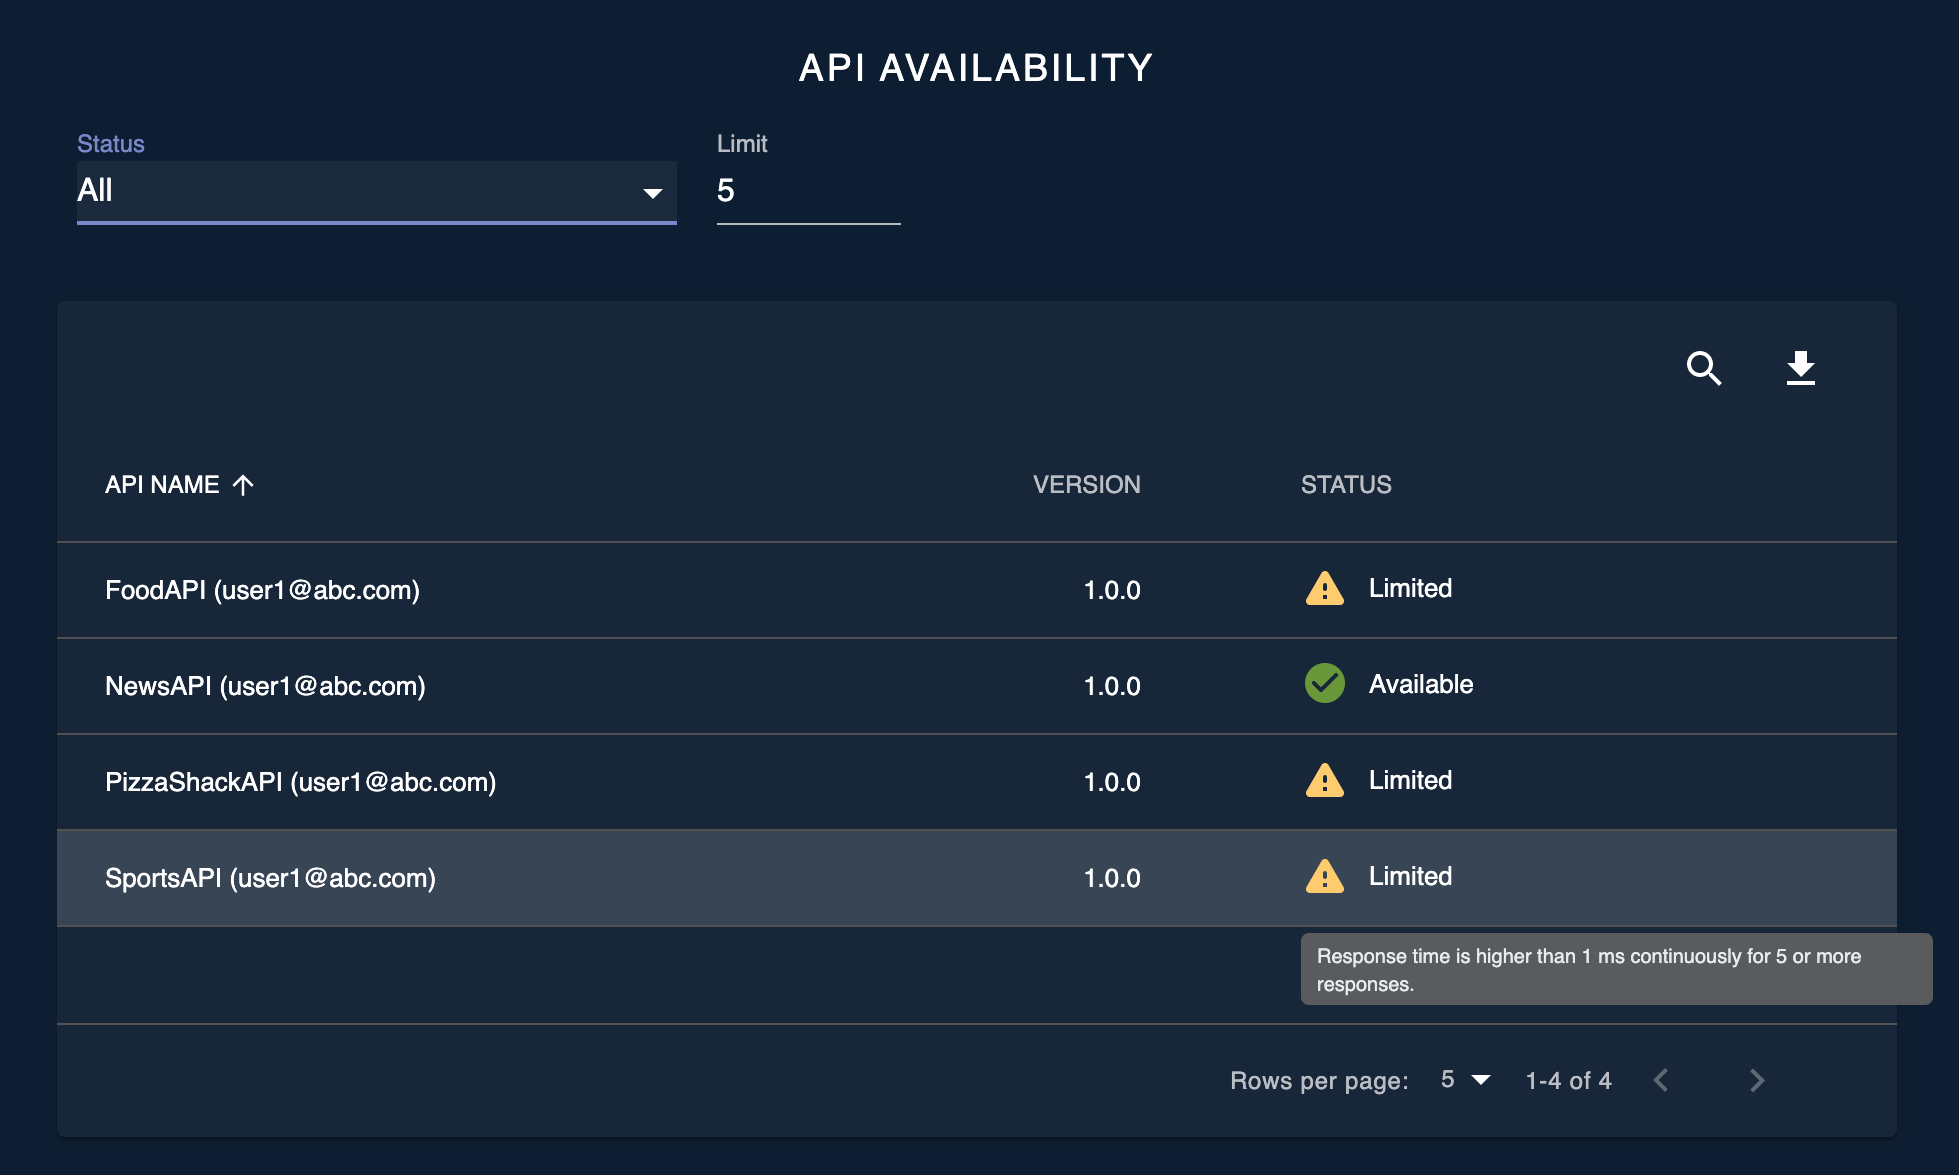
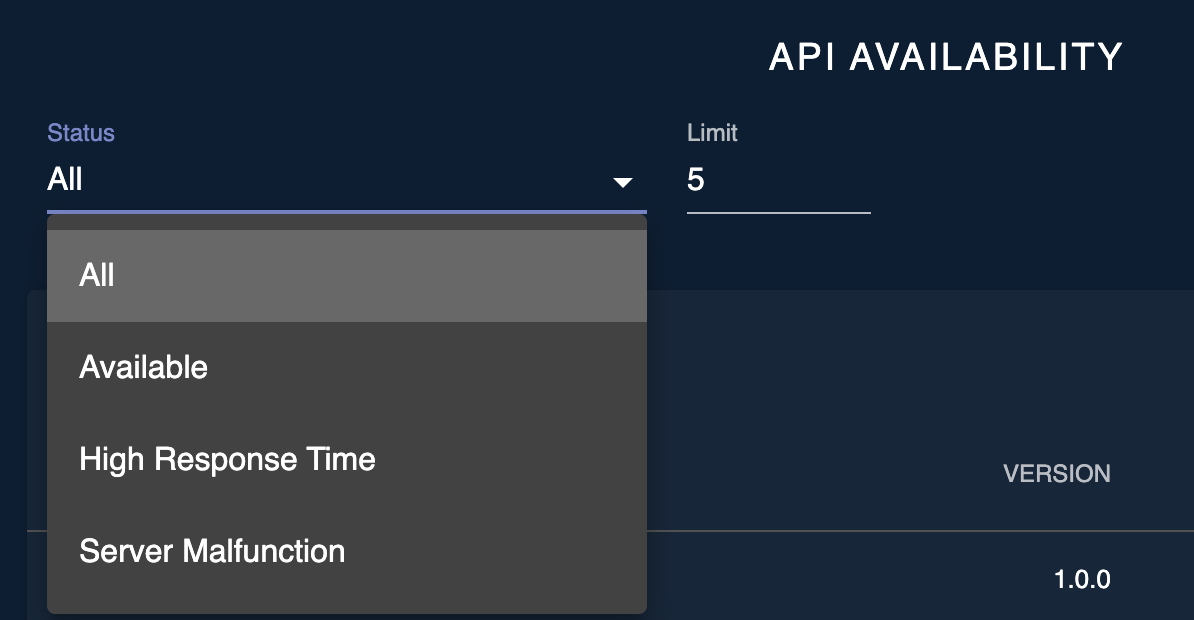
Availability of the APIs can be queried by the status(Available, High Response Time, Server Malfunction).
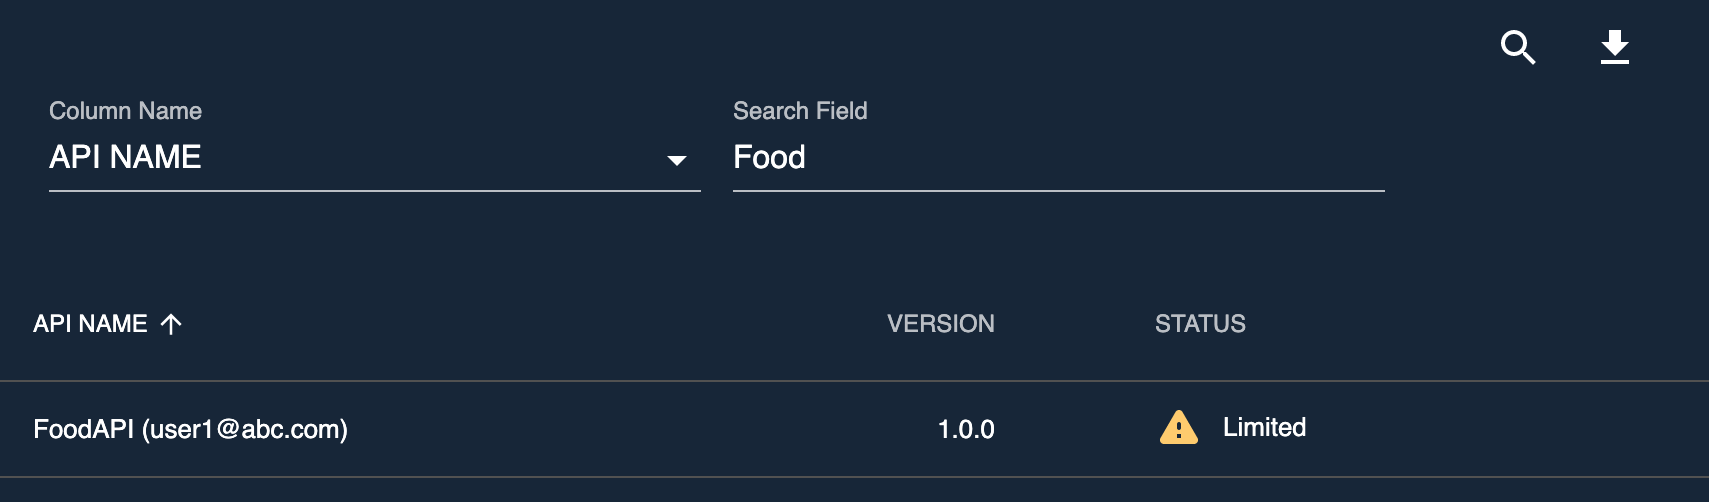
Furthermore, results can be filtered by API NAME, VERSION or STATUS by clicking on the search icon
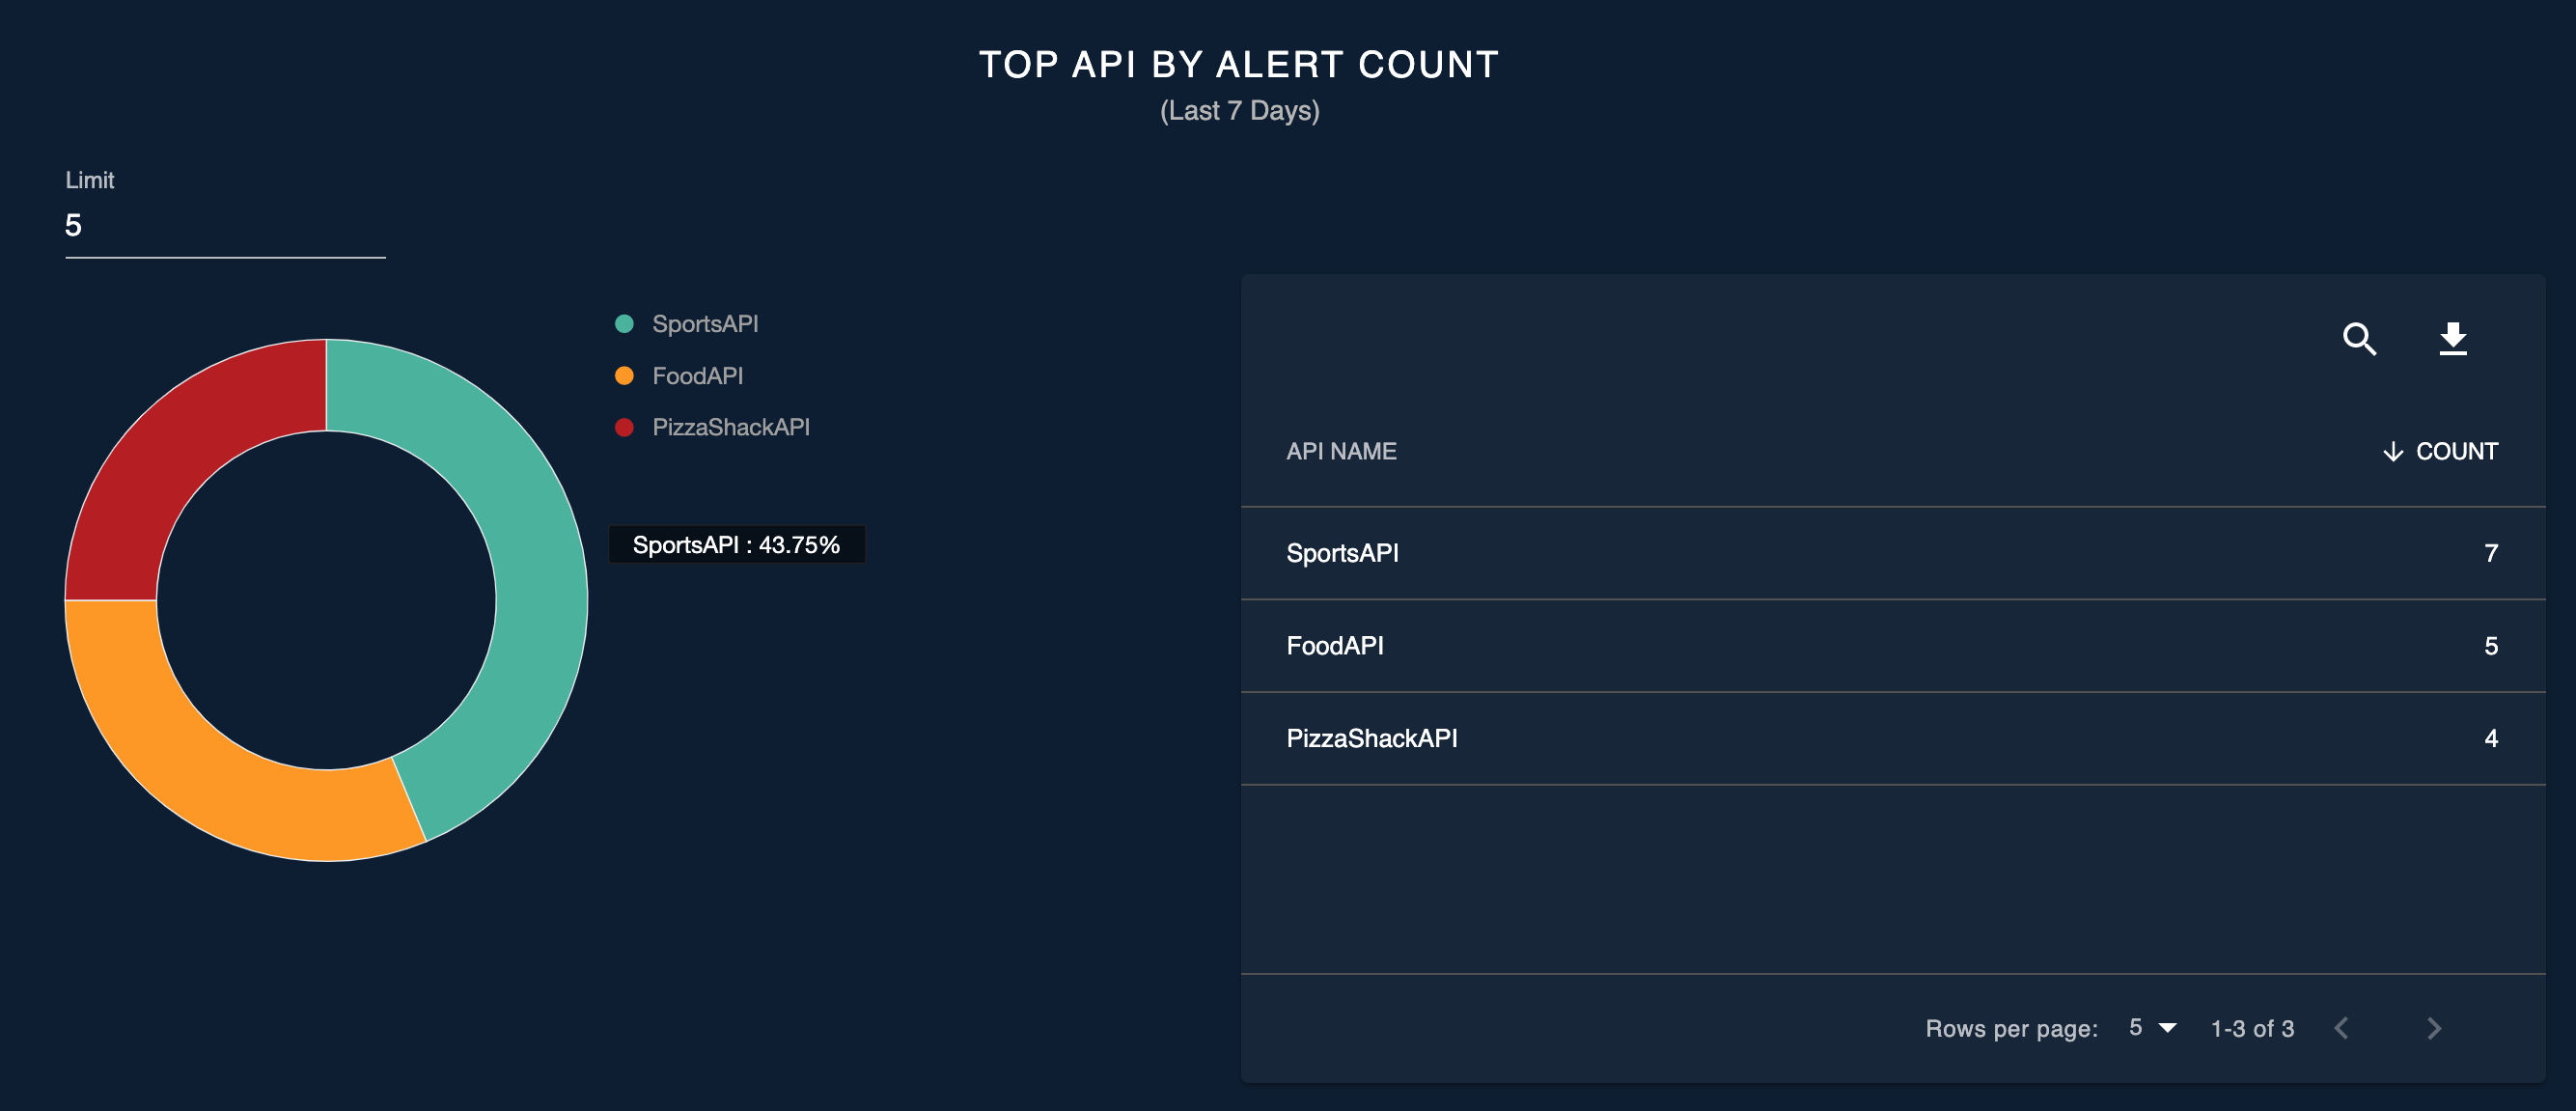
Top API by alert count
By going through the Top API by alert count widget, the user can easily identify the top APIs that the alerts have generated in the past 7 days and act accordingly. It shows the total number of alerts generated for a particular API in the last 7 days. In this widget, the user can filter the results by API NAME or COUNT. Moreover, once the user clicks on the name of an API in the table, it drills down to the Alerts summary widget and it shows a summary of alerts generated for the selected API.
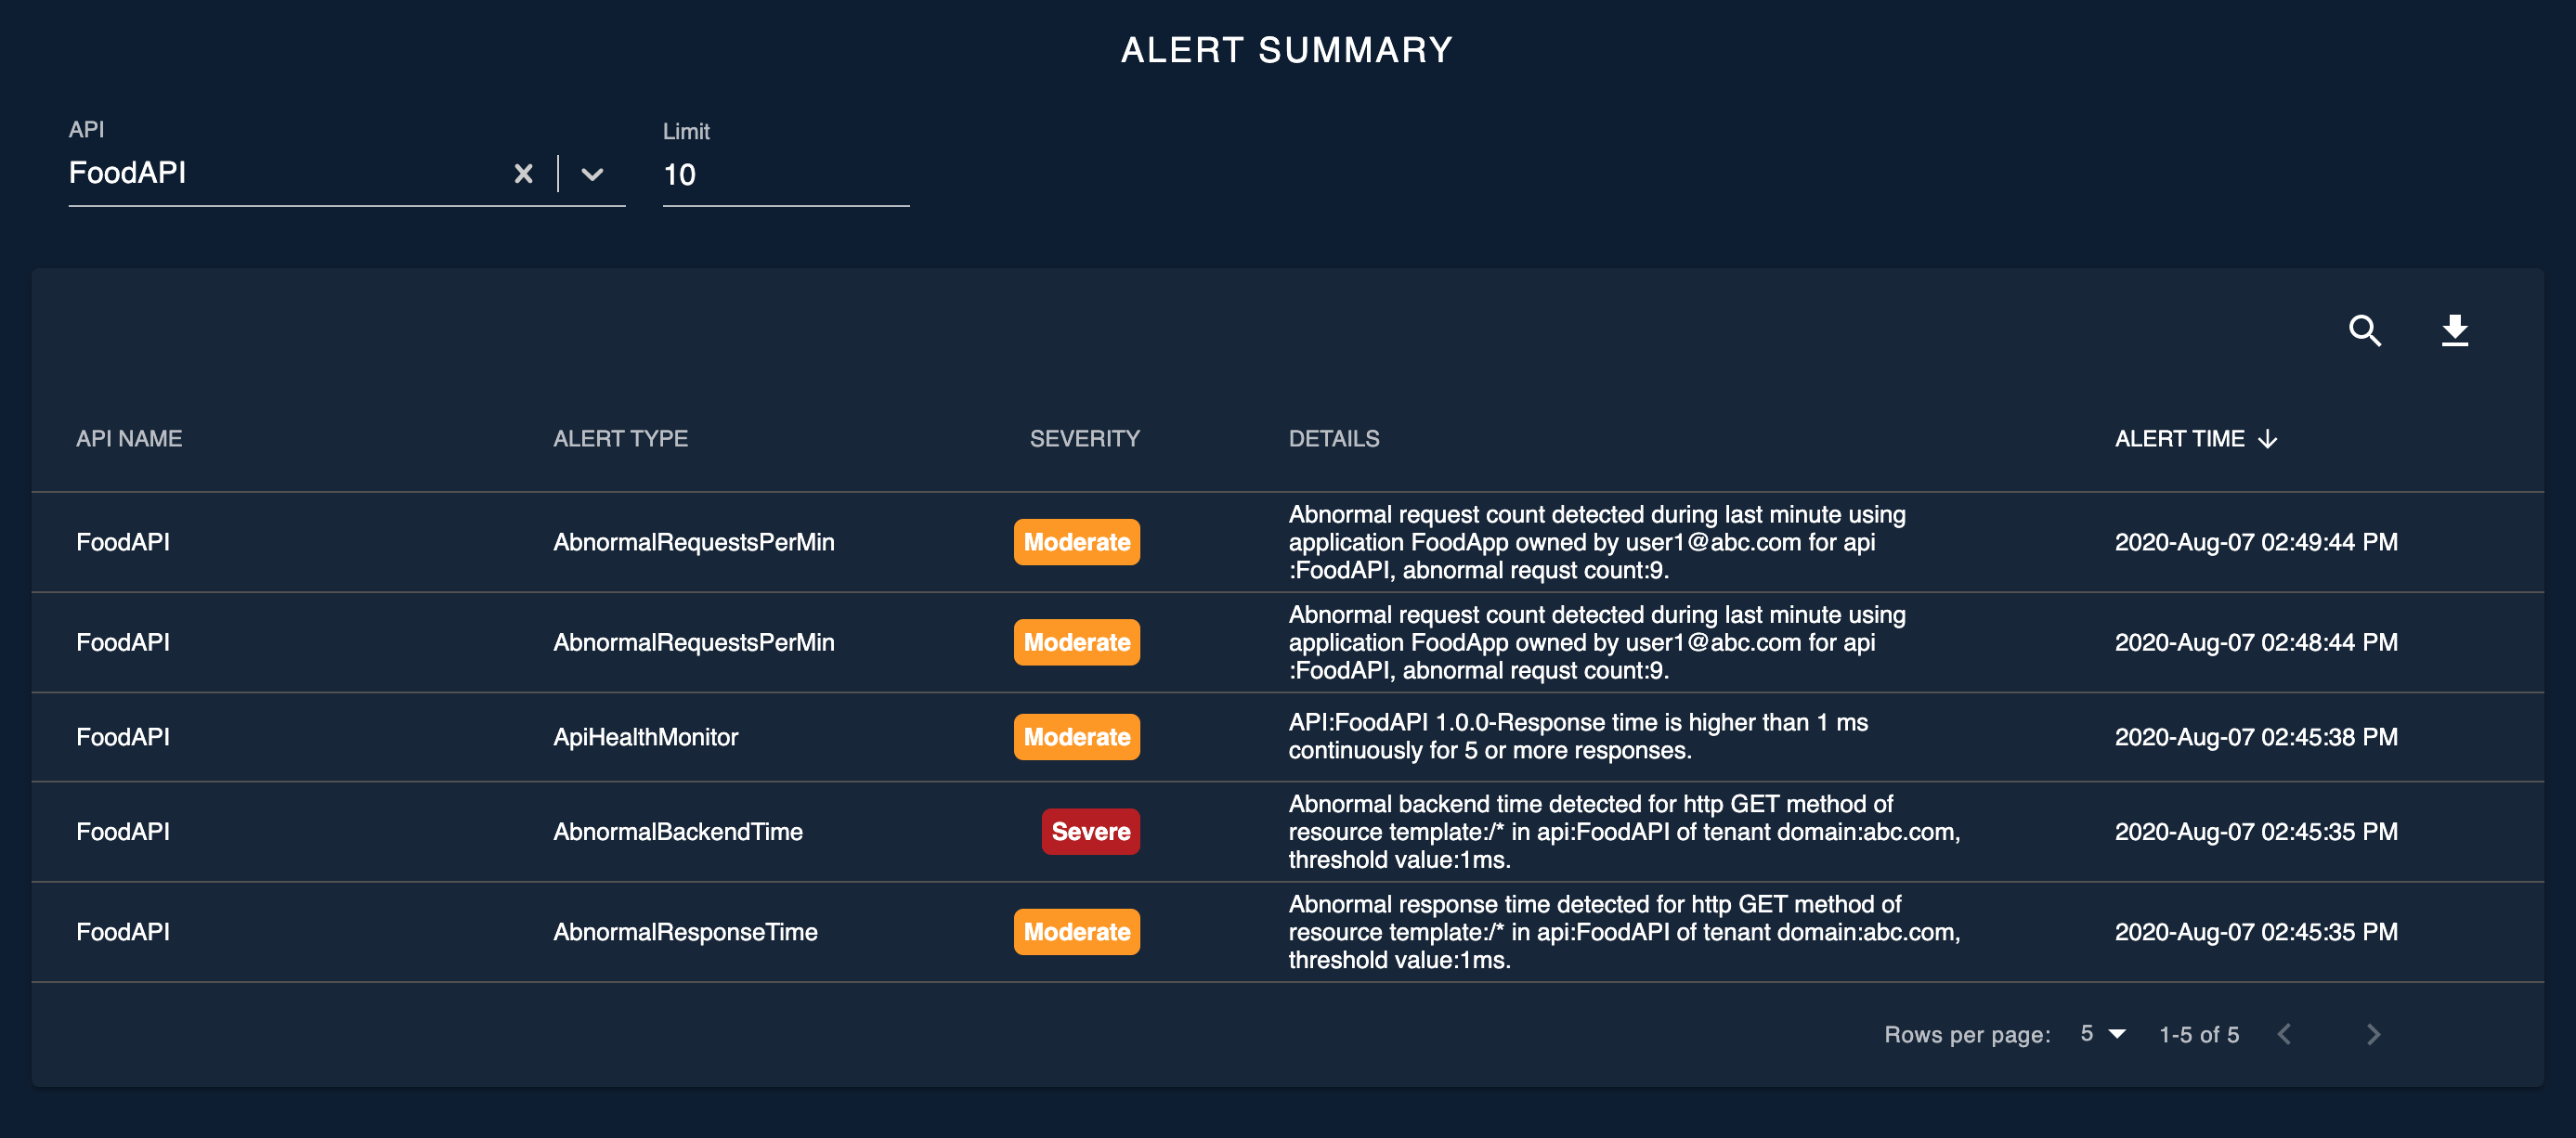
Alert summary
Alerts summary widget provides the user with a summary of all the alerts generated in the past. It provides API NAME, ALERT TYPE, SEVERITY, DETAILS and the ALERT TIME for a generated alert and the user can filter alerts by the aforementioned fields.
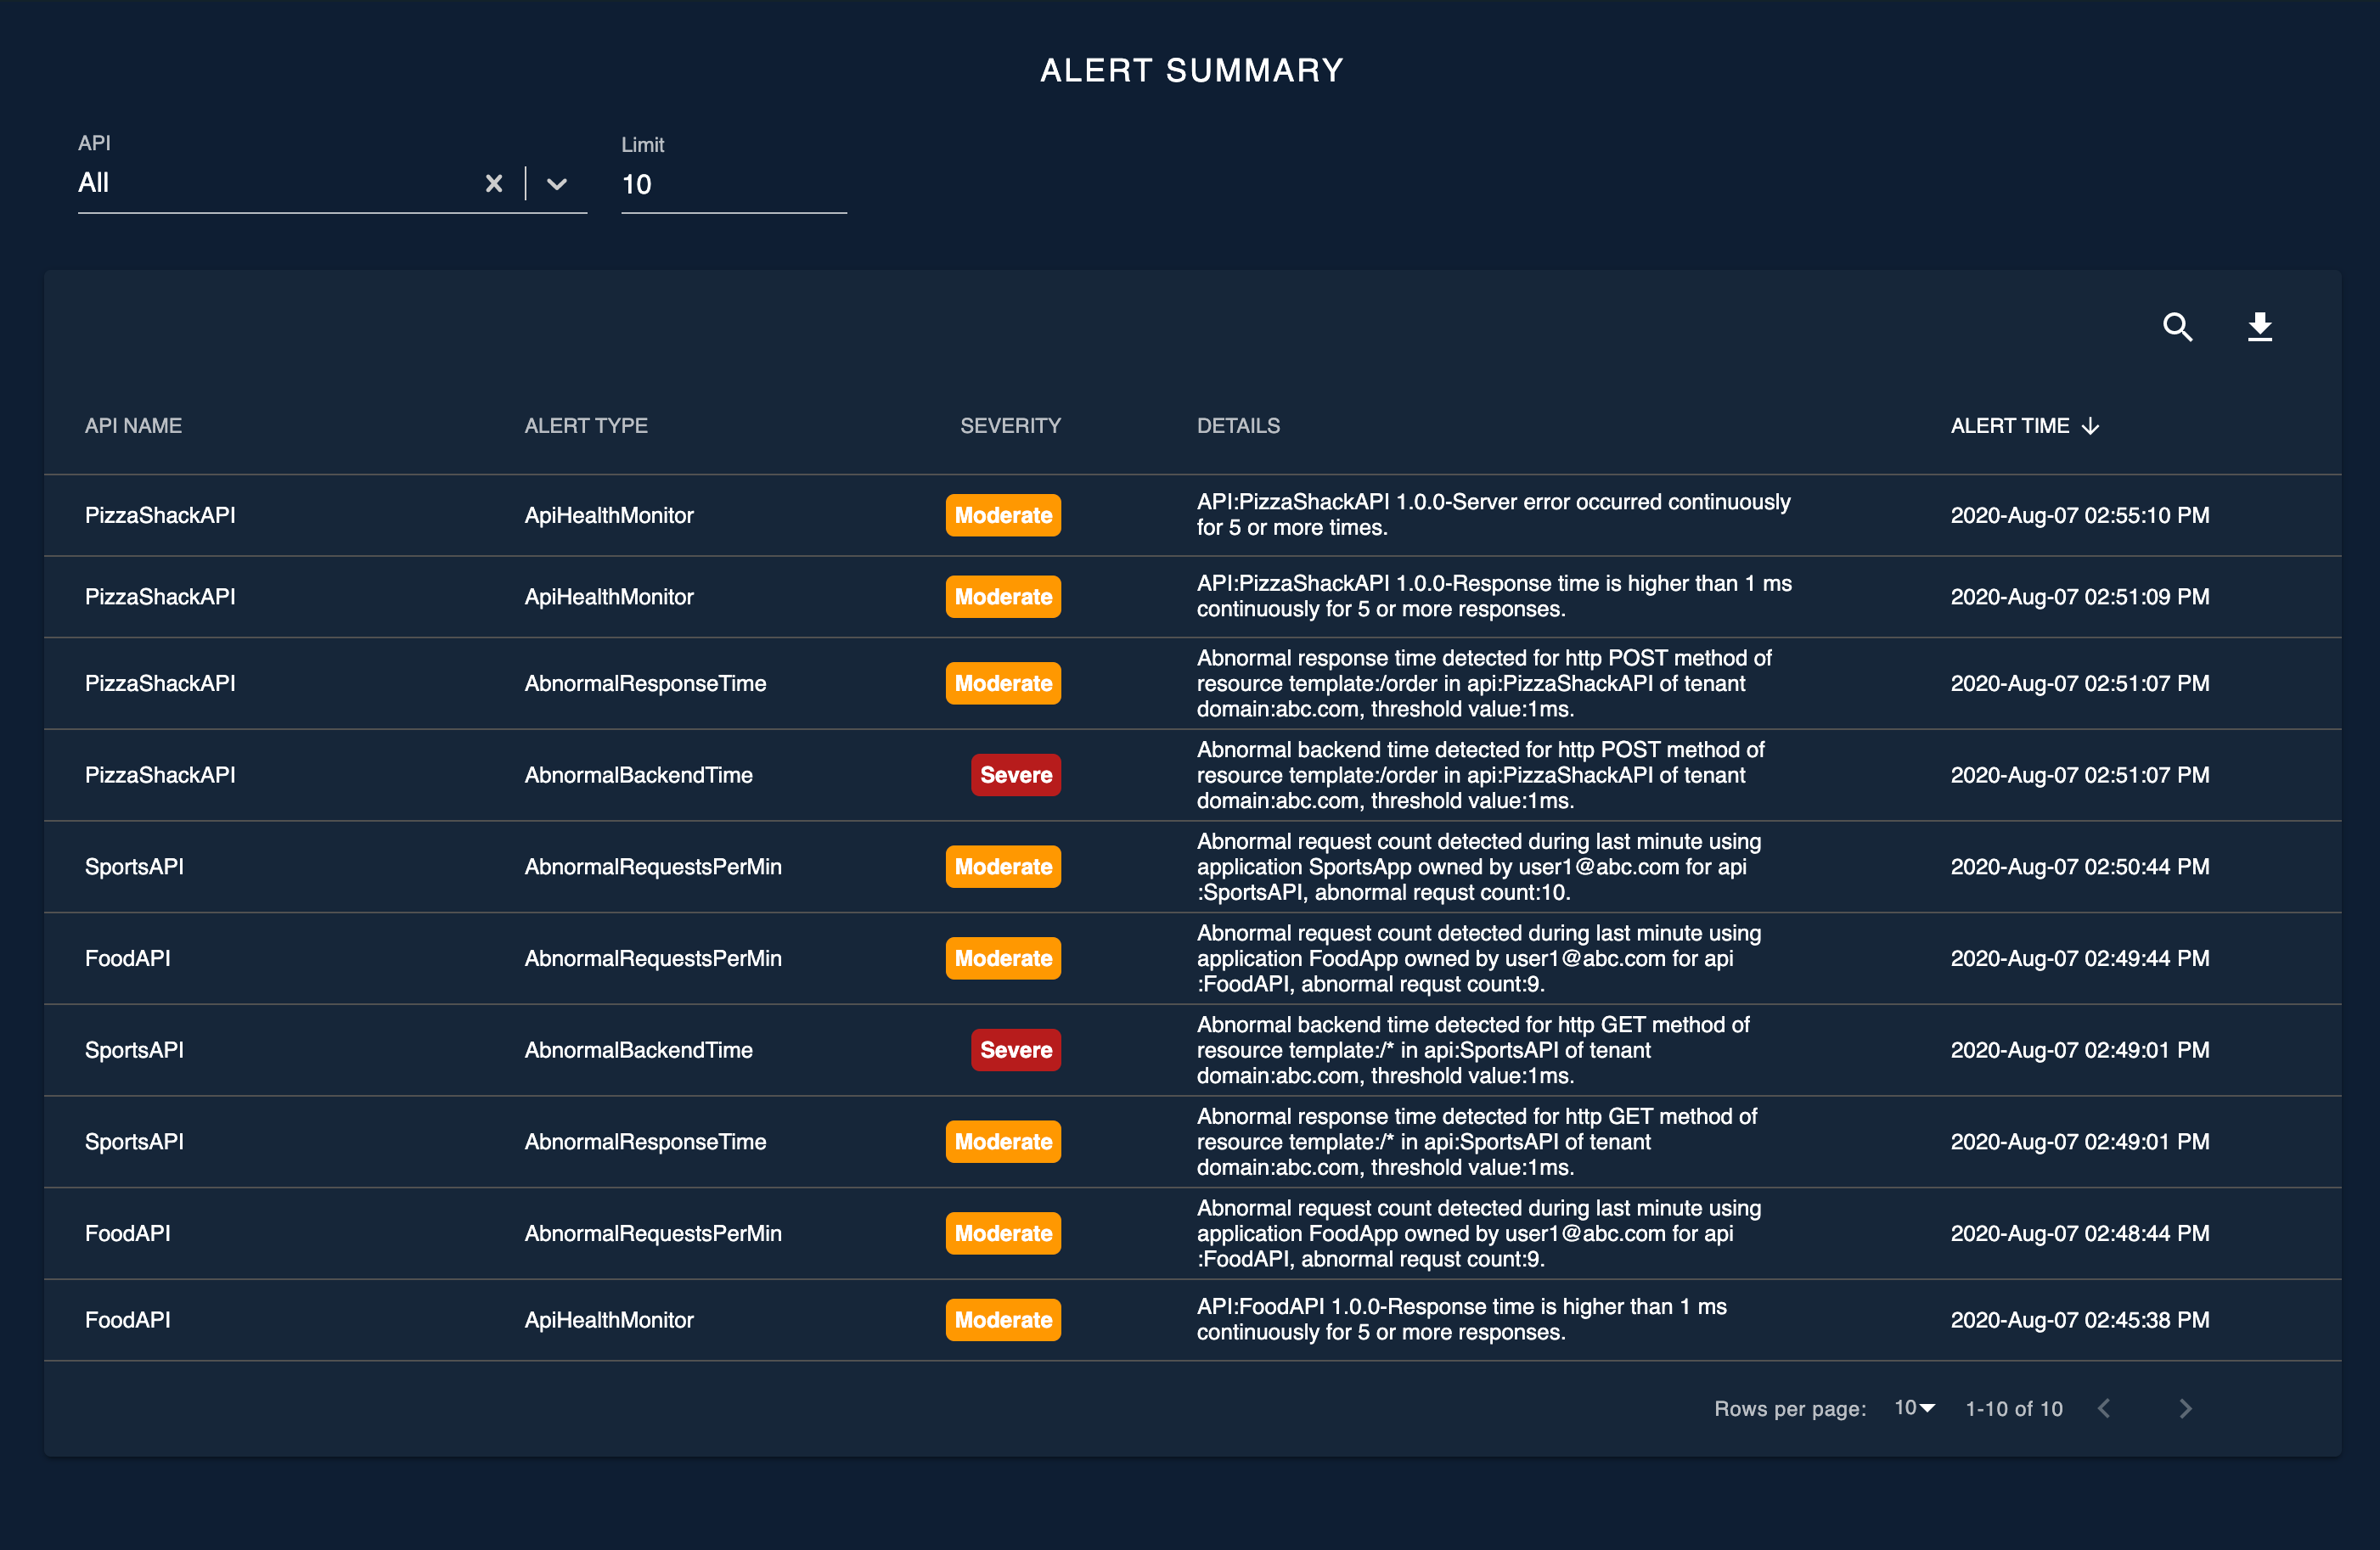
In this widget, the user has the option to query generated alerts for a single API as well.