Business Analytics
The business analytics dashboard provides business insights on APIs. This enables businesses to take proactive action to improve the profitability and the quality of the service provided.
Note
During drill downs across dashboard pages, the date range selection will be preserved.
Overview
The overview page comprises 4 summary widgets that shows an overview of the APIs during the past 30 days. These widgets consist of the following:
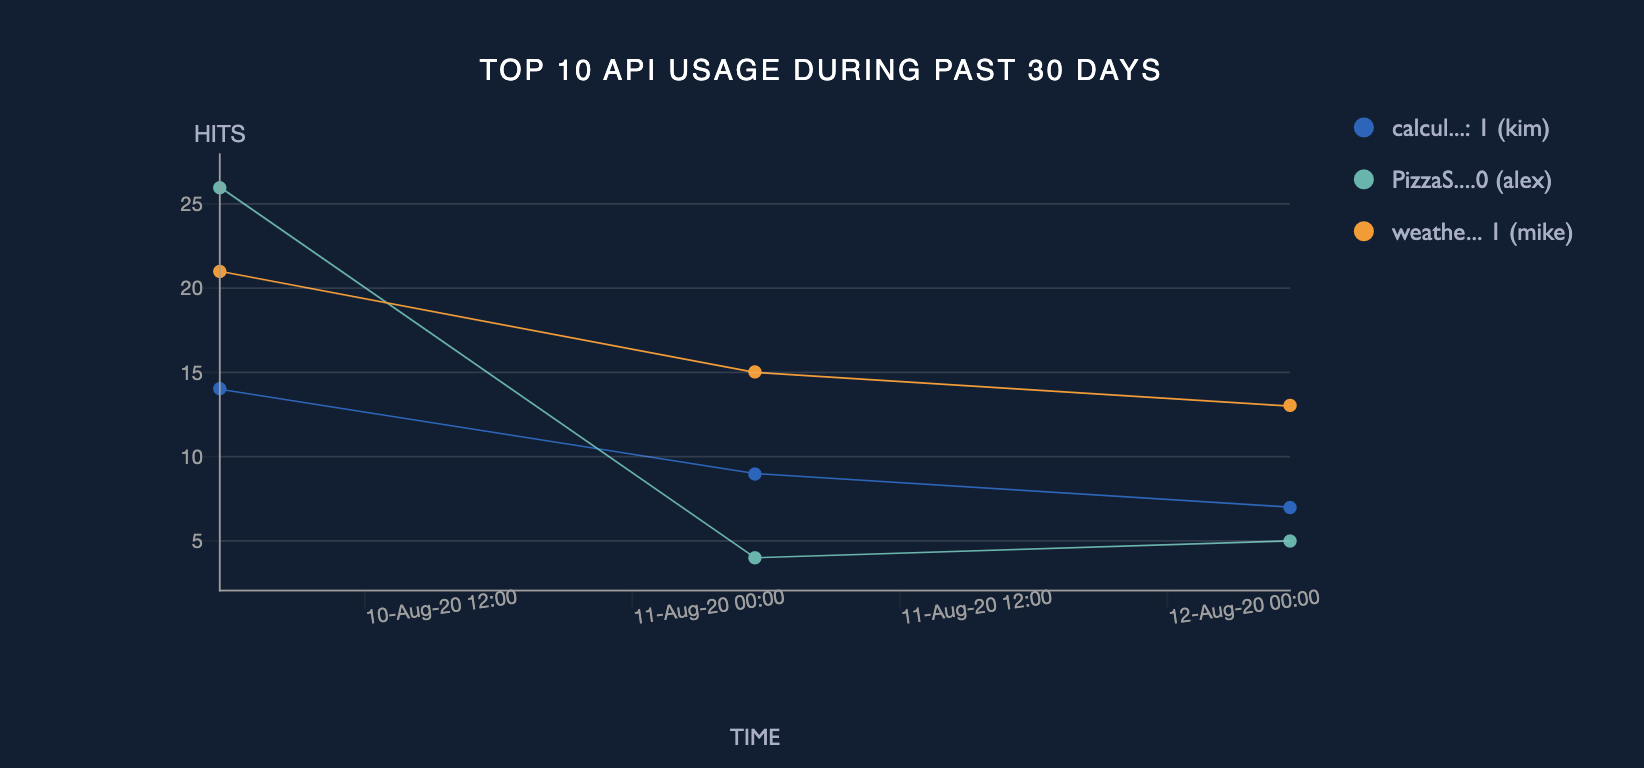
Top 10 API usage during past 30 days
This widget shows a breakdown of the usage of the top 10 most used APIs over the past 30 days. Click this widget to see the page.
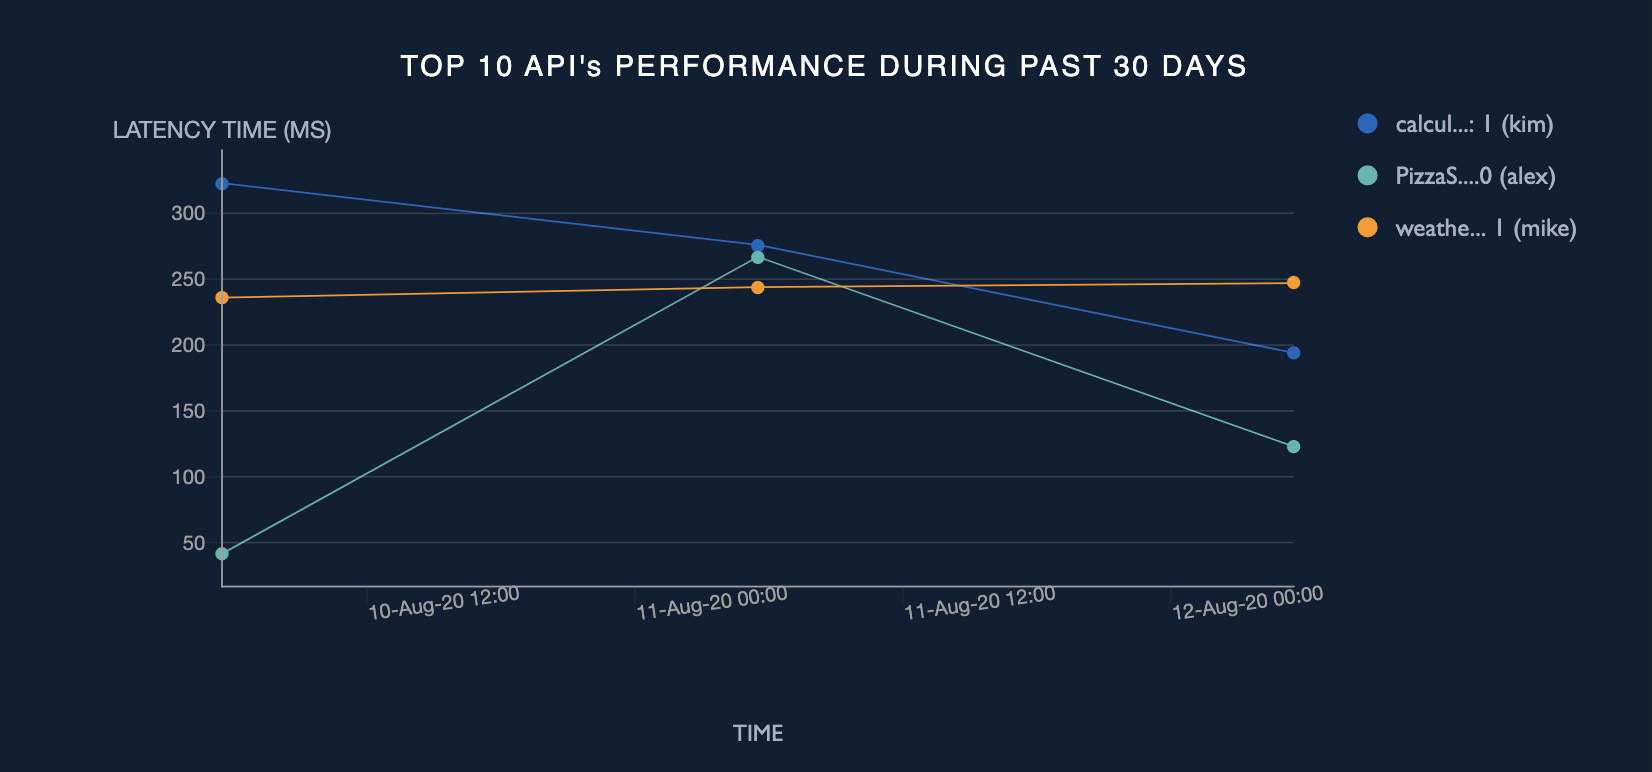
Top 10 API’s performance summary
This widget shows a breakdown of the performance of the top 10 most used APIs during the past 30 days. Click this widget to see the page.
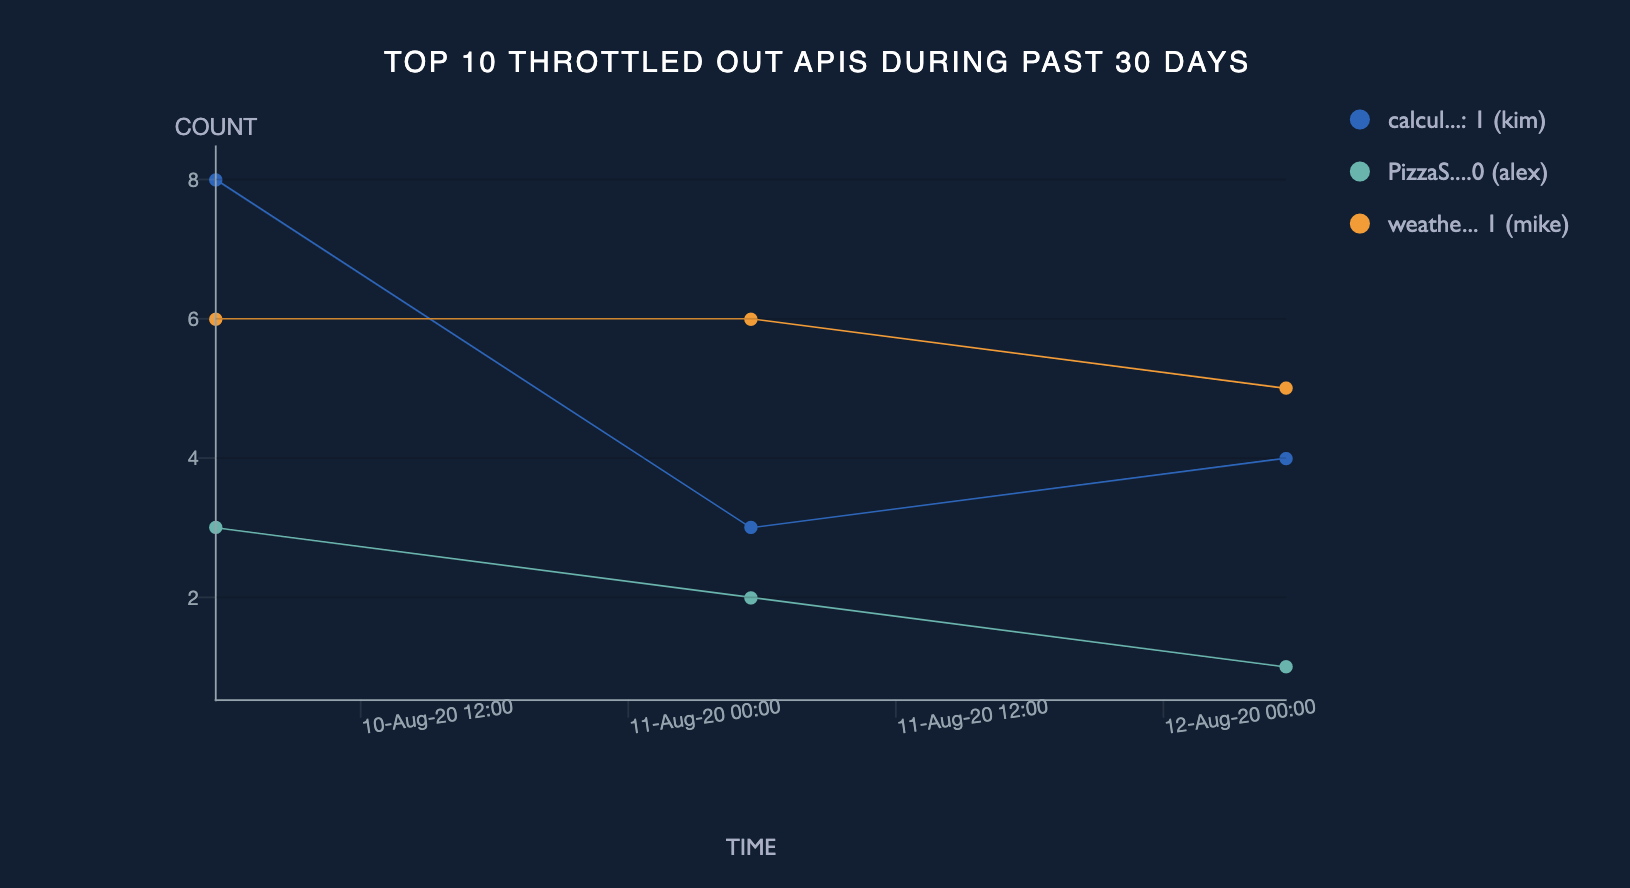
Top 10 throttle out APIs during past 30 days
This widget shows a breakdown of the throttle count of the top 10 most throttled out APIs during the past 30 days. Click this widget to see the page.
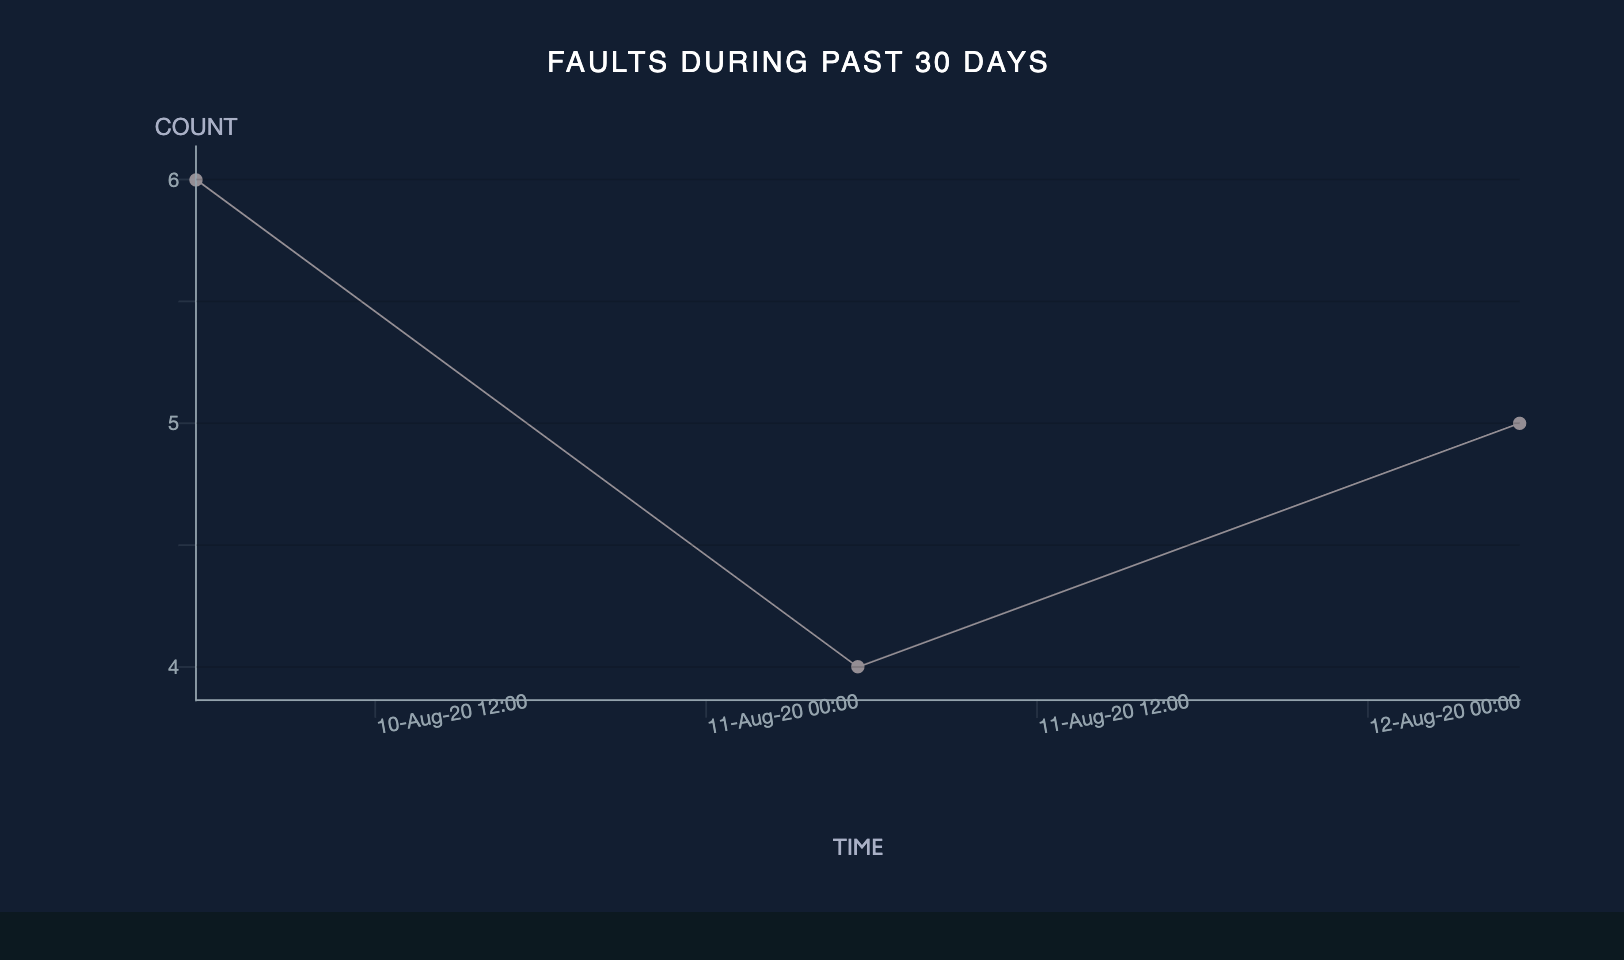
Faults during past 30 days
This widget shows a breakdown of the total number of faults(of all APIs) during the past 30 days. Click this widget to see the page.
API usage analysis
API usage related data is represented through overall and over time graphs in the business dashboard. Information related to API usage can be found in the following 2 pages of the business analytics dashboard:
Usage summary
The usage summary page provides a summarized view of the usage of the selected API(s) for the specified time period.
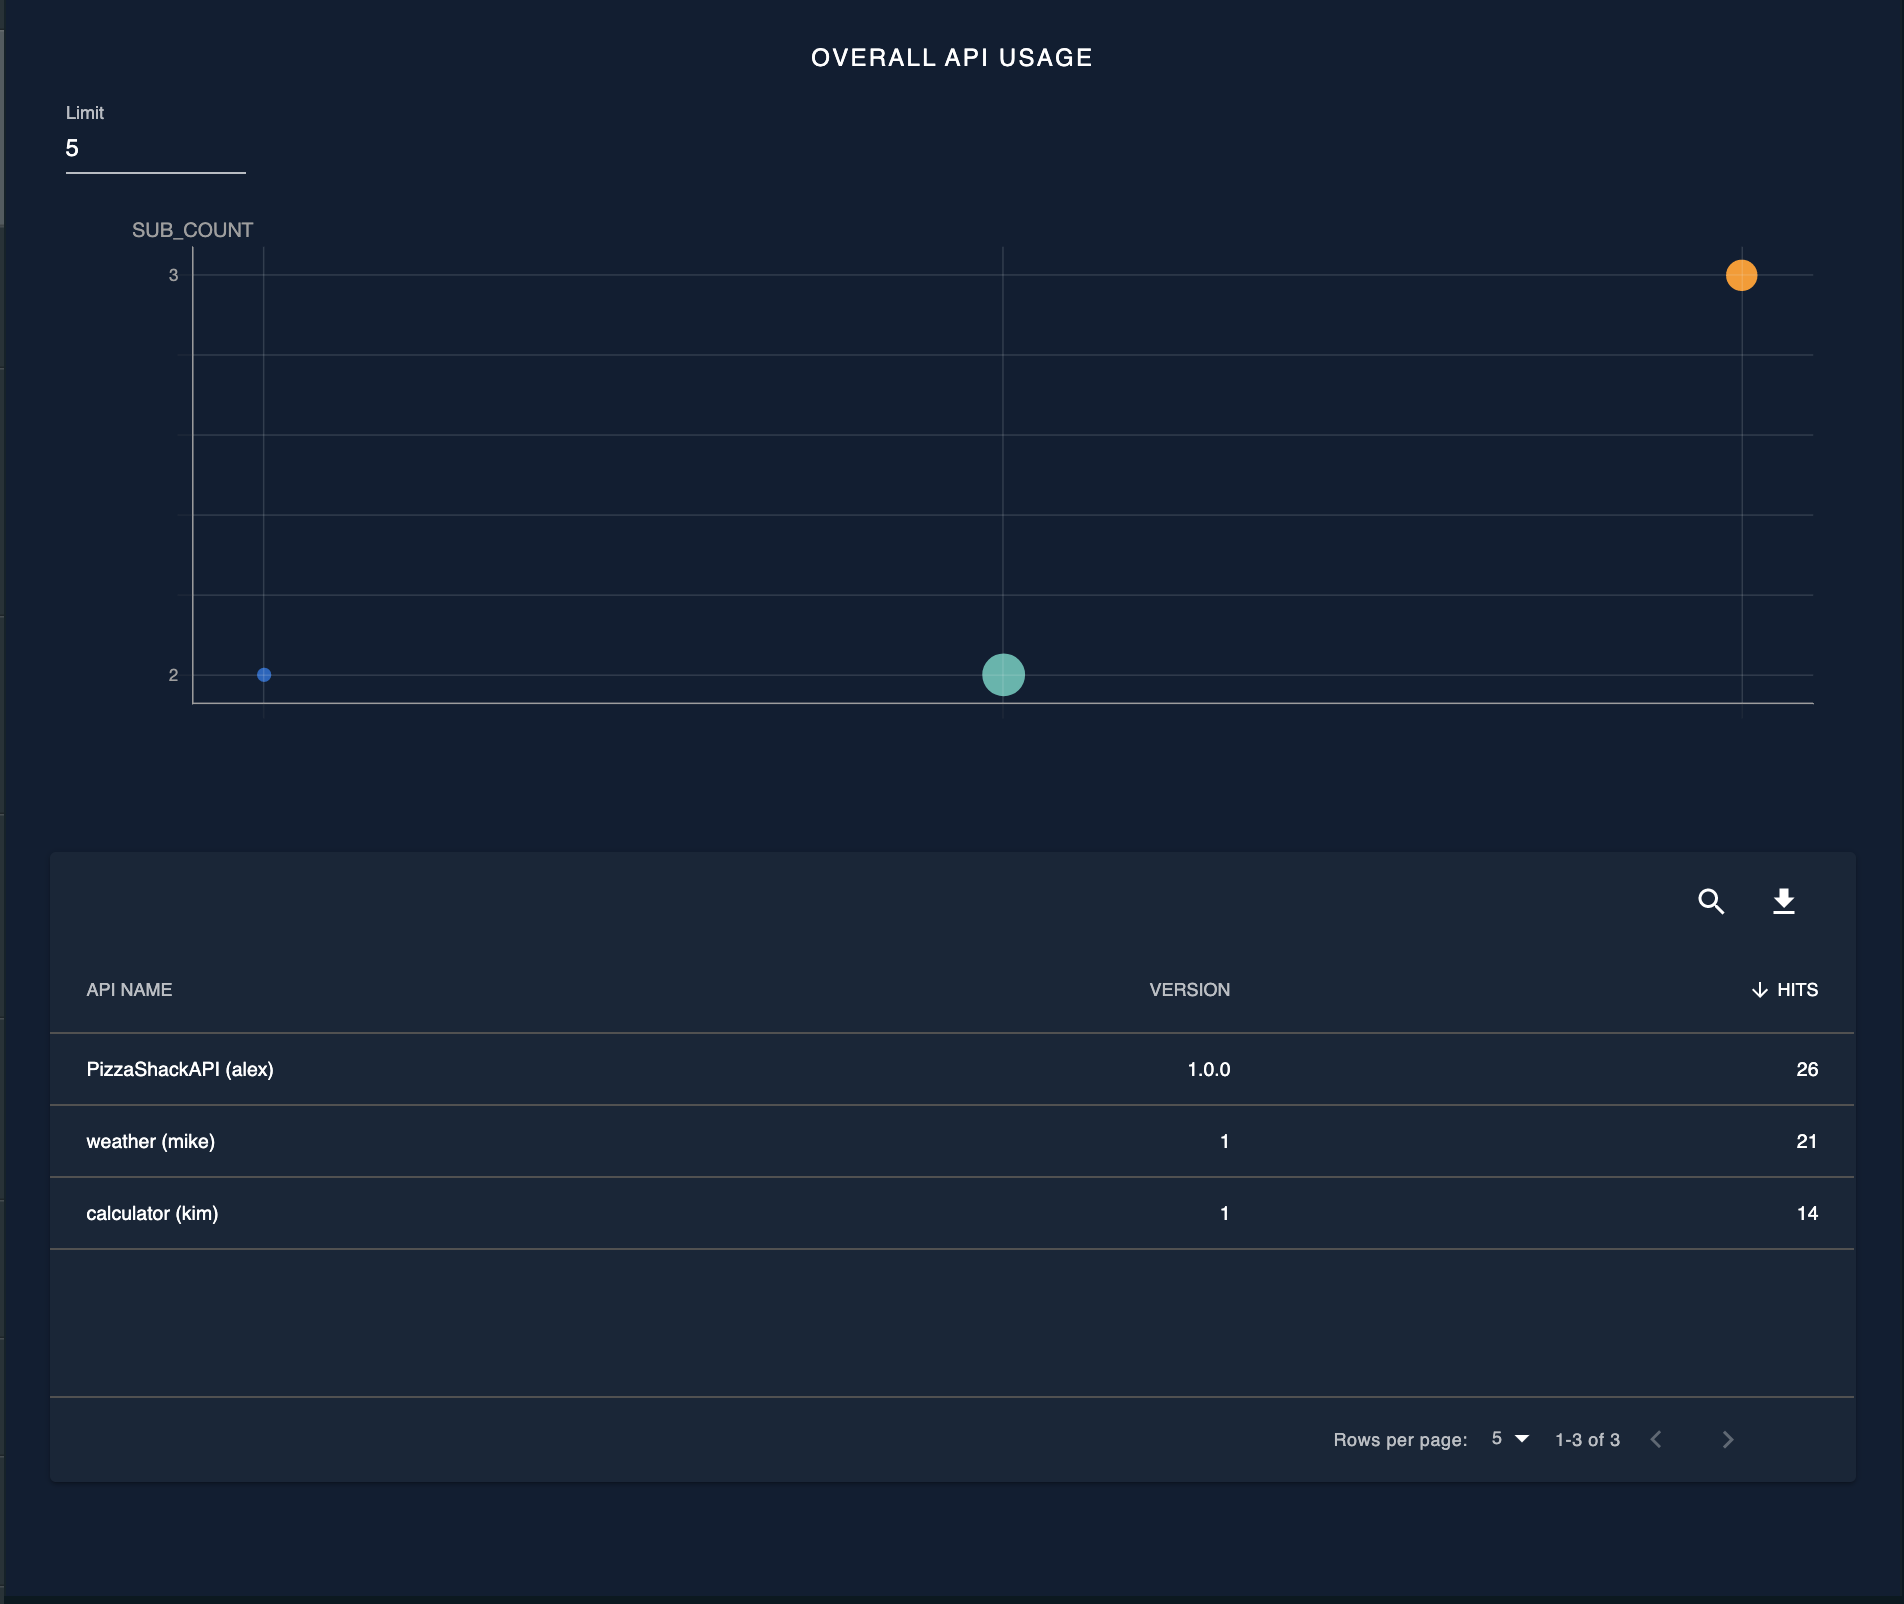
Overall API usage
This graph shows the usage count of the selected API(s) for the specified time period along with their subscription count. This widget contains 2 graphs;
- A 3D scatter plot matrix which shows the API, usage count and the subscription count. The API name is taken as the X axis and the subscription count is shown in the Y axis while the size of the data point indicates the usage count.
- A table which shows the usage count of each API.
The default view of these graphs will be;
- The scatter plot points will be ordered from left to right by the API name in ascending order
- The table will be ordered by the usage count in descending order
Click on a specific API entry in the table, to see the API usage over time page, which shows a breakdown of the usage count over time.
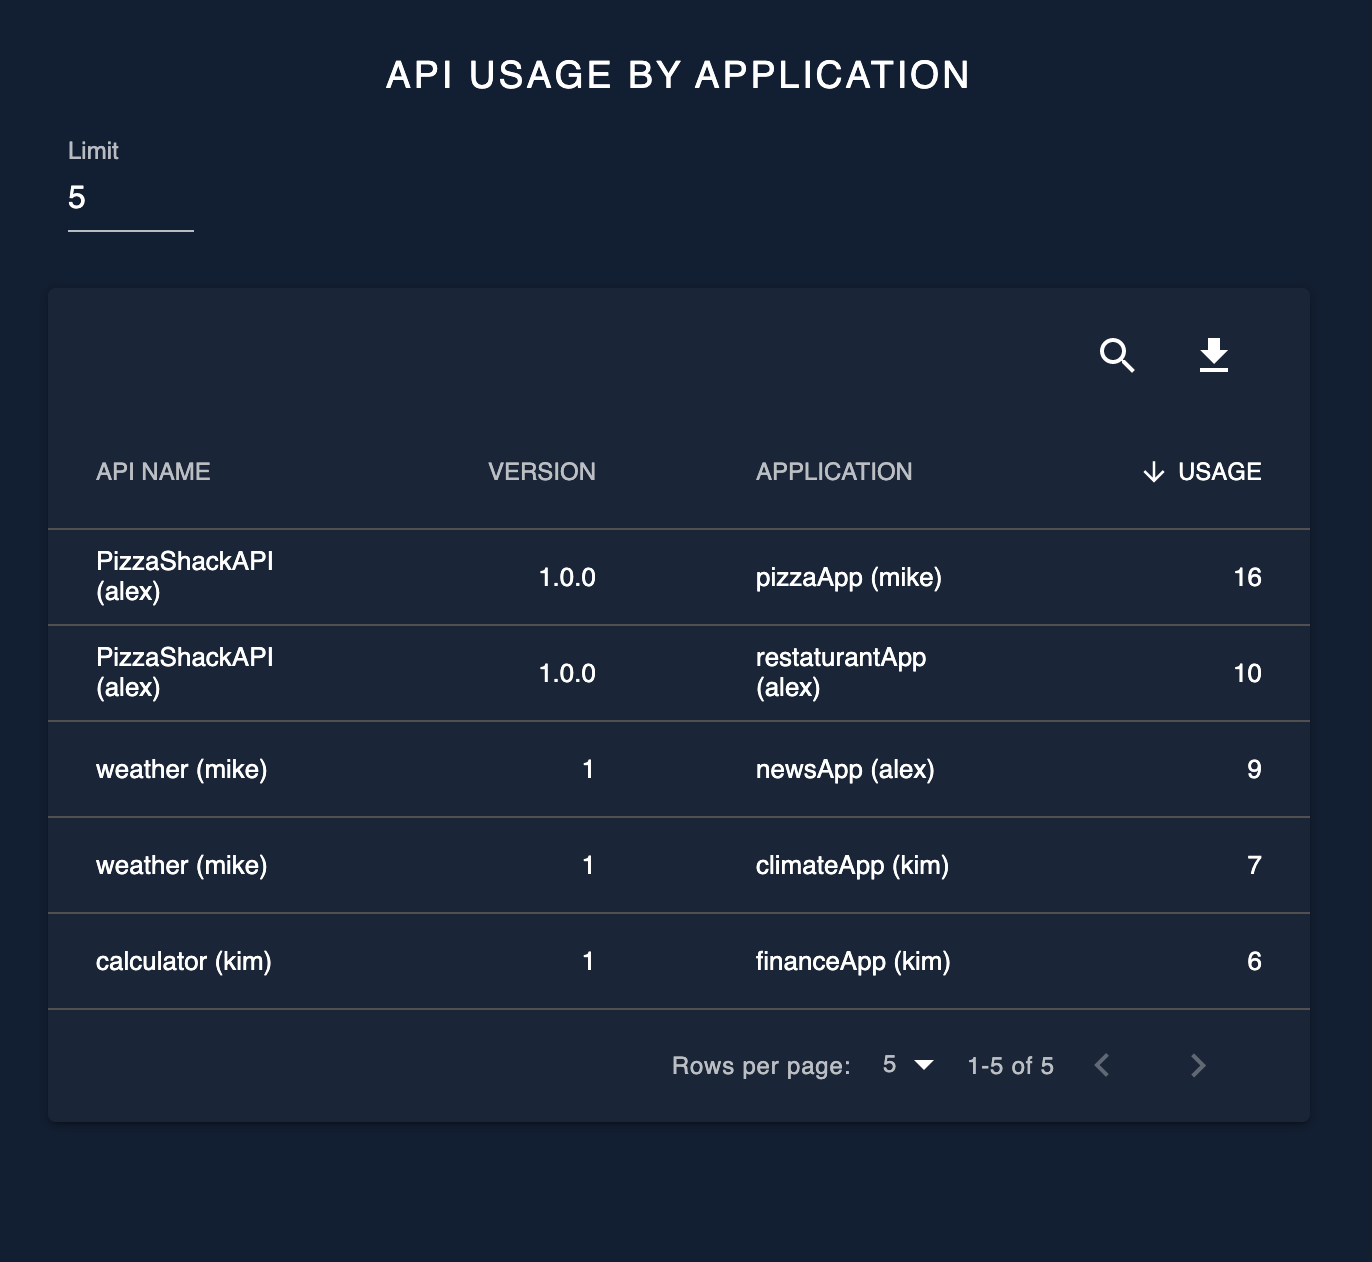
API usage by application
The API usage by application graph shows an application wise breakdown of the usage count of the selected API(s) for the specified time period. The default view will be ordered by the usage count in descending order. Click on a specific entry in the table, to see the API usage over time for the specific application.
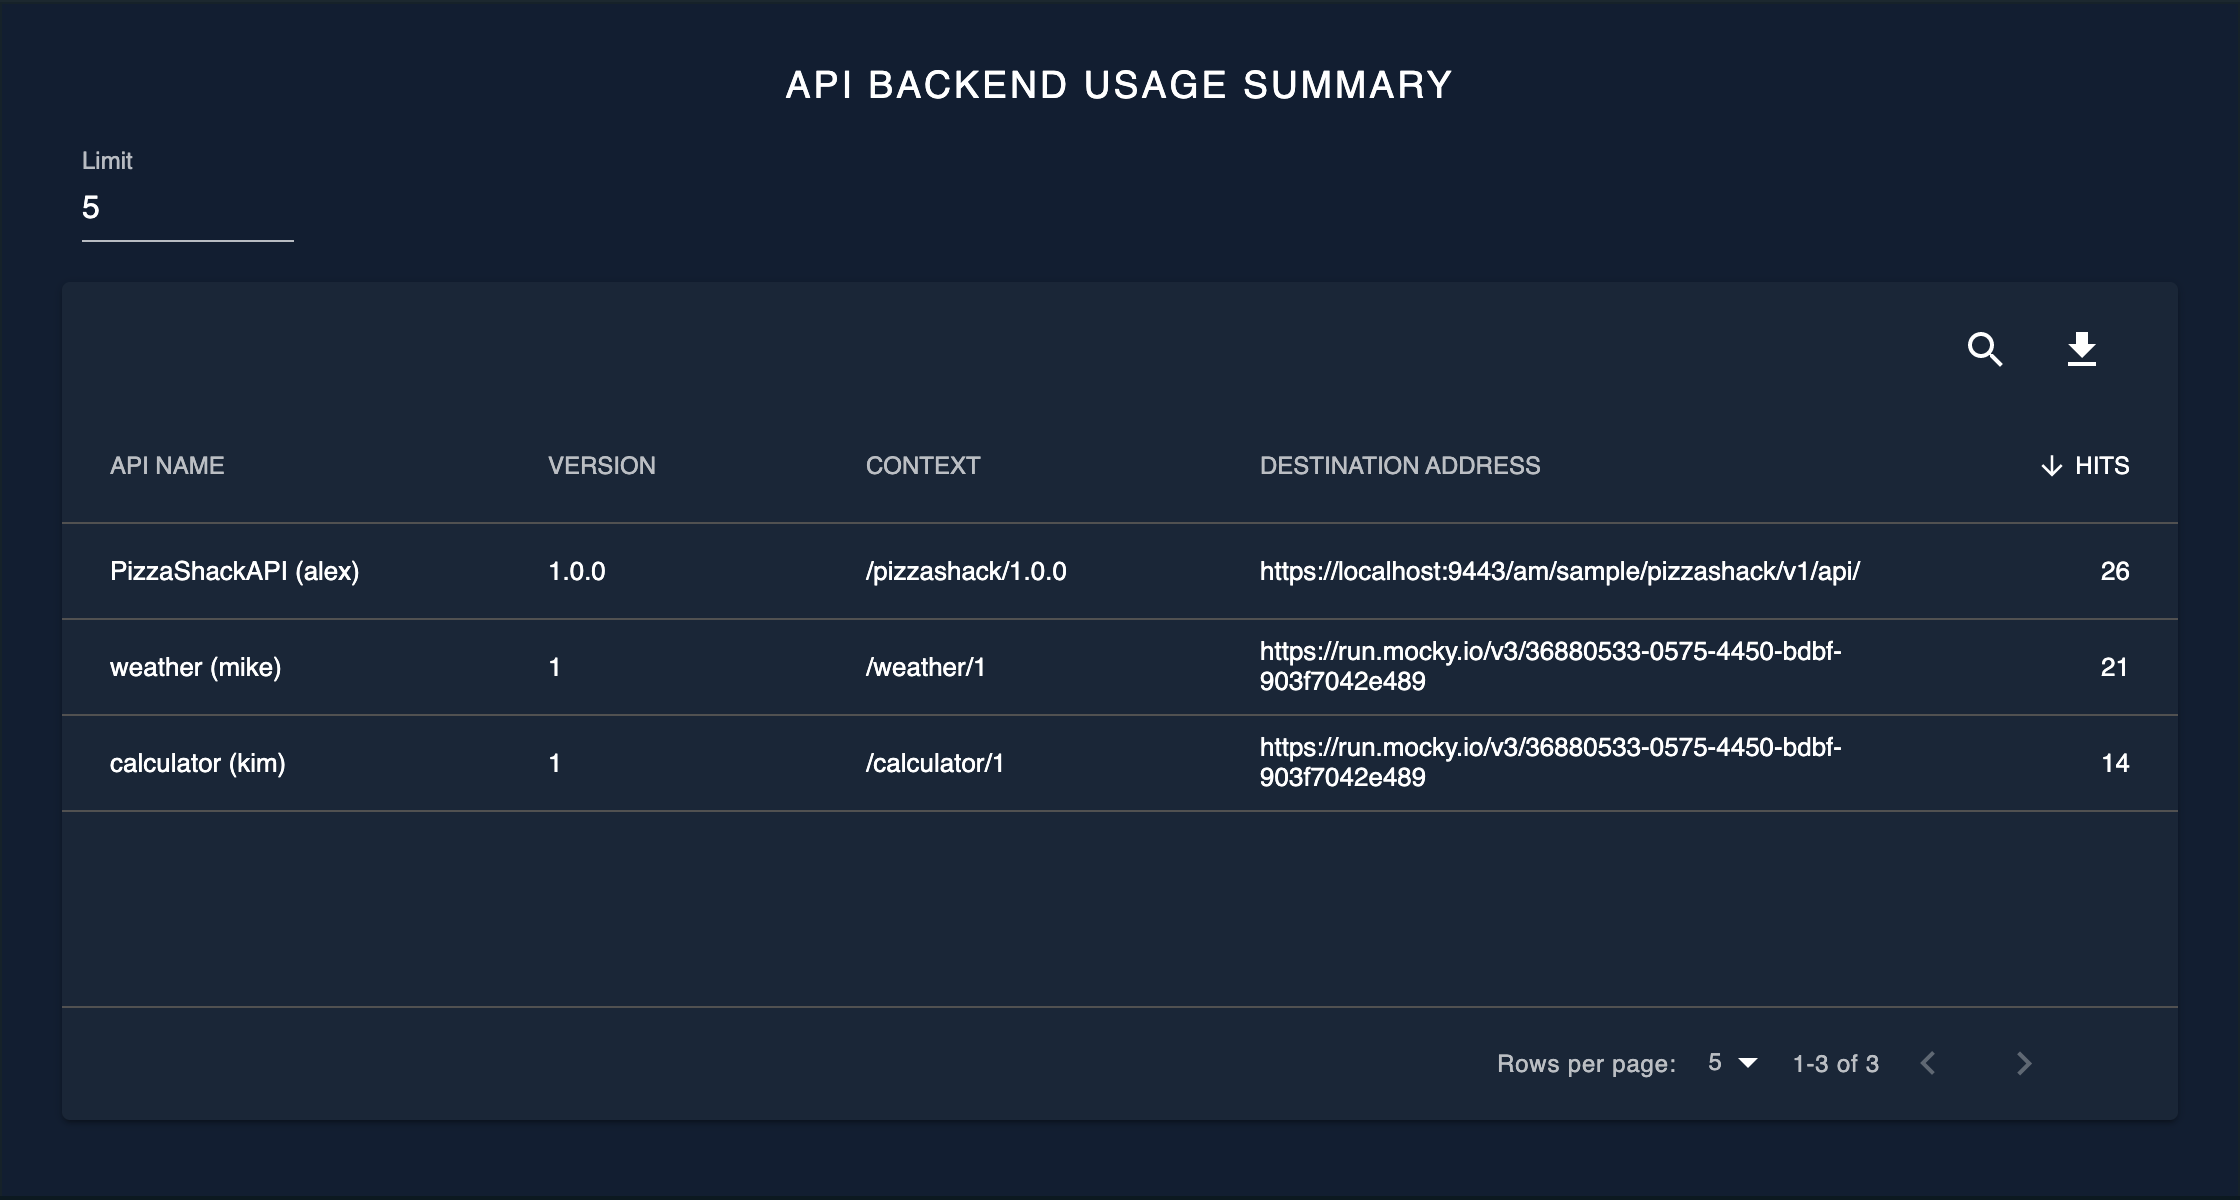
API backend usage summary
The API backend usage summary shows the usage count of the backends of the selected API(s) for the specified time period. The default view will be sorted in descending order of the usage count.
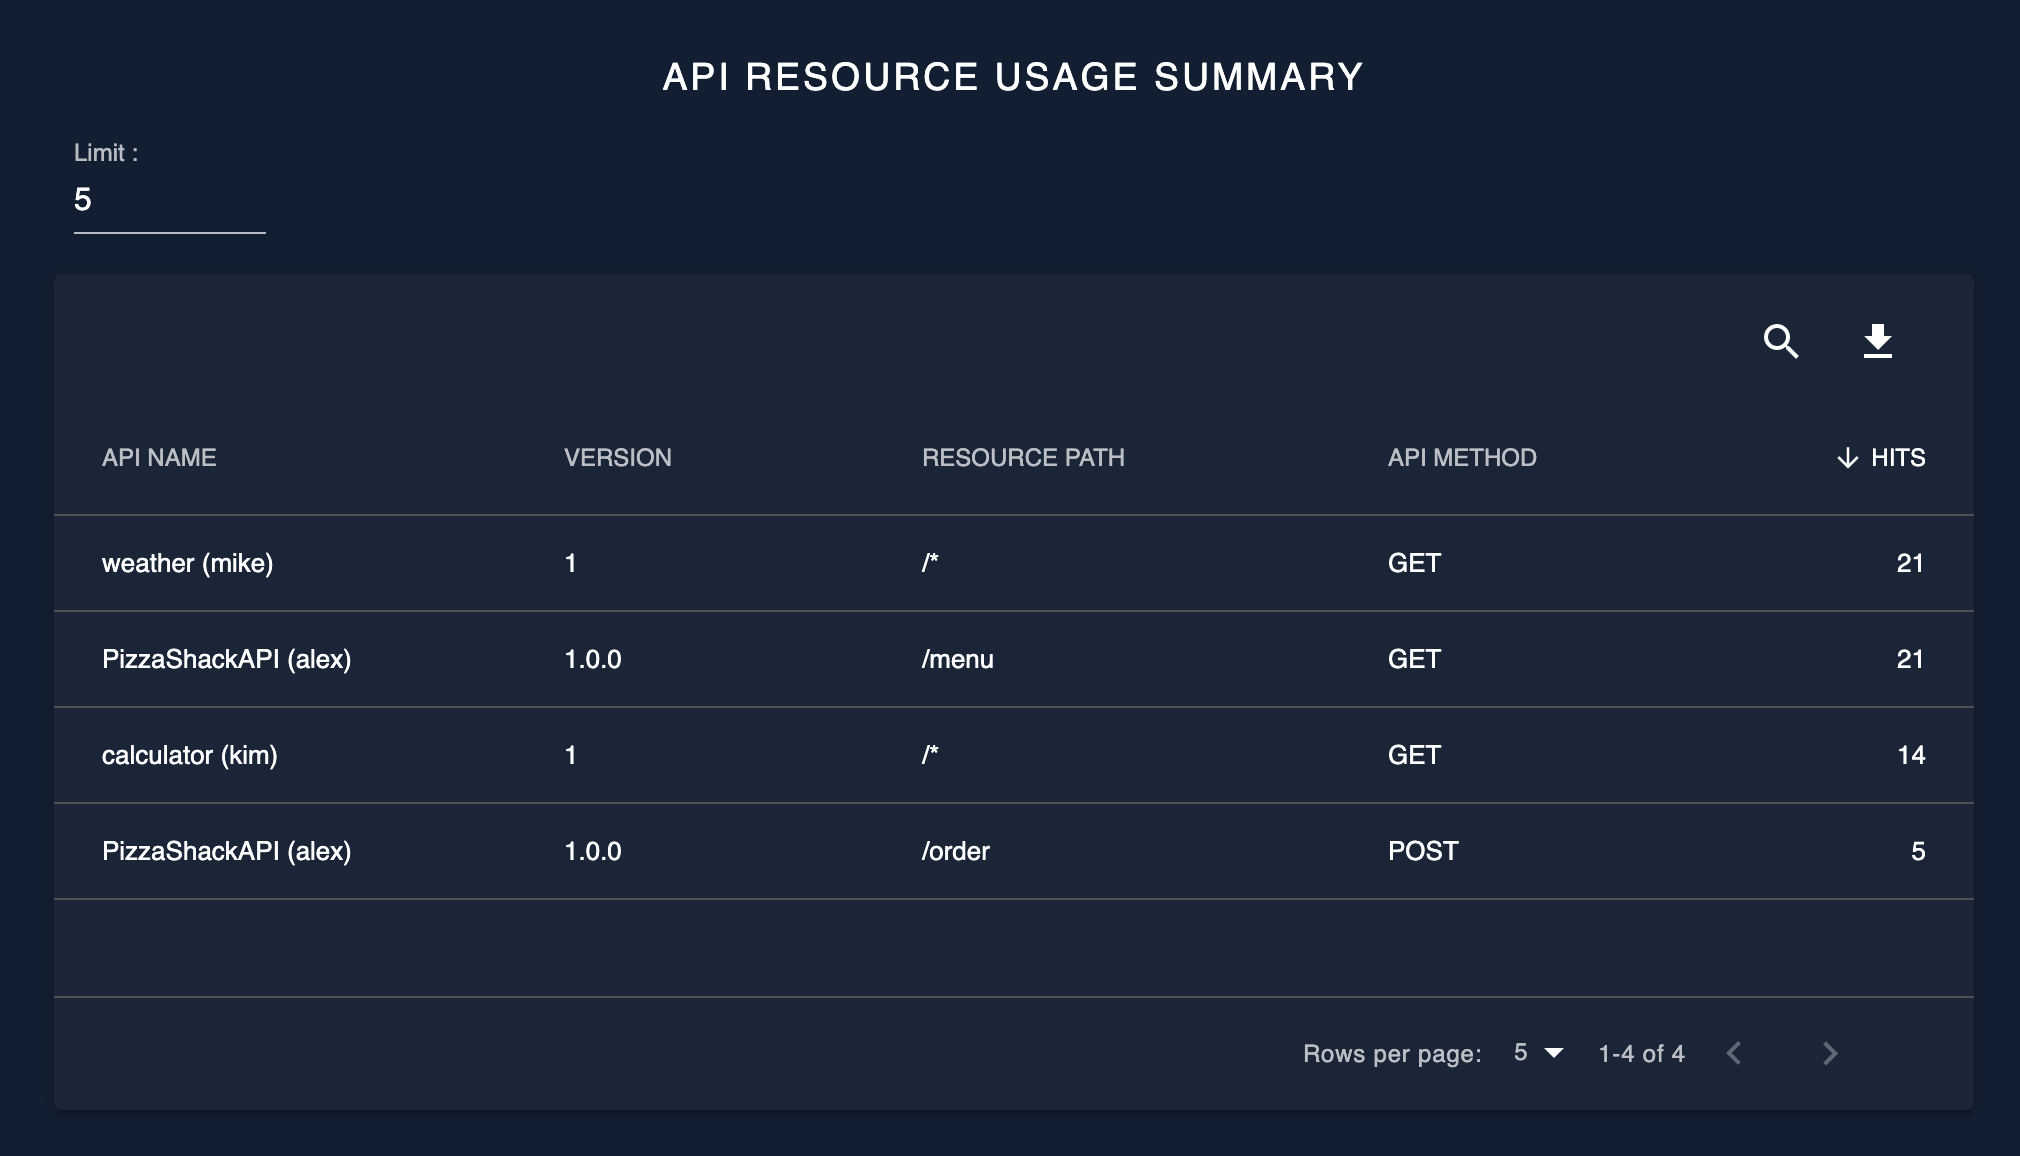
API resource usage summary
The API resource usage summary shows the usage count of the resources of the selected API(s) for the specified time period. The default view will be sorted in descending order of the usage count.
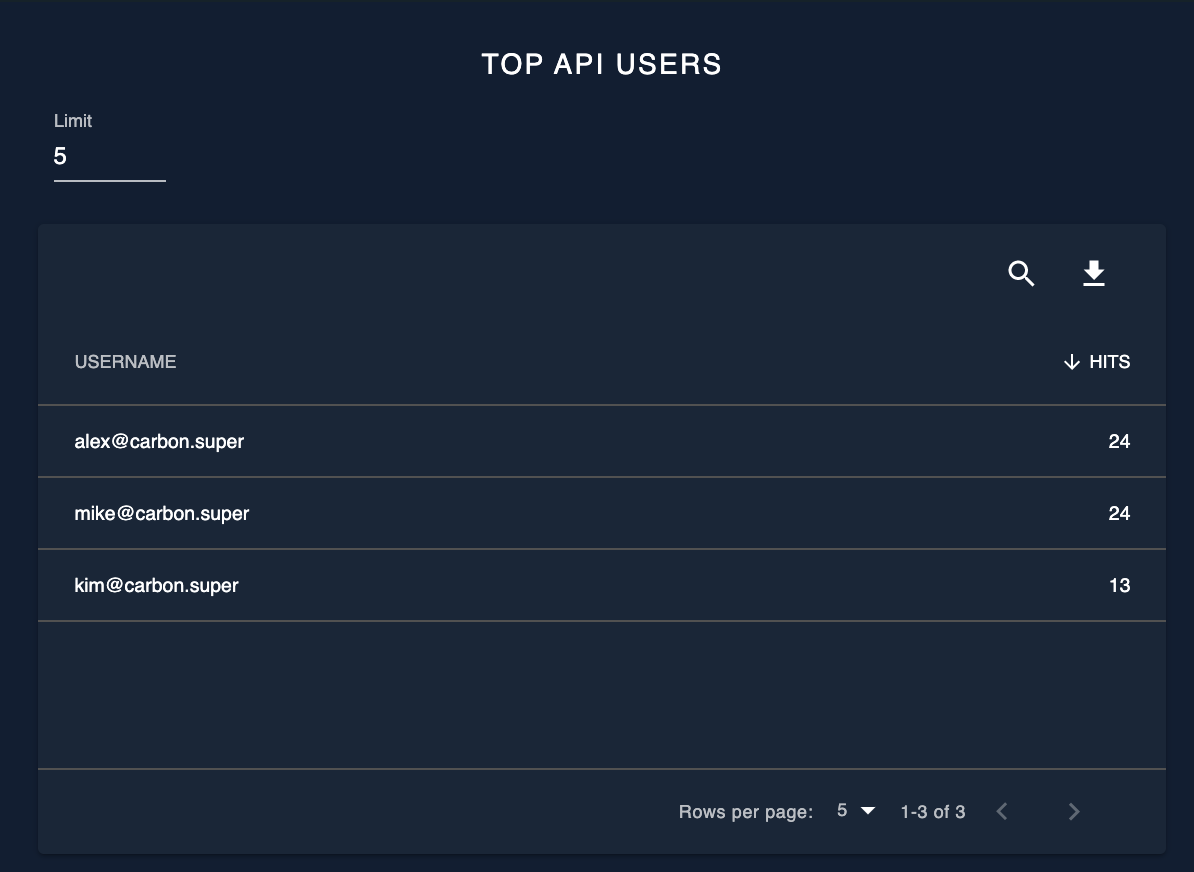
Top API users
The top API users widget will display the list of users who have done the most number of API invocations ordered in descending order of the usage count.
API usage
The API usage page provides an overtime representation of the usage of the selected API(s) for the specified time range.
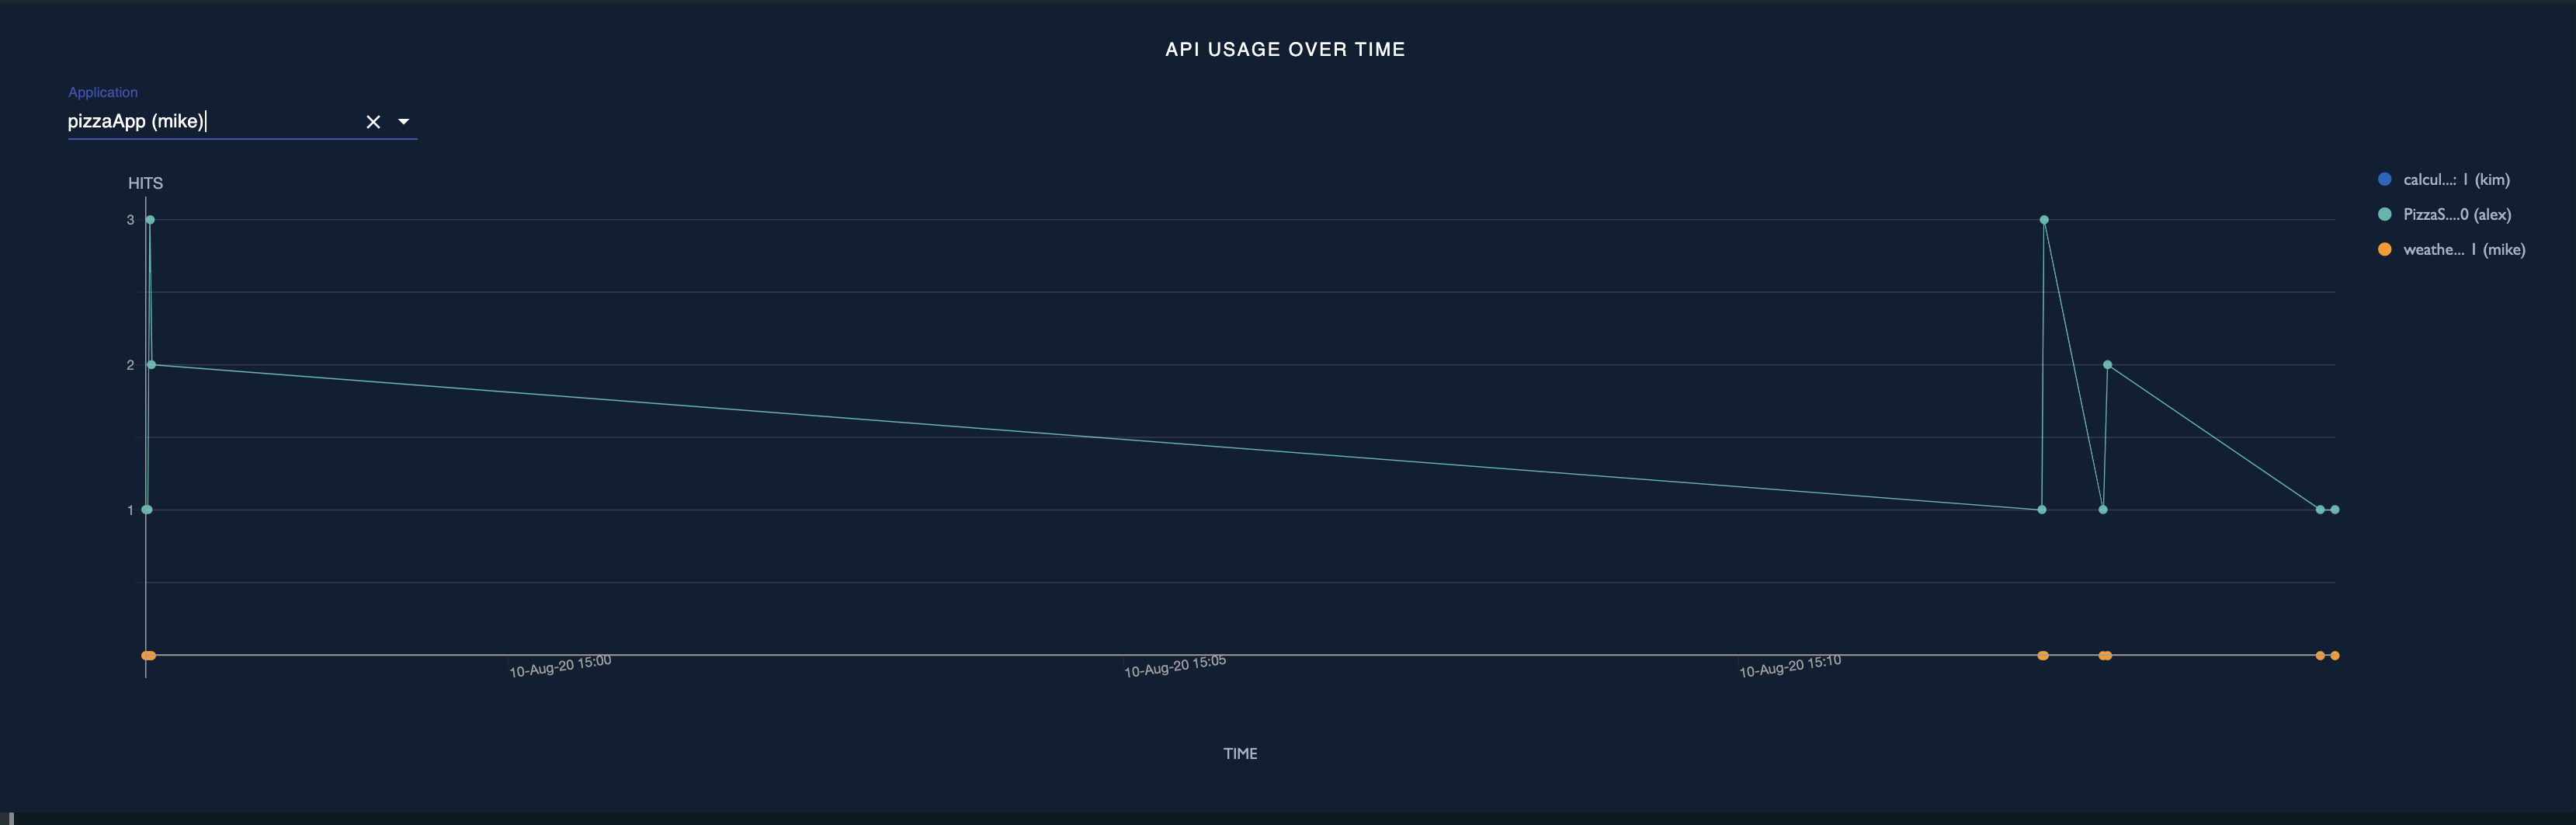
API usage over time
The API usage over time widget shows the usage of selected API(s) for the specified time range. The usage patterns displayed in this graph will help to identify the trending APIs and to decide which API(s) to deprecate.
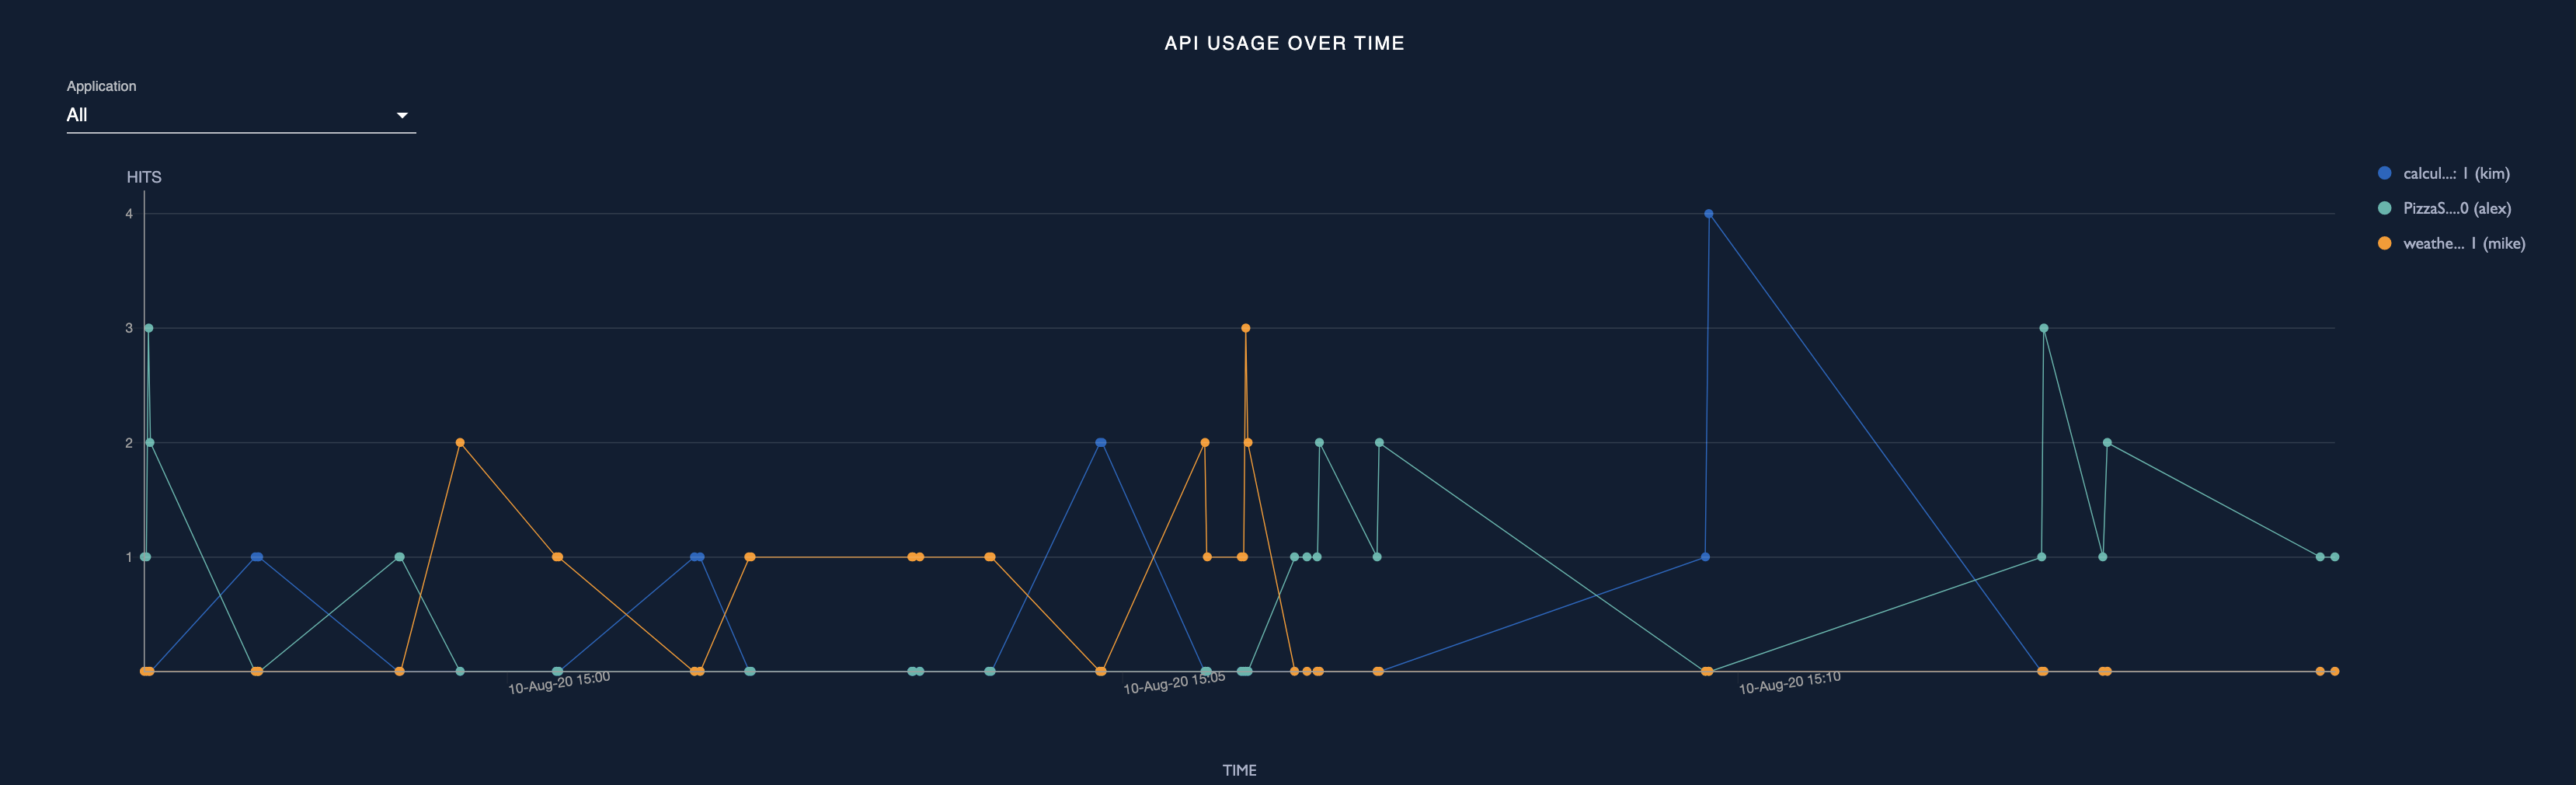
This graph can also be used to view the usage of the selected API(s) by a specific application over time for the specified time period. The applications with subscriptions to the selected APIs will be listed.
Viewing API performance
Analyzing performance of APIs will help identify problematic APIs. Information related to API performance can be found in the following 2 pages of the business analytics dashboard:
Performance summary
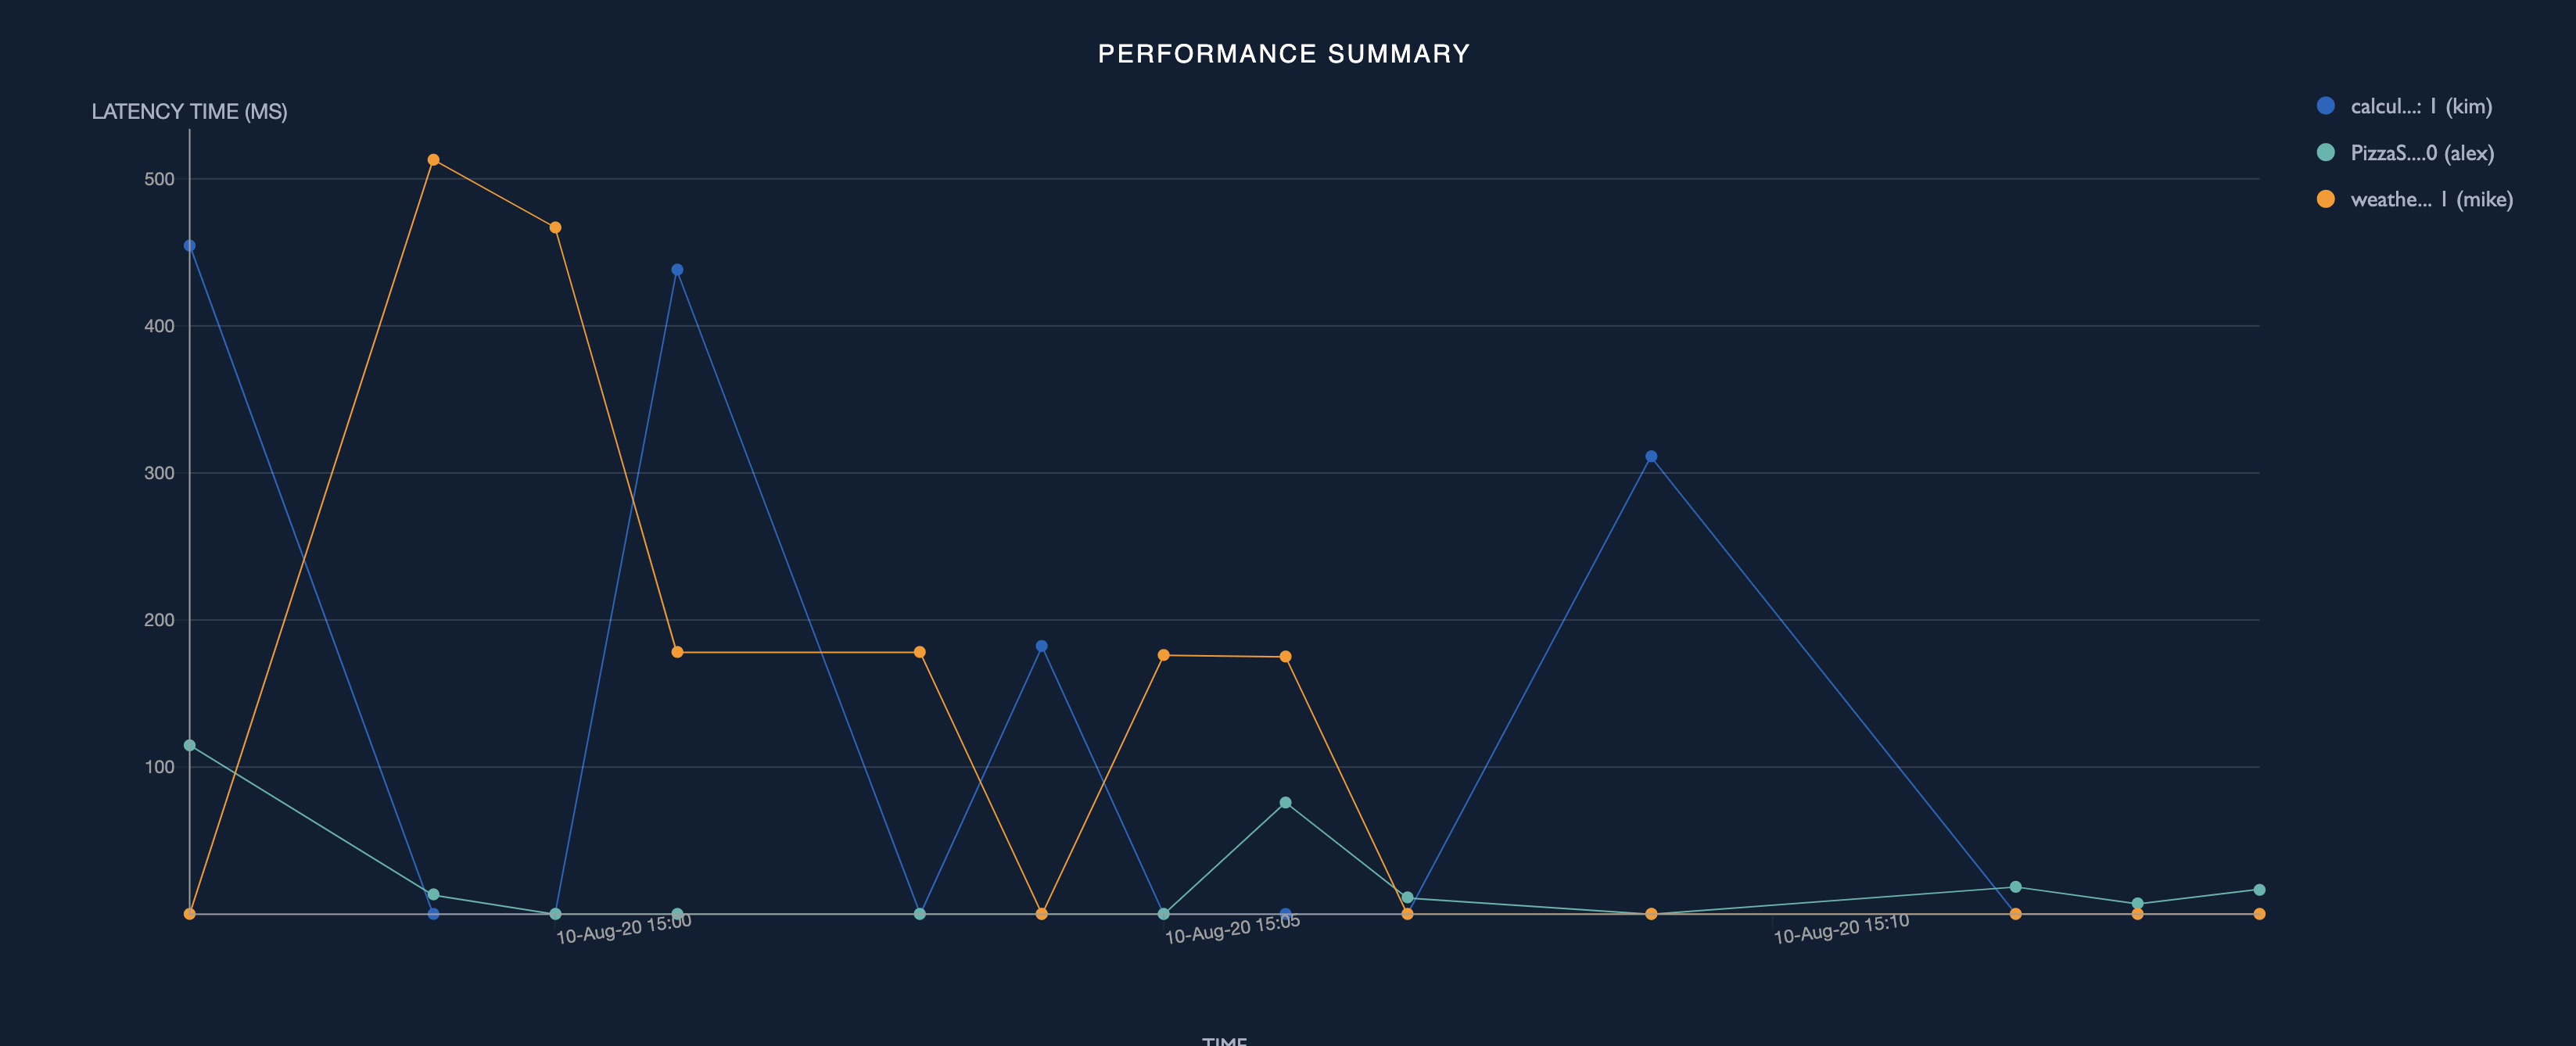
Performance summary
The performance summary widget displays the performance of selected API(s) over time for the specified time period. In this widget the average response time is taken as the performance of an API. Upon clicking on a data point in this graph, it will be redirected to the API latency time widget for the selected API which shows the latency of the API over time.
API performance
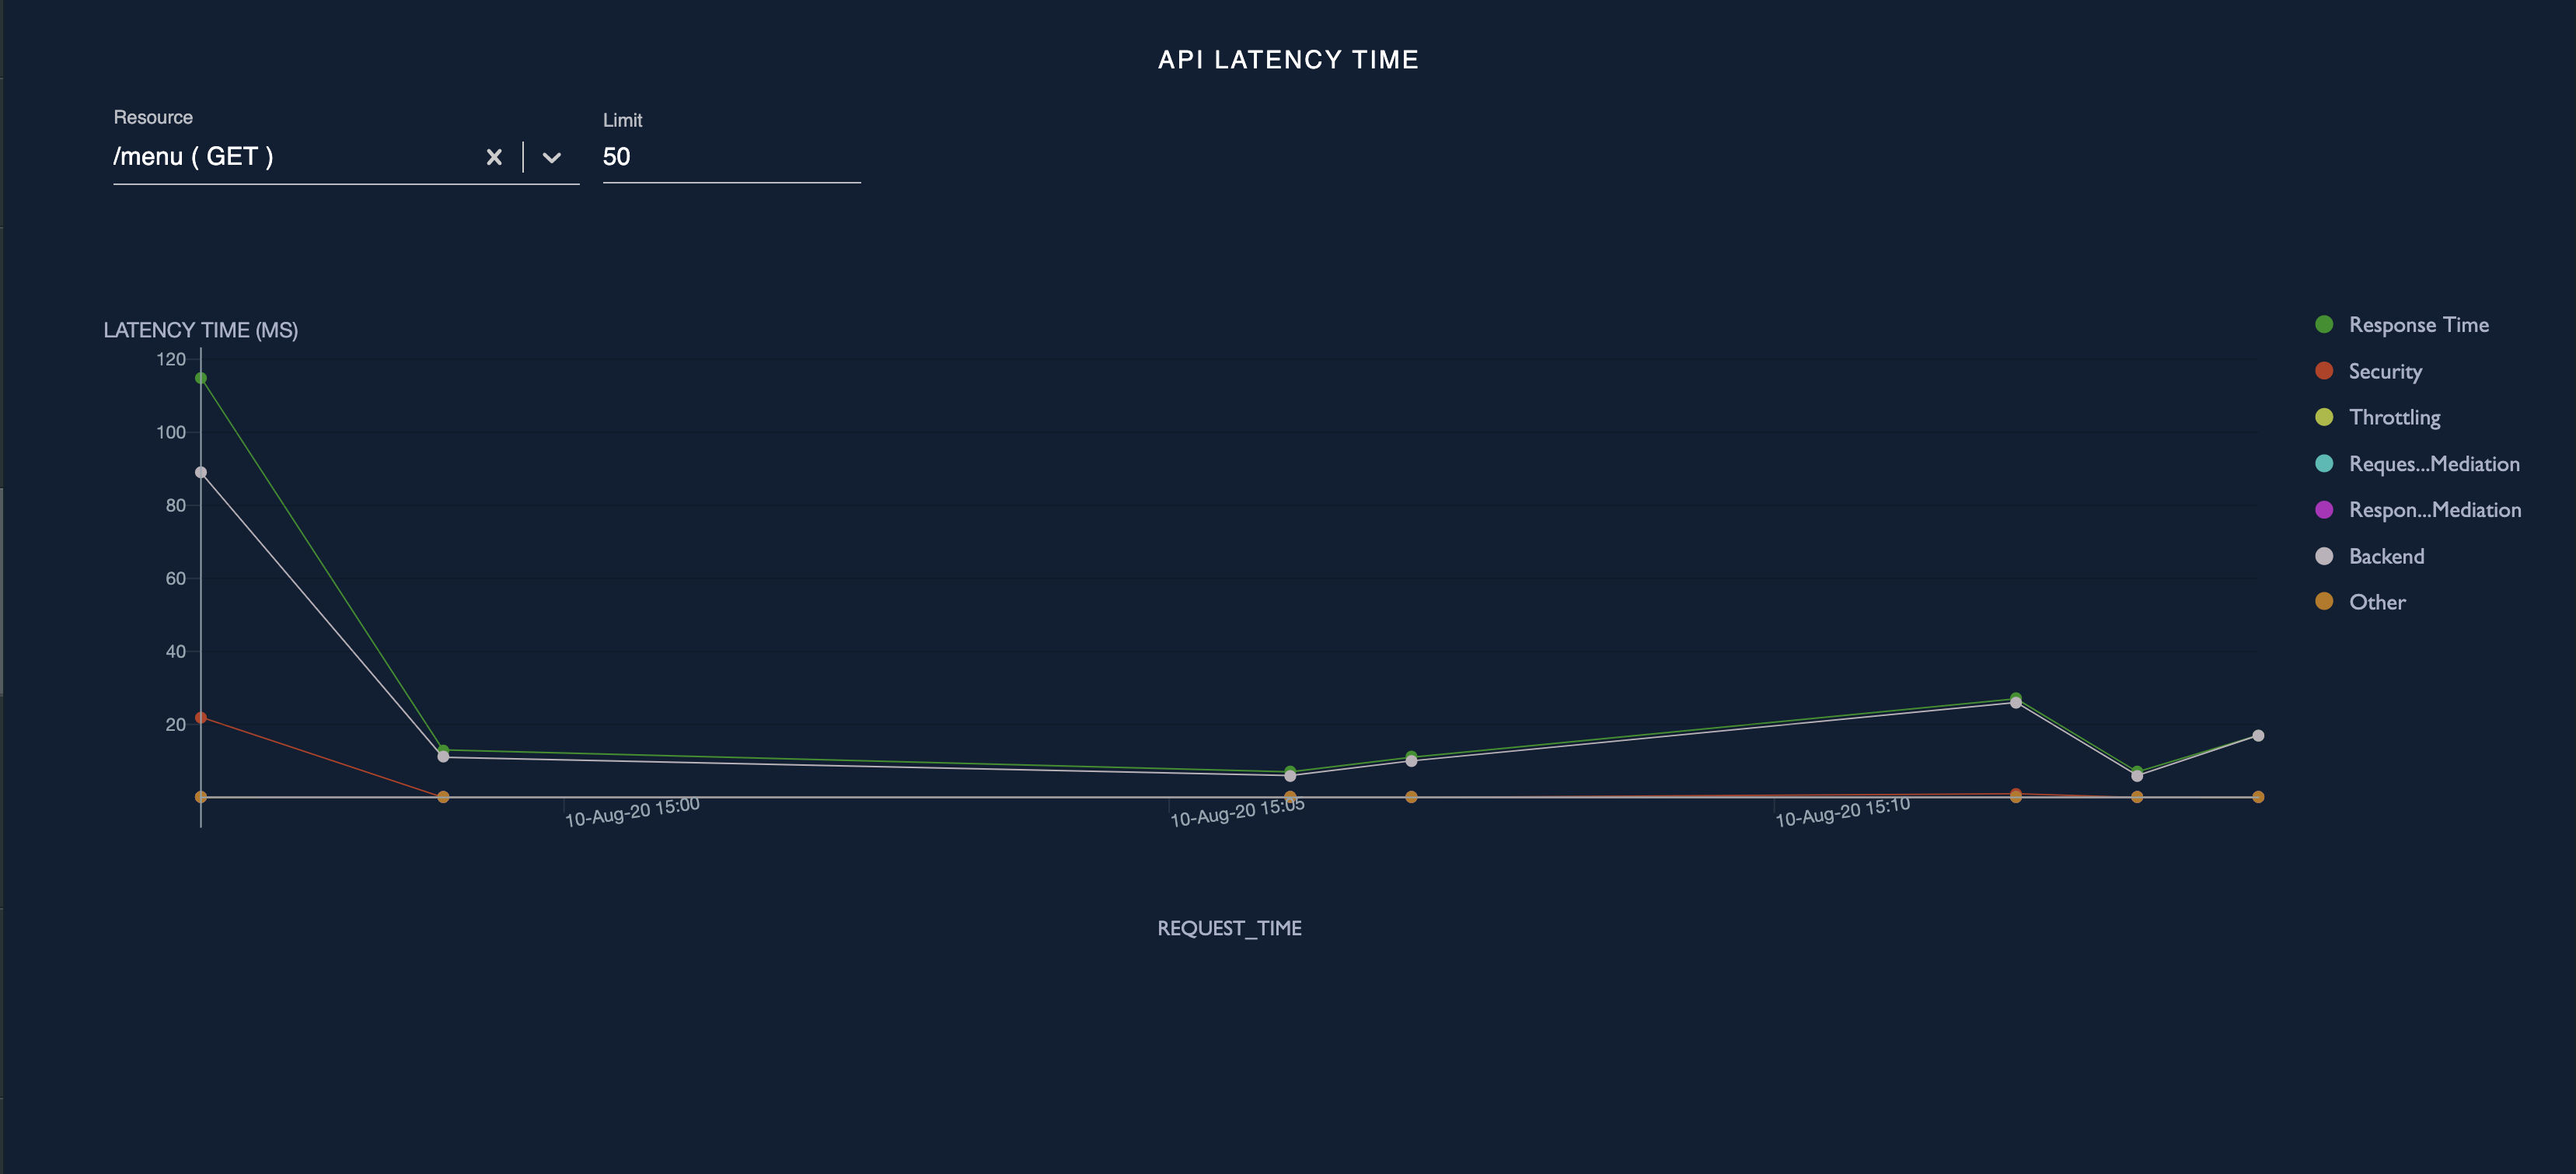
API latency time
The API latency time graph shows the latency breakdown of the selected resource of the selected API for the specified time period. The following latencies are displayed in this widget.
-
Response time: Total time taken for request/response flow
-
Security latency: Time taken for authentication
-
Throttling latency: Time taken for throttling the request/response
-
Request mediation latency: Time taken to mediate the request
-
Response mediation latency: Time taken to mediate the response
-
Backend latency: Time taken by the backend to return the response
-
Other latency: Time taken to process tasks other than mentioned above
Analysing throttled out API requests
Analysing how API requests get throttled out will help identify changes that need to be made to throttling policies and will also help identify opportunities to promote/monetize throttling policies for APIs. This will also provide insight for planning future infrastructure upgrades. Information related to throttled out API requests can be found in the following pages of the Business Analytics Dashboard:
Throttle summary
The throttle summary page provides a summarized over time view of the throttled out request count of selected API(s).
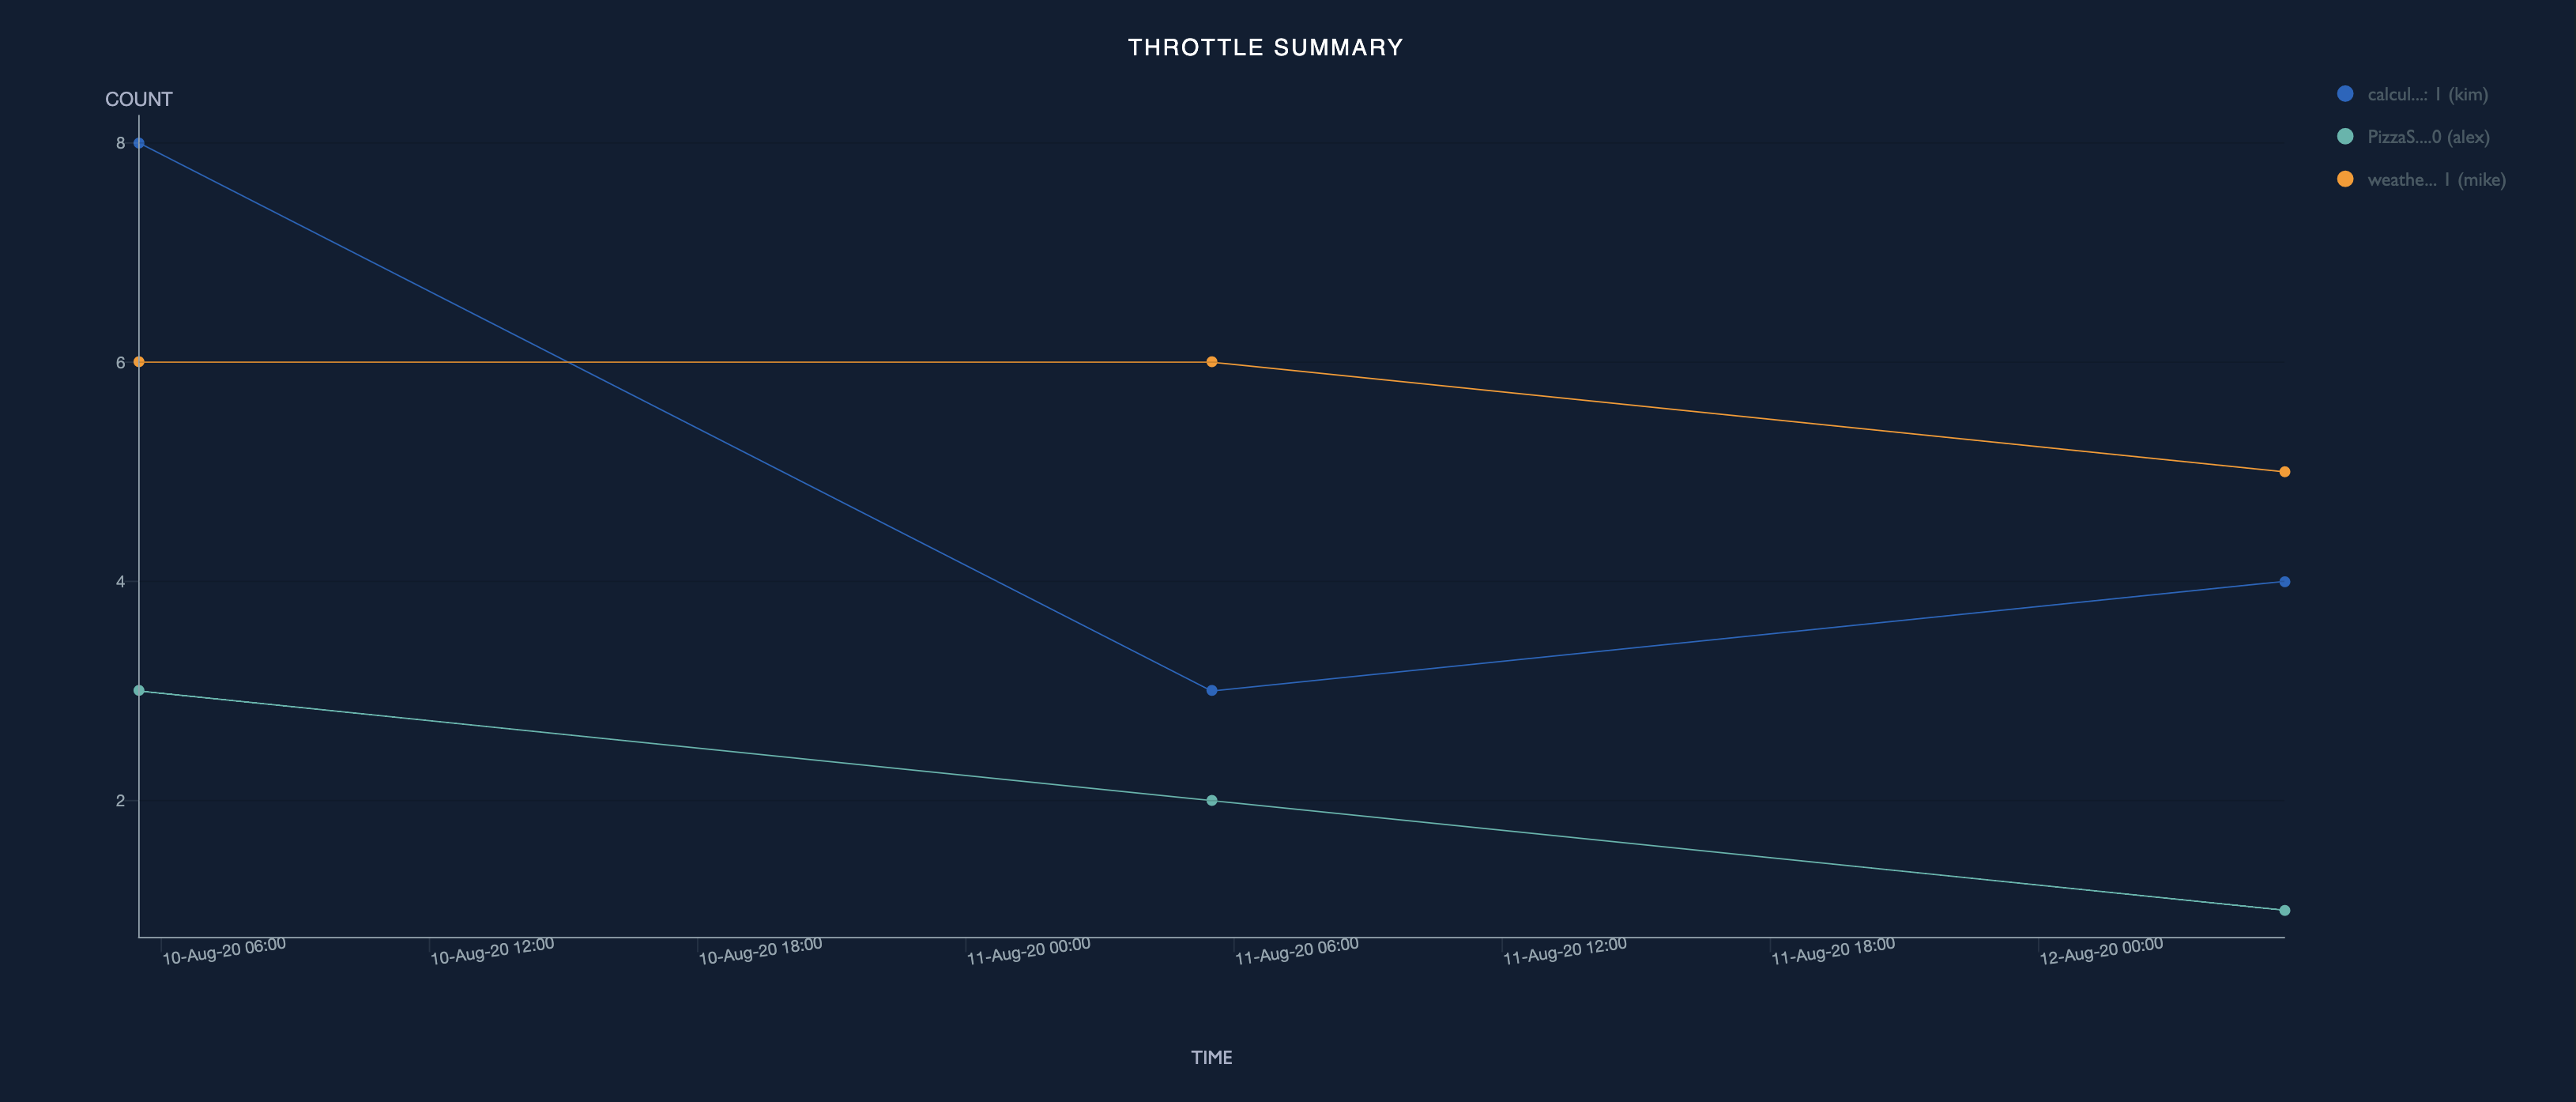
Throttle summary
The throttle summary widget shows the throttled counts of the selected API(s) as an overtime graph for the specified time period. Click on a data point in this graph to see the API throttled out requests over time graph.
Error summary
The error summary page provides information about the APIs with the highest throttled out request and faulty request counts(refer error analysis section for more details). The top throttled out APIs widget available in this page helps identify the most throttled out APIs.
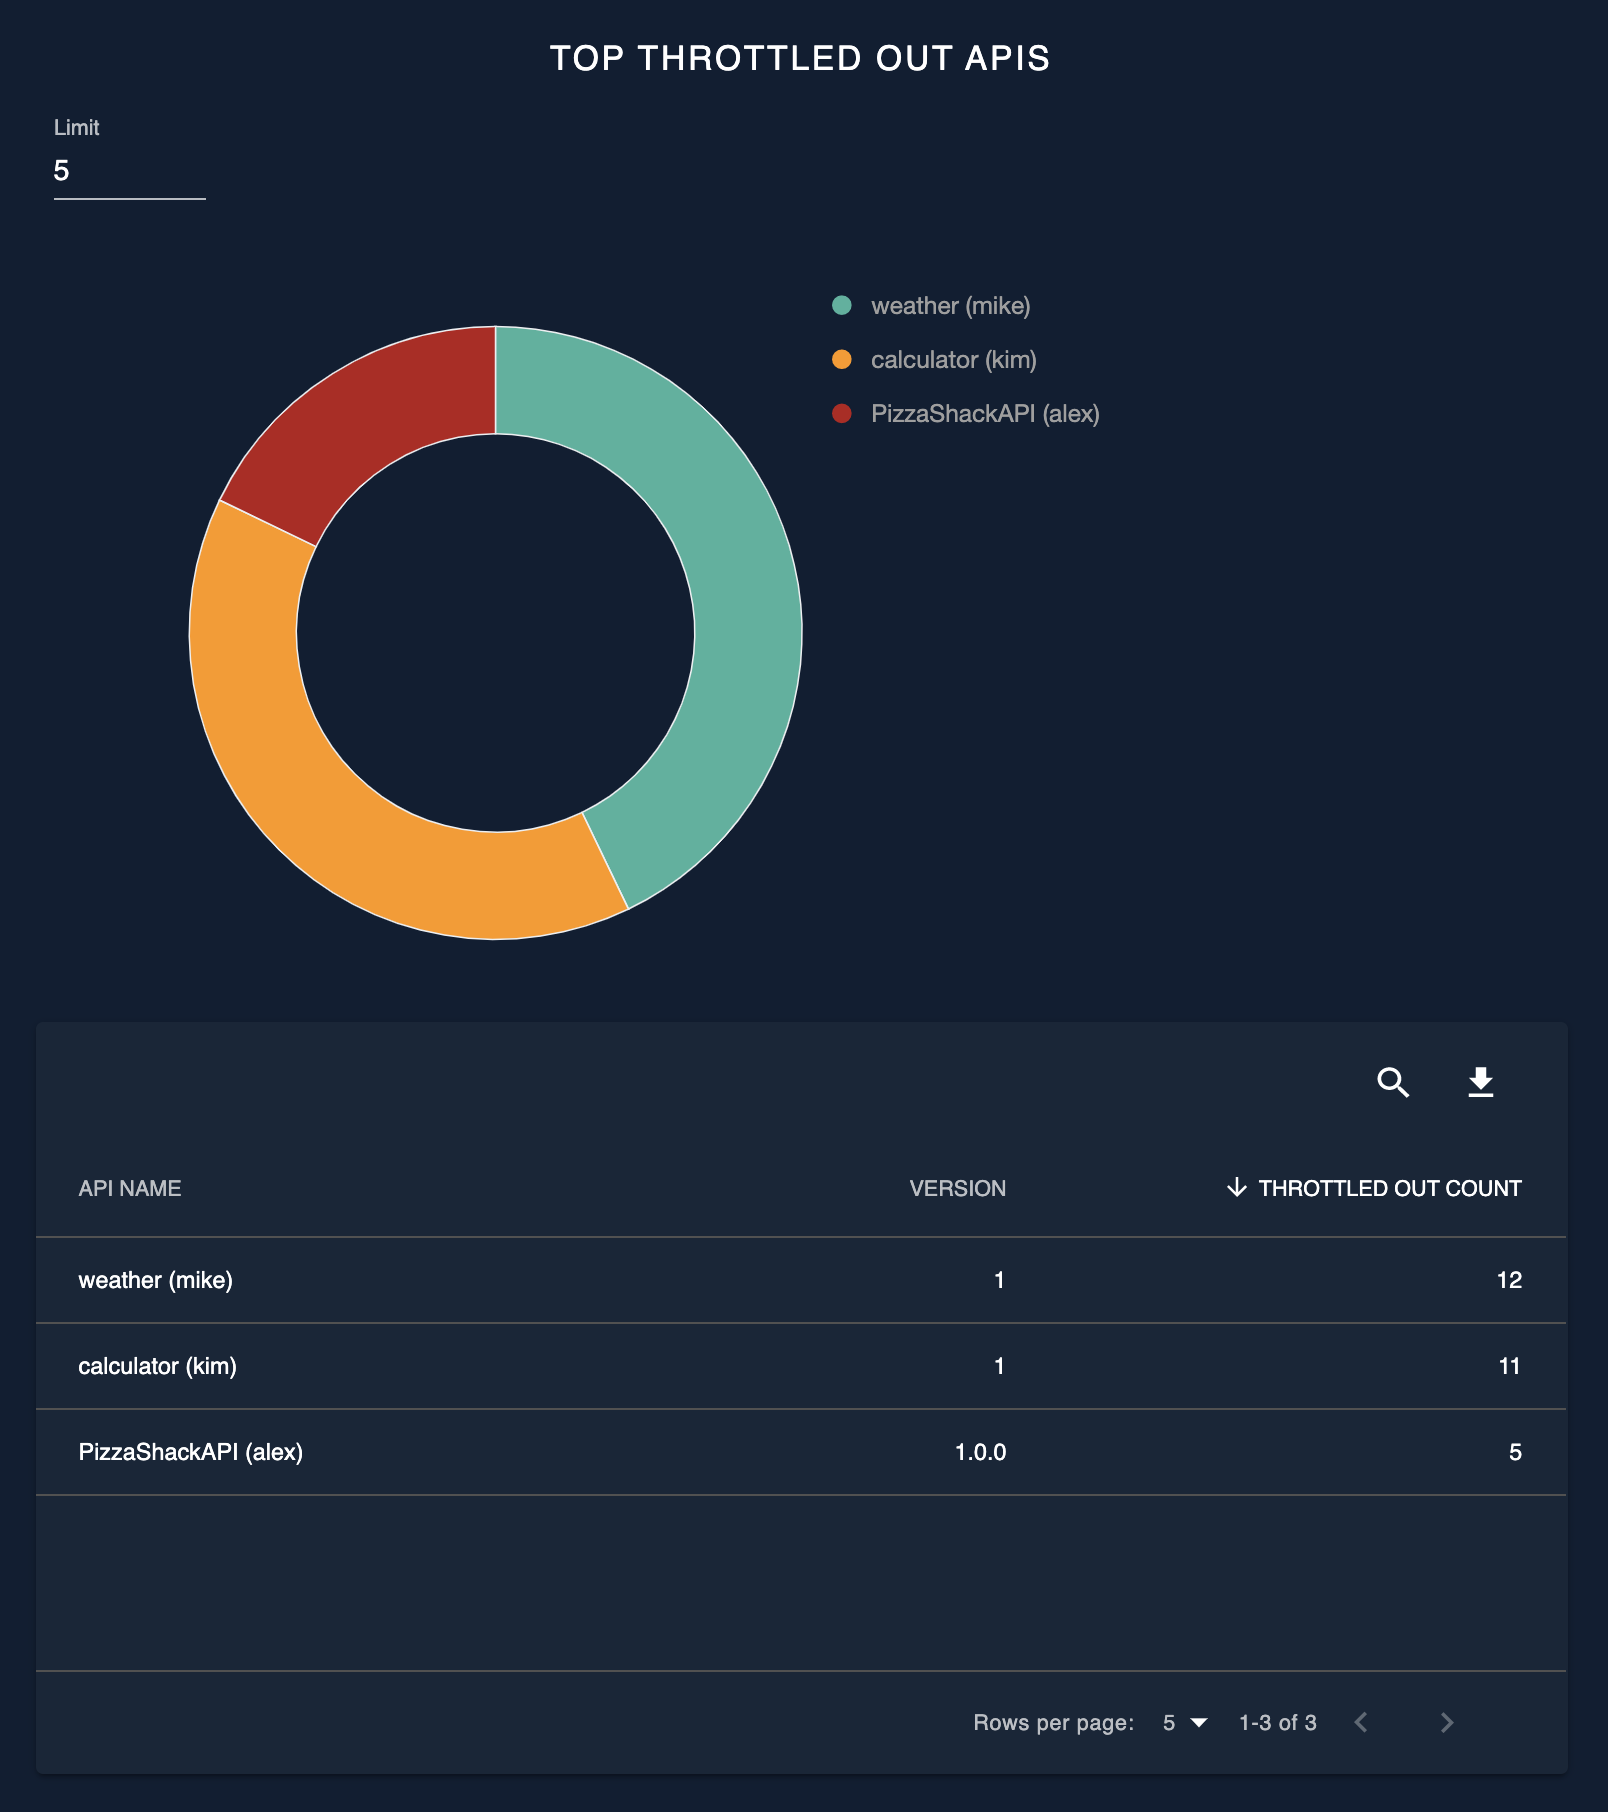
Top throttled out APIs
The top throttled out APIs widget displays the APIs with the highest throttled out request count within the specified time range. This widget comprises of 2 representations:
- A pie chart which shows a percentage wise comparison of the throttled out requests of the APIs
- A table which shows the throttled out request count of the API
Click on an API on the pie chart or the table to see the breakdown of the selected API's throttled request over time and by application.
API errors
The API errors page provides information about the throttled out requests and faulty requests(refer error analysis section for more details) of a selected API. The API throttled out requests over time widget provides an overtime representation of the throttled out invocations of the selected API.
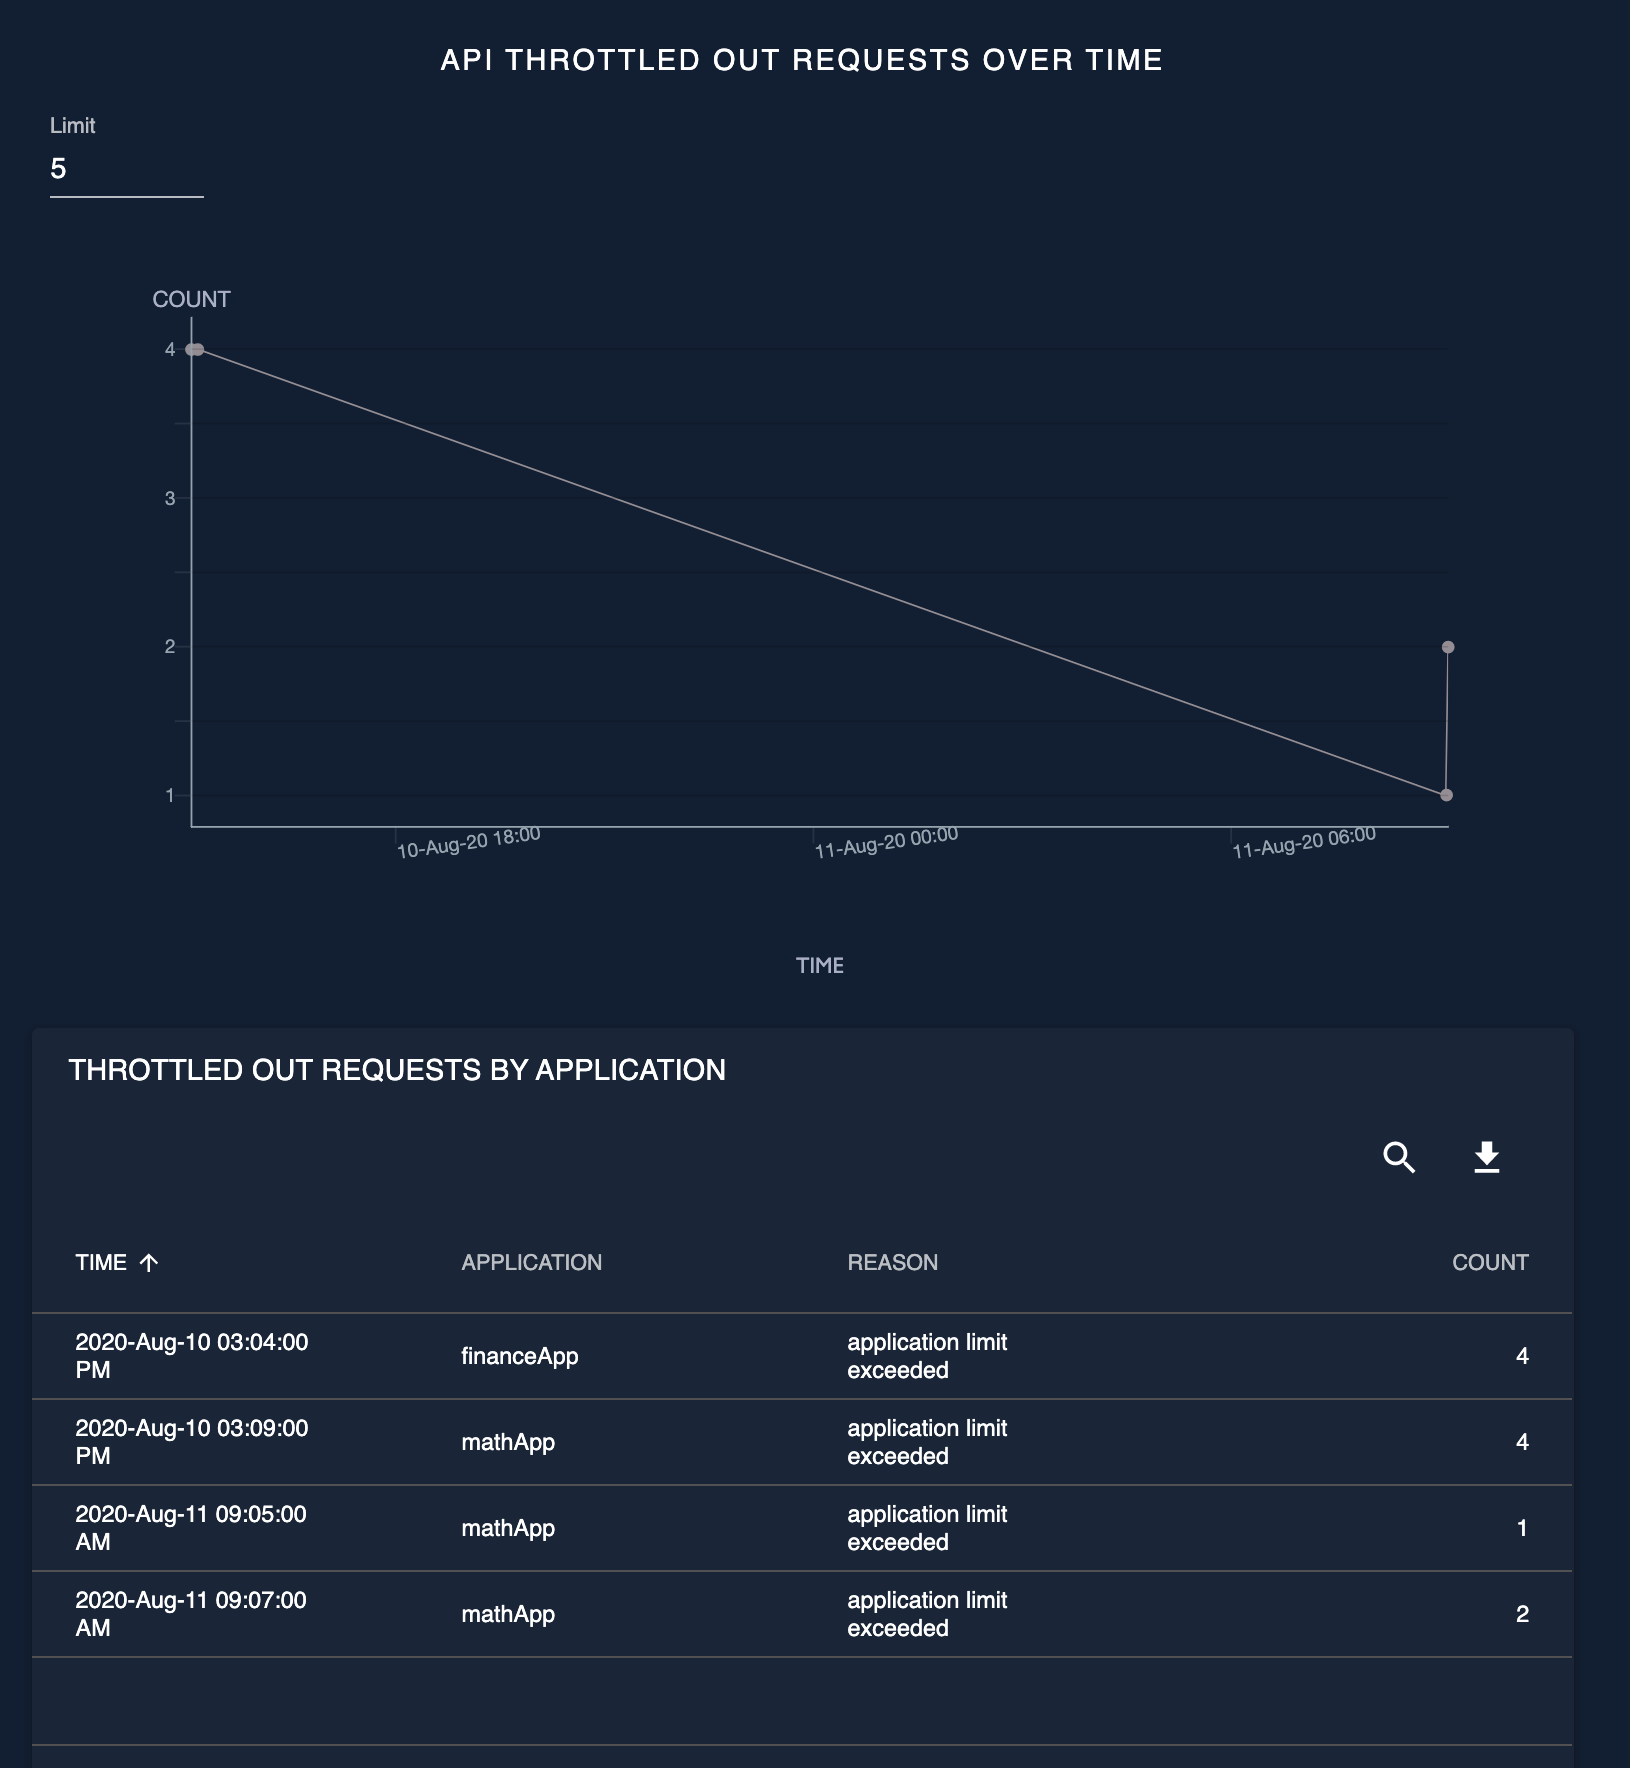
API throttled out requests over time
API throttled out requests over time widget shows how the selected API was throttled out overtime for the specified time range. This widget contains 2 representations;
- A timeline graph which shows the throttled out request count over time
- A table which shows an application wise breakdown of the throttle count and reason for throttling
Error analysis
Error analysis will help identify problematic APIs so that proactive measures could be taken to improve these APIs. API error related data are displayed in the following pages in the business analytics dashboard:
Error summary
The error summary page provides information about the APIs with the highest throttled out request(refer analysing throttled out API requests section for more details) and faulty request counts. The top faulty APIs widget available in this page helps identify the APIs with the most faulty invocations.
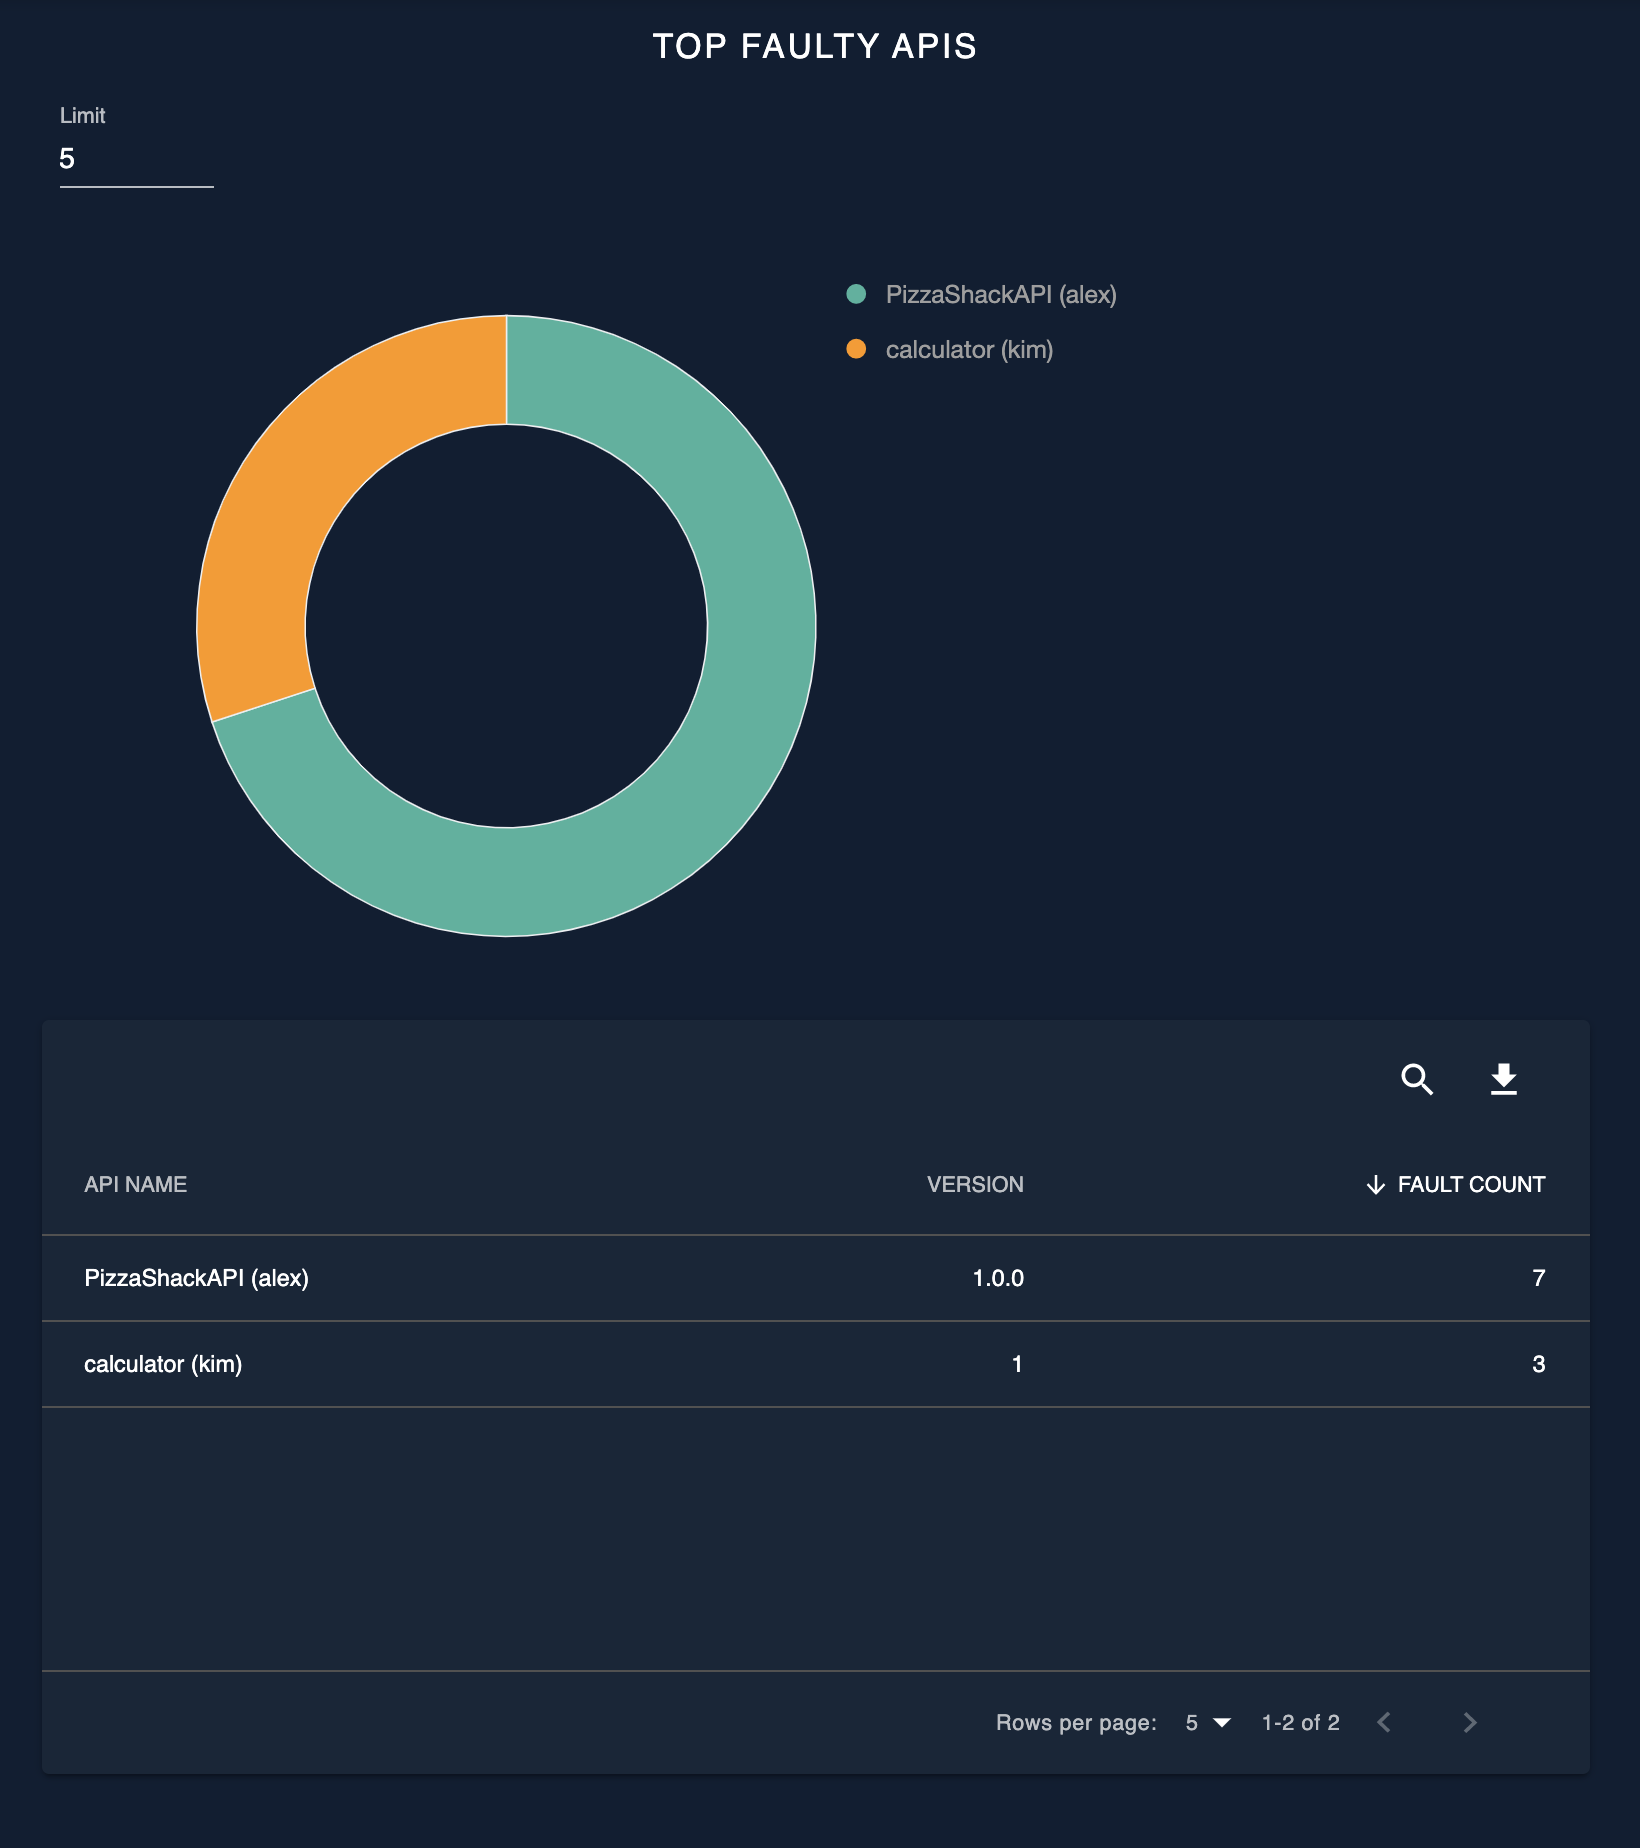
Top faulty APIs
The top faulty APIs widget displays the APIs with the highest faulty request count within the specified time range. This widget comprises of 2 representations:
- A pie chart which shows a percentage wise comparison of the faulty requests of the APIs
- A table which shows the faulty request count of the APIs
Click on an API on the pie chart or the table to see the representation of the faulty invocations over time of the selected API.
API errors
The API errors page provides information about the throttled out requests(refer analysing throttled out API requests section for more details) and faulty requests of a selected API. The API faults over time widget provides an overtime representation of the faulty invocations of the selected API.
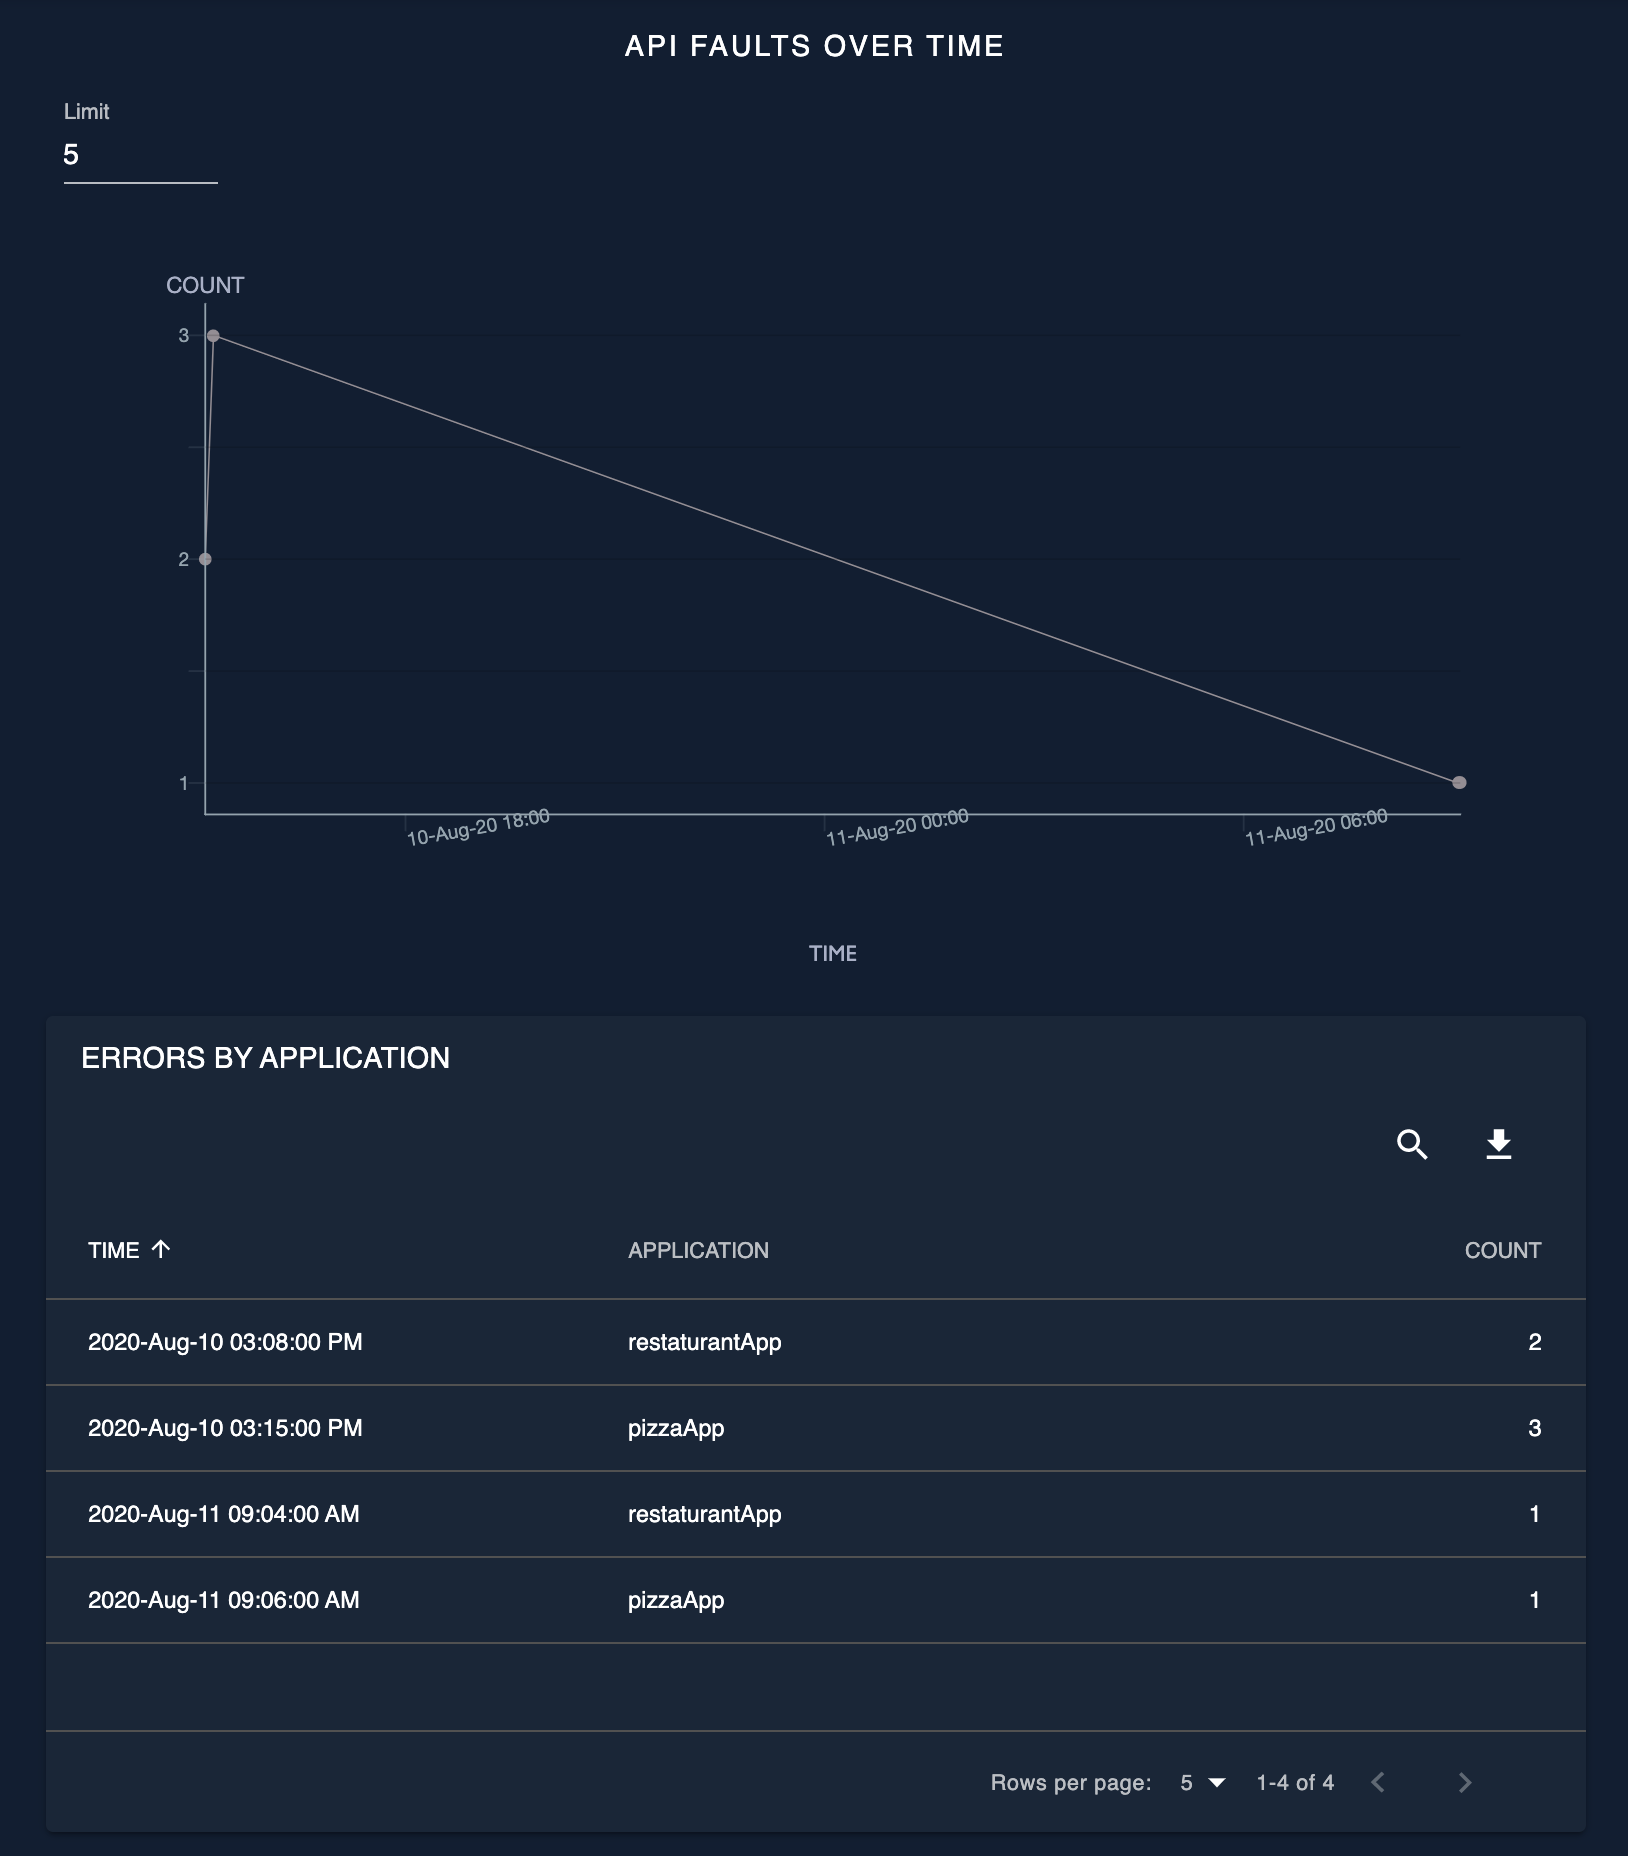
API faults over time
API faults over time widget shows the faulty invocations of the selected API overtime for the specified time range. This widget contains 2 representations:
- A timeline graph which shows the faulty request count over time
- A table which shows an application wise breakdown of the faulty request count
Devices and User agent analysis
Platforms(OS) and User agent-based analytics are presented on the devices page in the business analytics dashboard. There are two widgets to show Platform and User agent-based API Invocations. The API Dimension selector is available to filter multiple APIs and aggregated results will display in both widgets. The date-time range is also applicable here to get data within a selected time range.
Top platforms
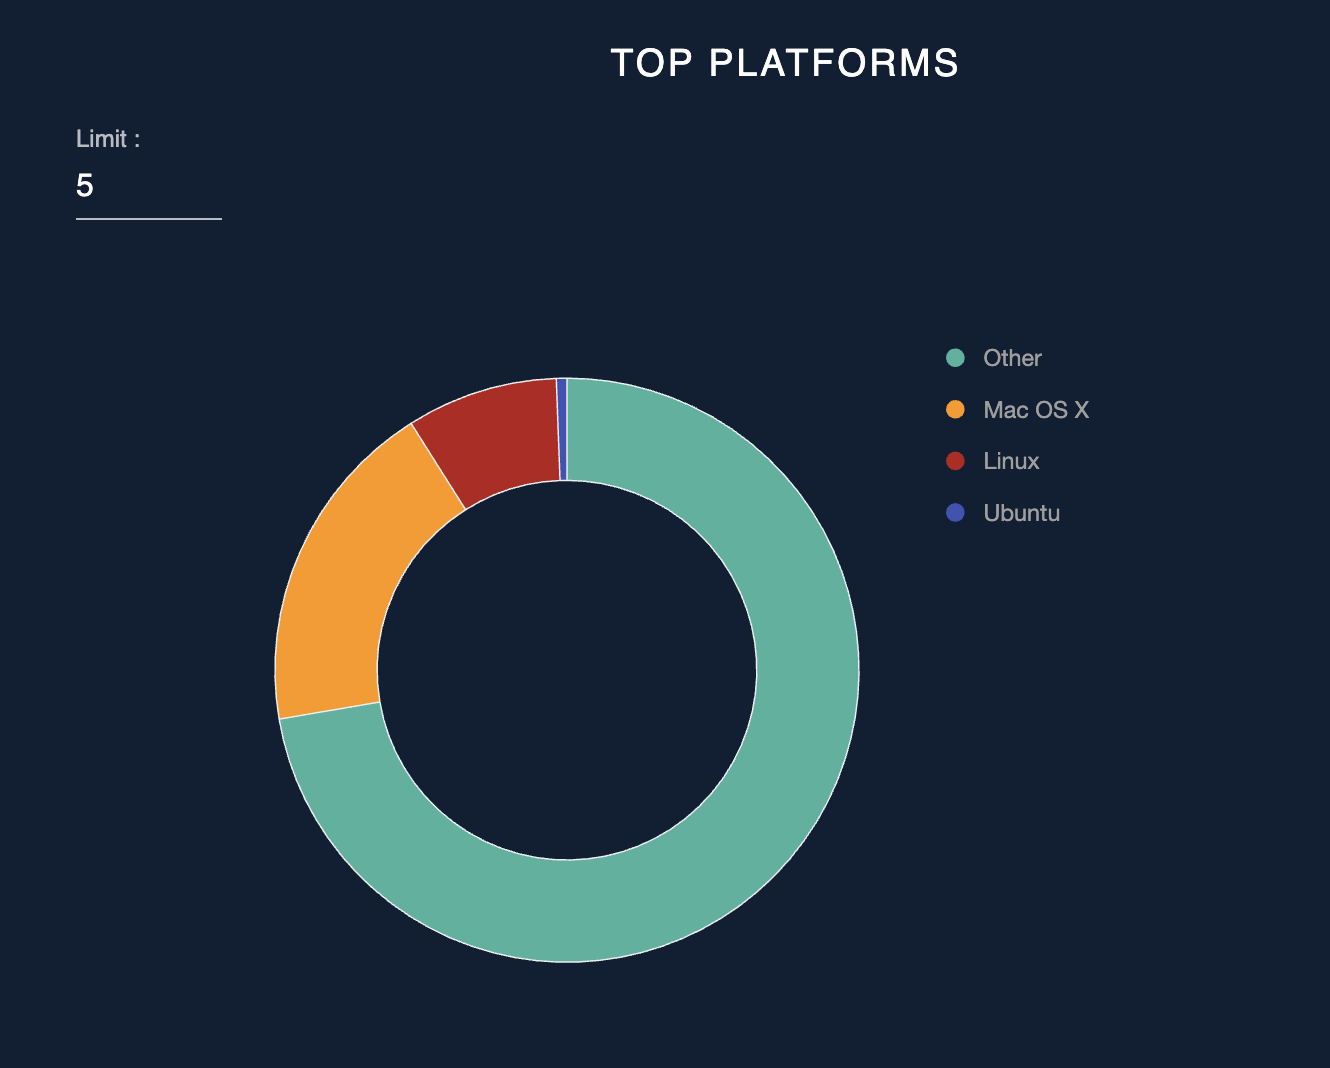
This shows the top platform APIs are accessed. It is represented in a pie chart for easy comparison and shows the percentage of the API invocation count. This widget can be used to identify the top platform used to access the APIs and top platform applications use.
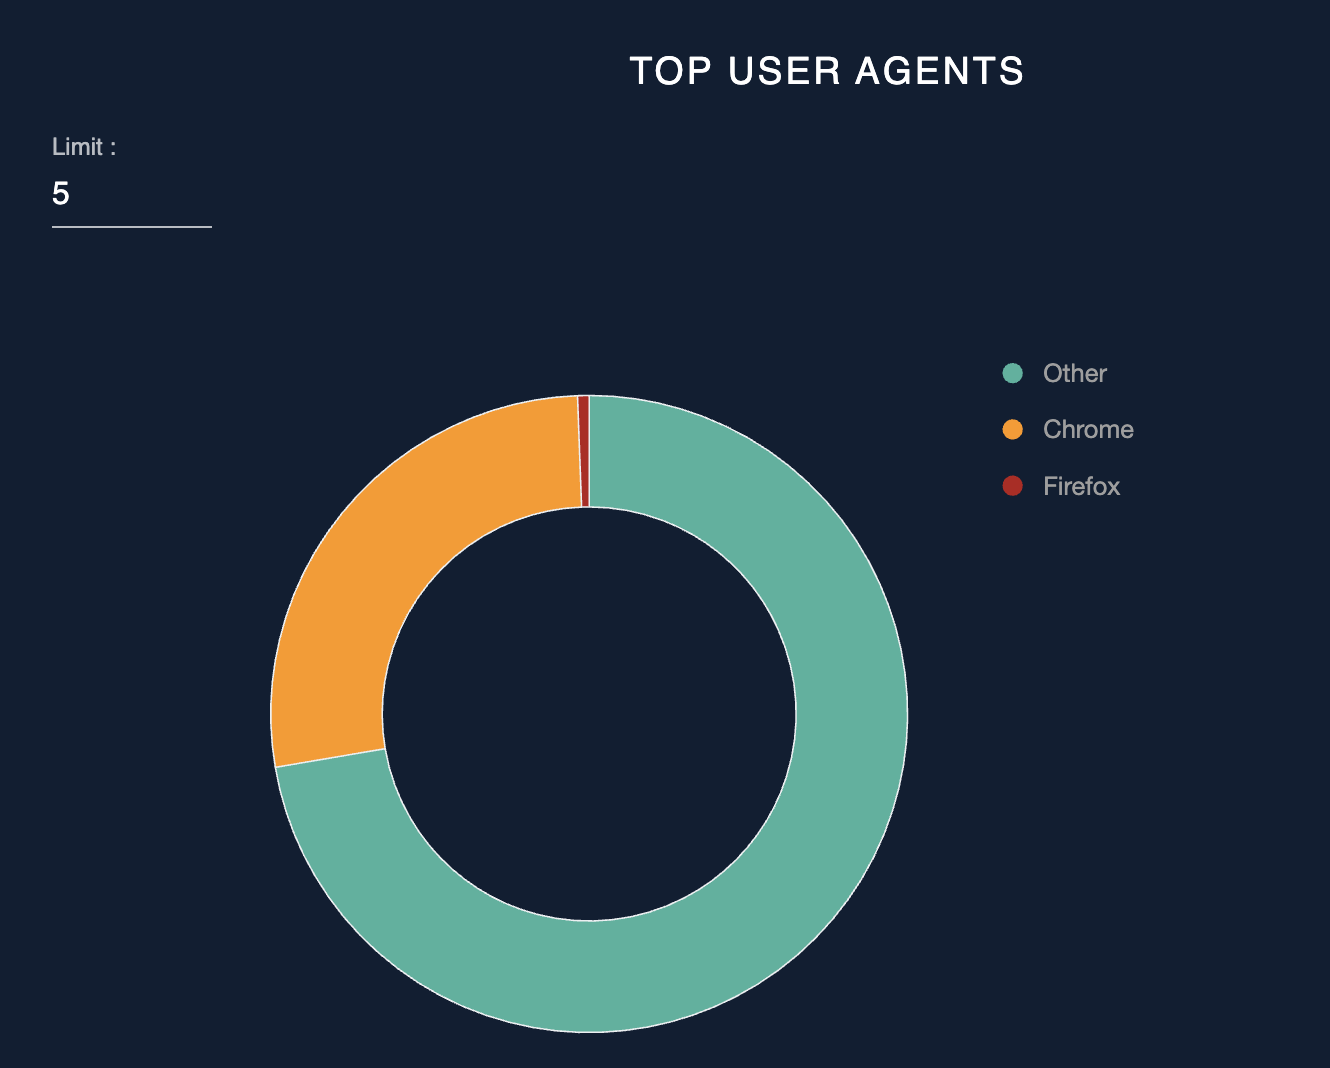
Top user agents
This is represented in a pie chart and shows the top agents this API is accessed. It shows the percentage of the invocations and pie chart makes it easy to easily compare the agent types.
Platforms and user agents are extracted from the information in the API request. The X-forwarded-for header is used in this case. This header needs to be included in the request headers to make these widgets work correctly. There are some scenarios where header values can be injected into the request when it flows through the network hops. But it is required to send this header via the actual end-user or device to make the chart populate correctly.
A library is used to extract this information from the header. By default, API Analytics defines limited platforms and user agents to identify in a header. This is to improve performance and having too many could increase the searching time. Values to be identified can be configured by defining in the
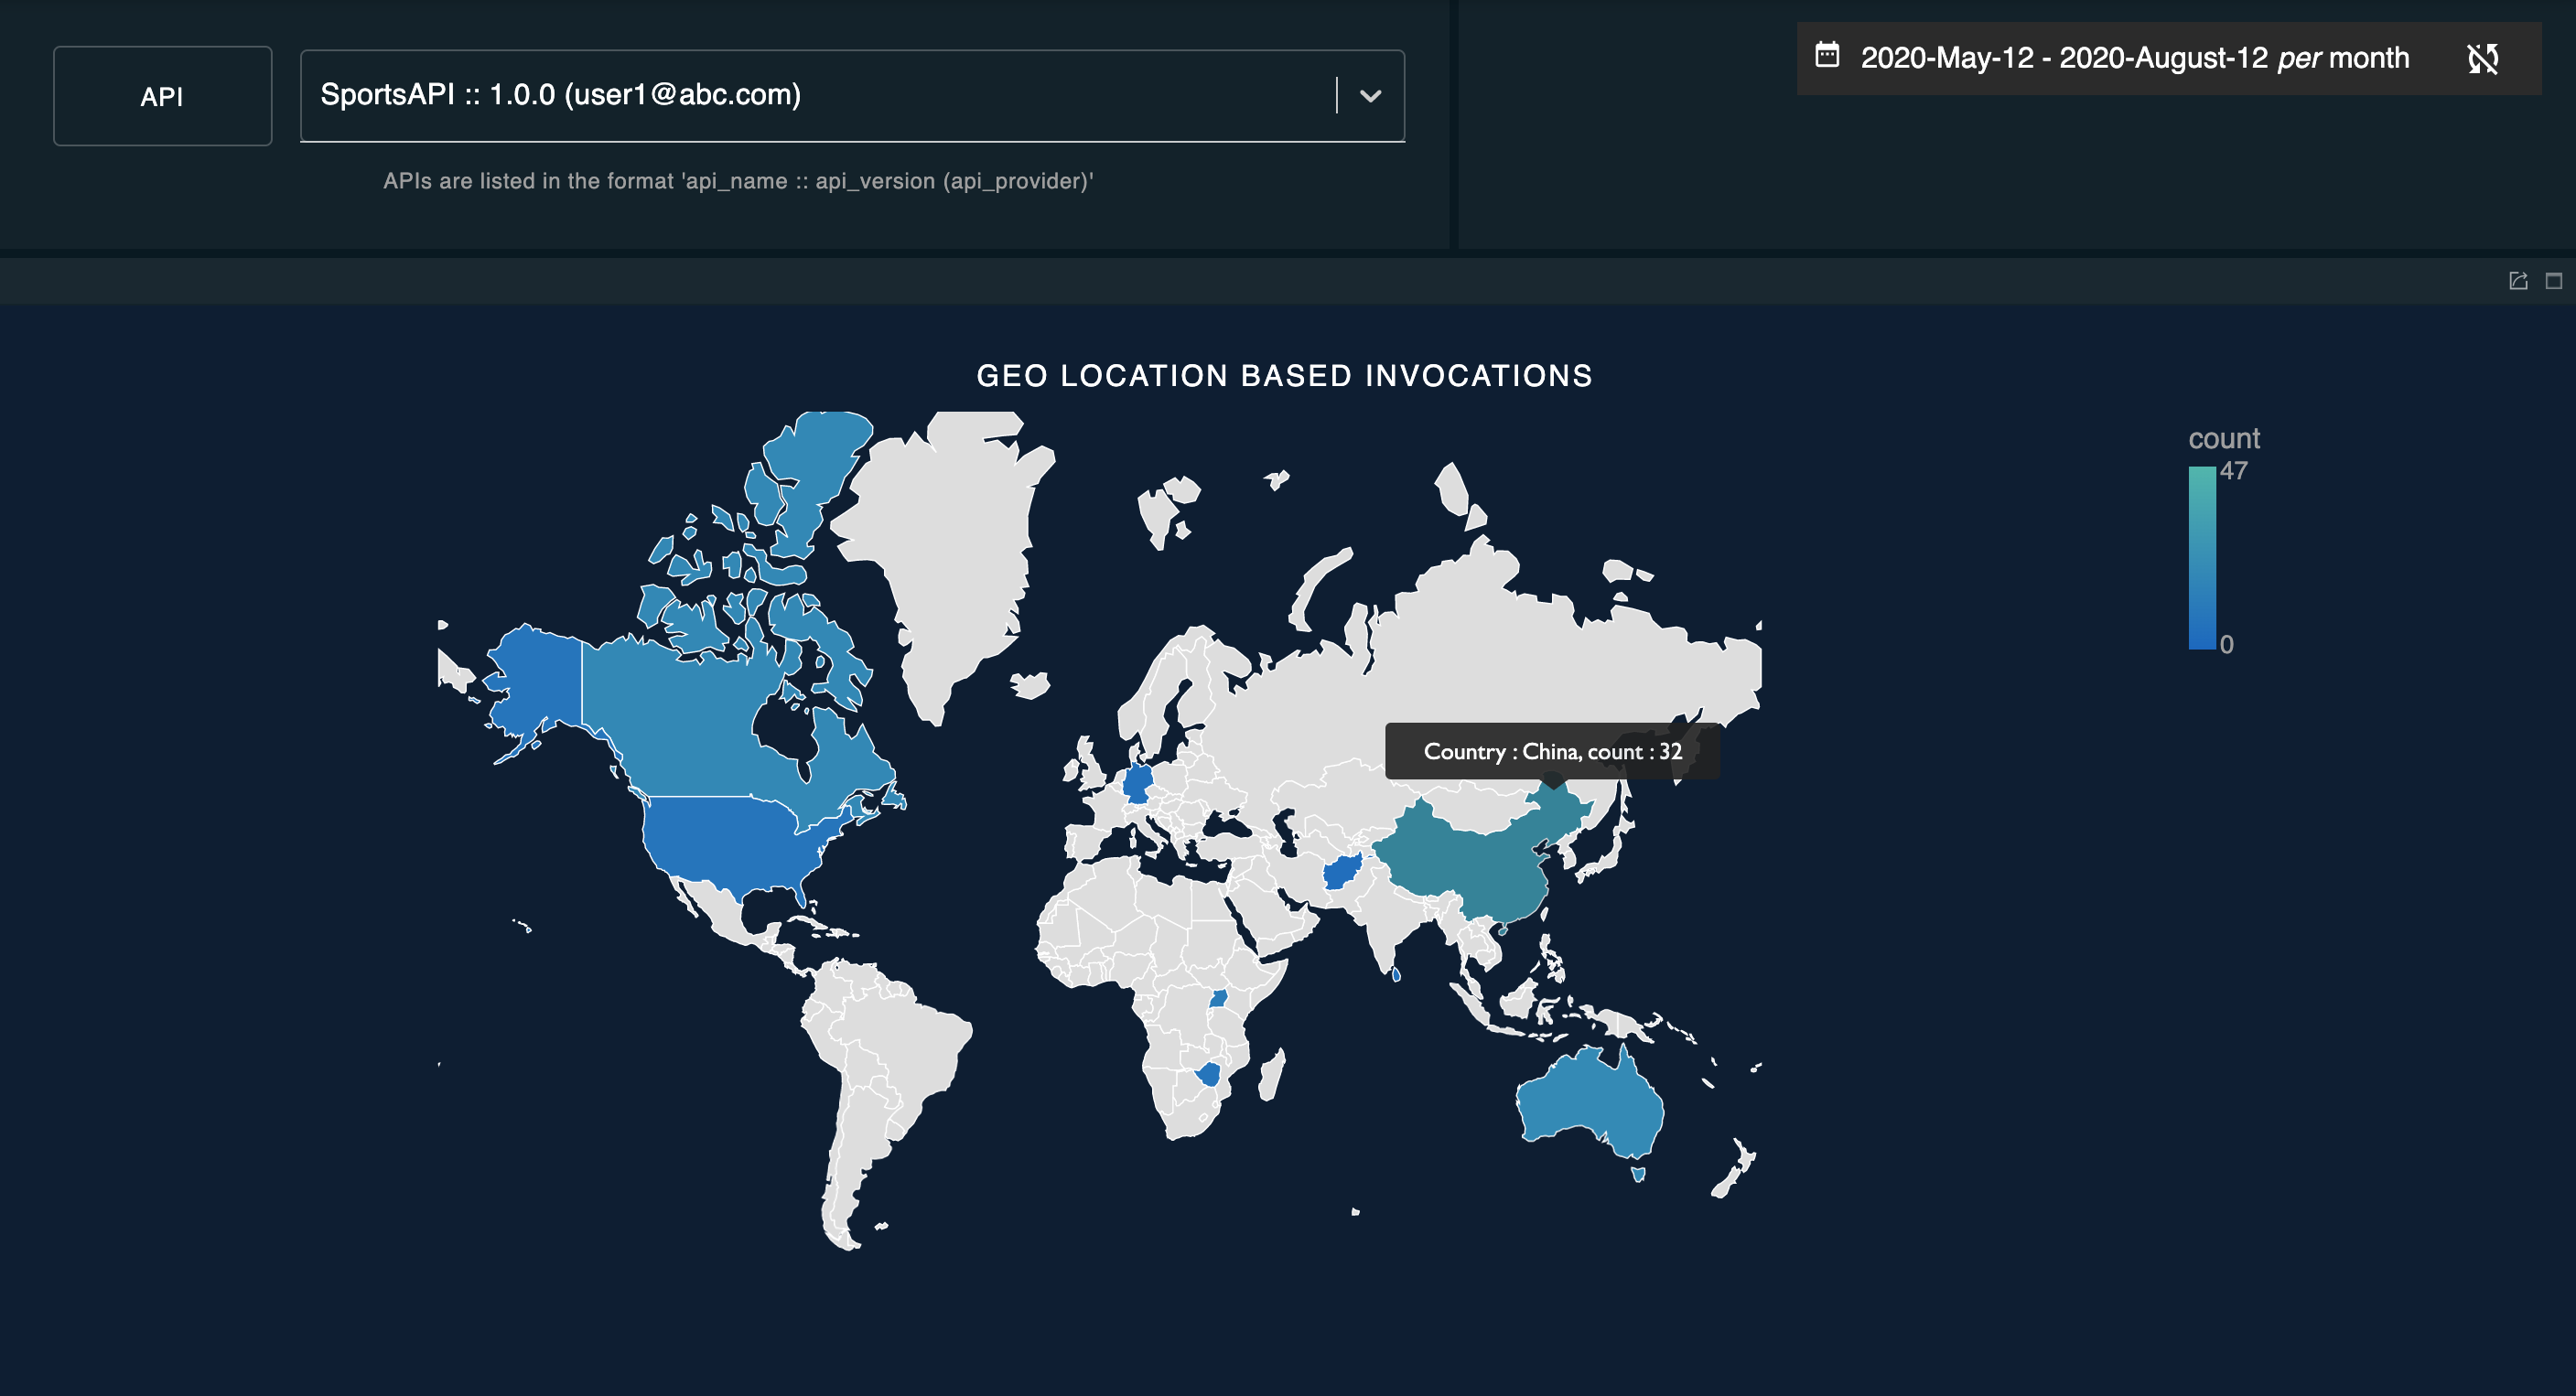
Geo location based invocations
The Geo location based invocations widget shows the number of invocations made for a particular API for a given Geolocation over a given time period. Using this widget, the user will be able to identify the key locations where the APIs are invoked and act accordingly to improve the API usage(i.e., load balancing)
Here, Geolocation based statistics are used to carry out detailed monitoring of geographic locations. Geographic location is identified from X-Forwarded-For header with the relevant IP in the API request. For more information, see Using Geolocation Based Statistics.