Application analytics
Info
Similar to the other dashboards, the Application Analytics Dashboard can be viewed by admin users and users who have the internal/subscriber role. By default, the dashboard cannot be viewed by users having the internal/analytics role.
However, these permissions can be changed based on your preferences using the Settings option in the dashboard. For more information, see Managing Analytics Dashboard Permissions.
Log into the analytics-dashboard application and access application analytics dashboard (ex: https://localhost:9643/analytics-dashboard/dashboards/application) dashboard from there.
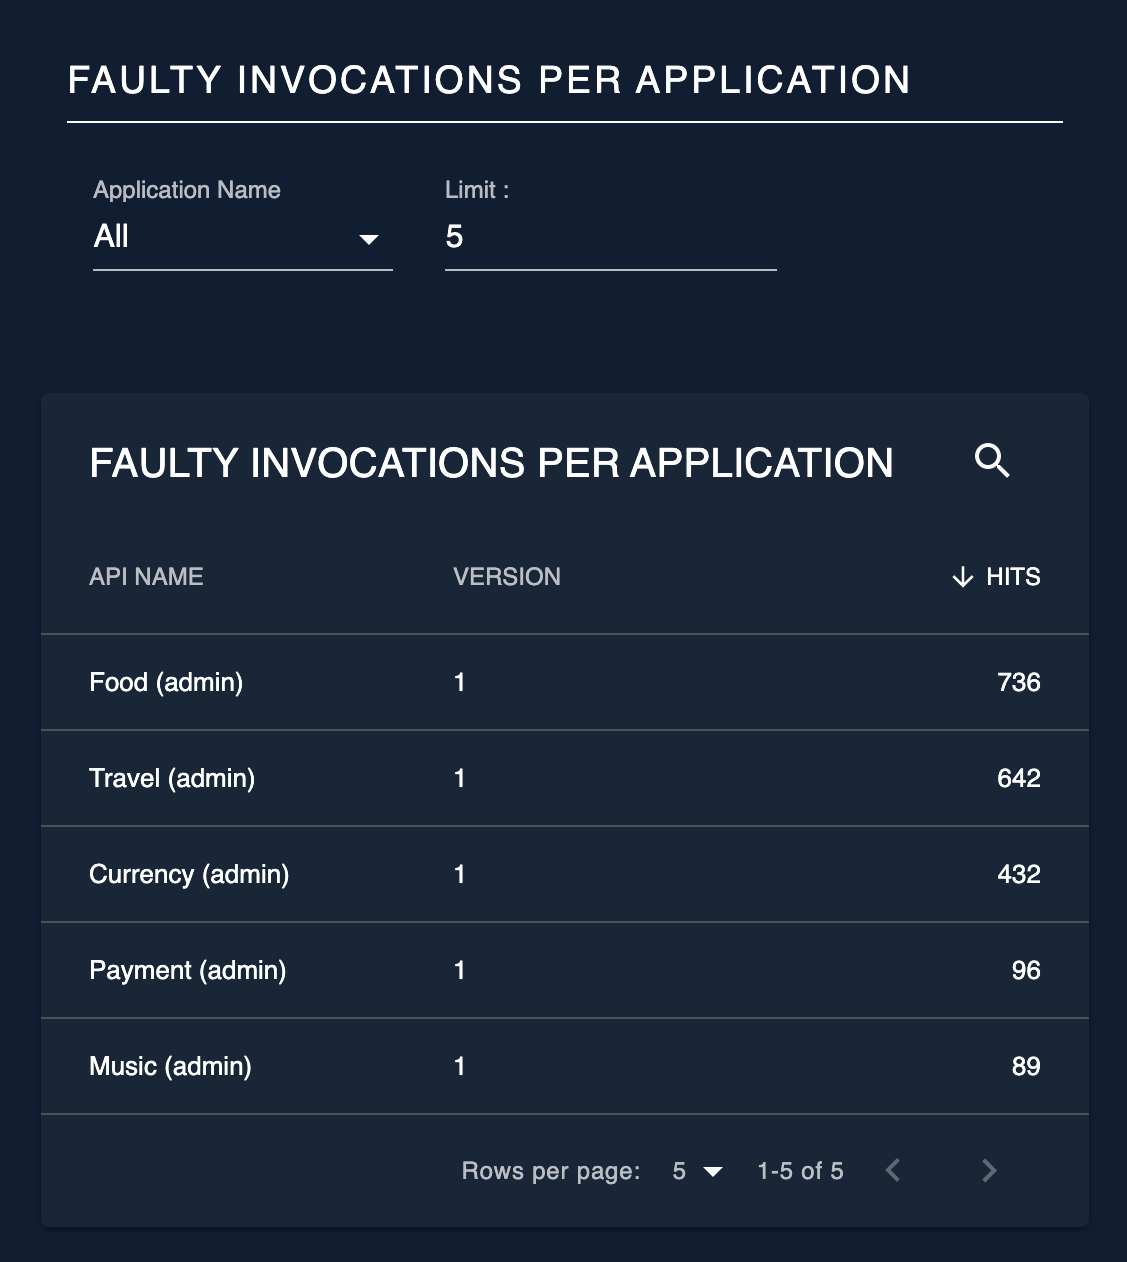
Faulty Invocation per Application
In a faulty API invocation, the message is mediated though the fault sequence. By default, the API Manager considers an API invocation to be faulty when the backend service is unavailable or if a runtime exception occurs that is related to the backend communication. The total number of invocations made by each application that are faulty are represented in these statistics.
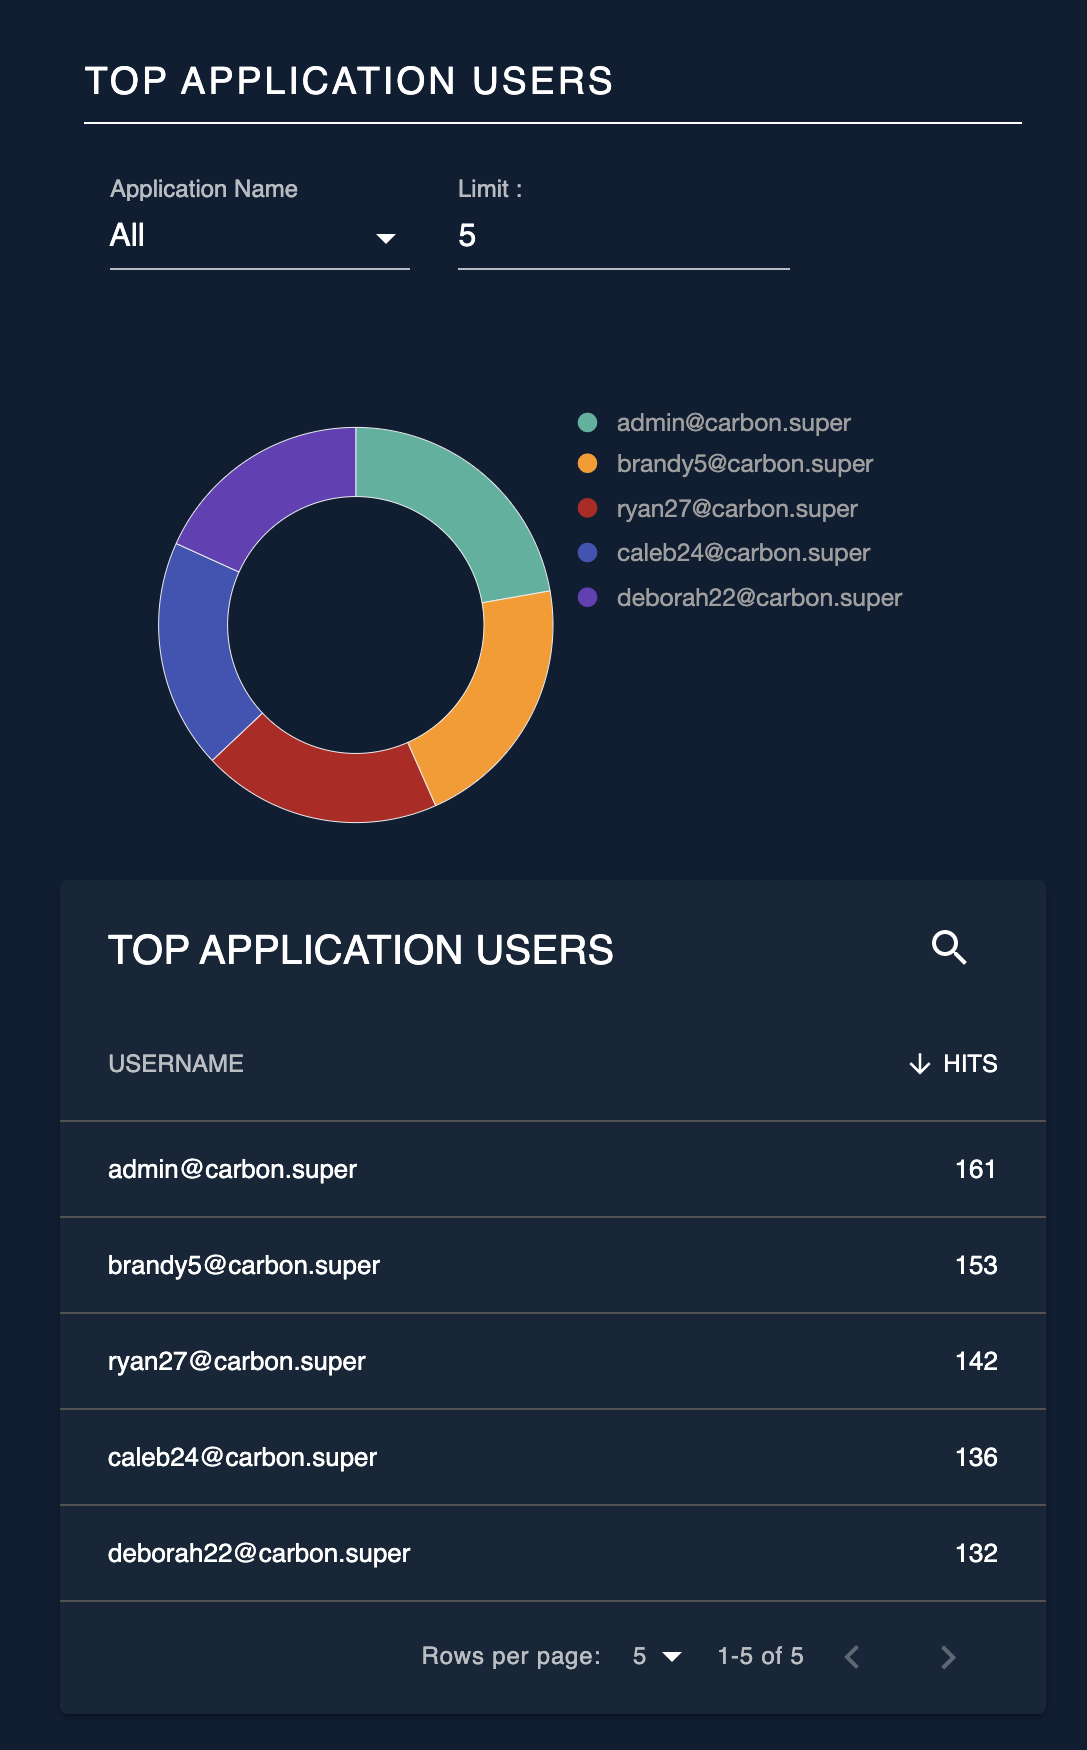
Top Application Users
This widget displays the users who made the largest number of API calls per application. You also can limit the number of users that needs to be listed by changing the limit filter in the UI.
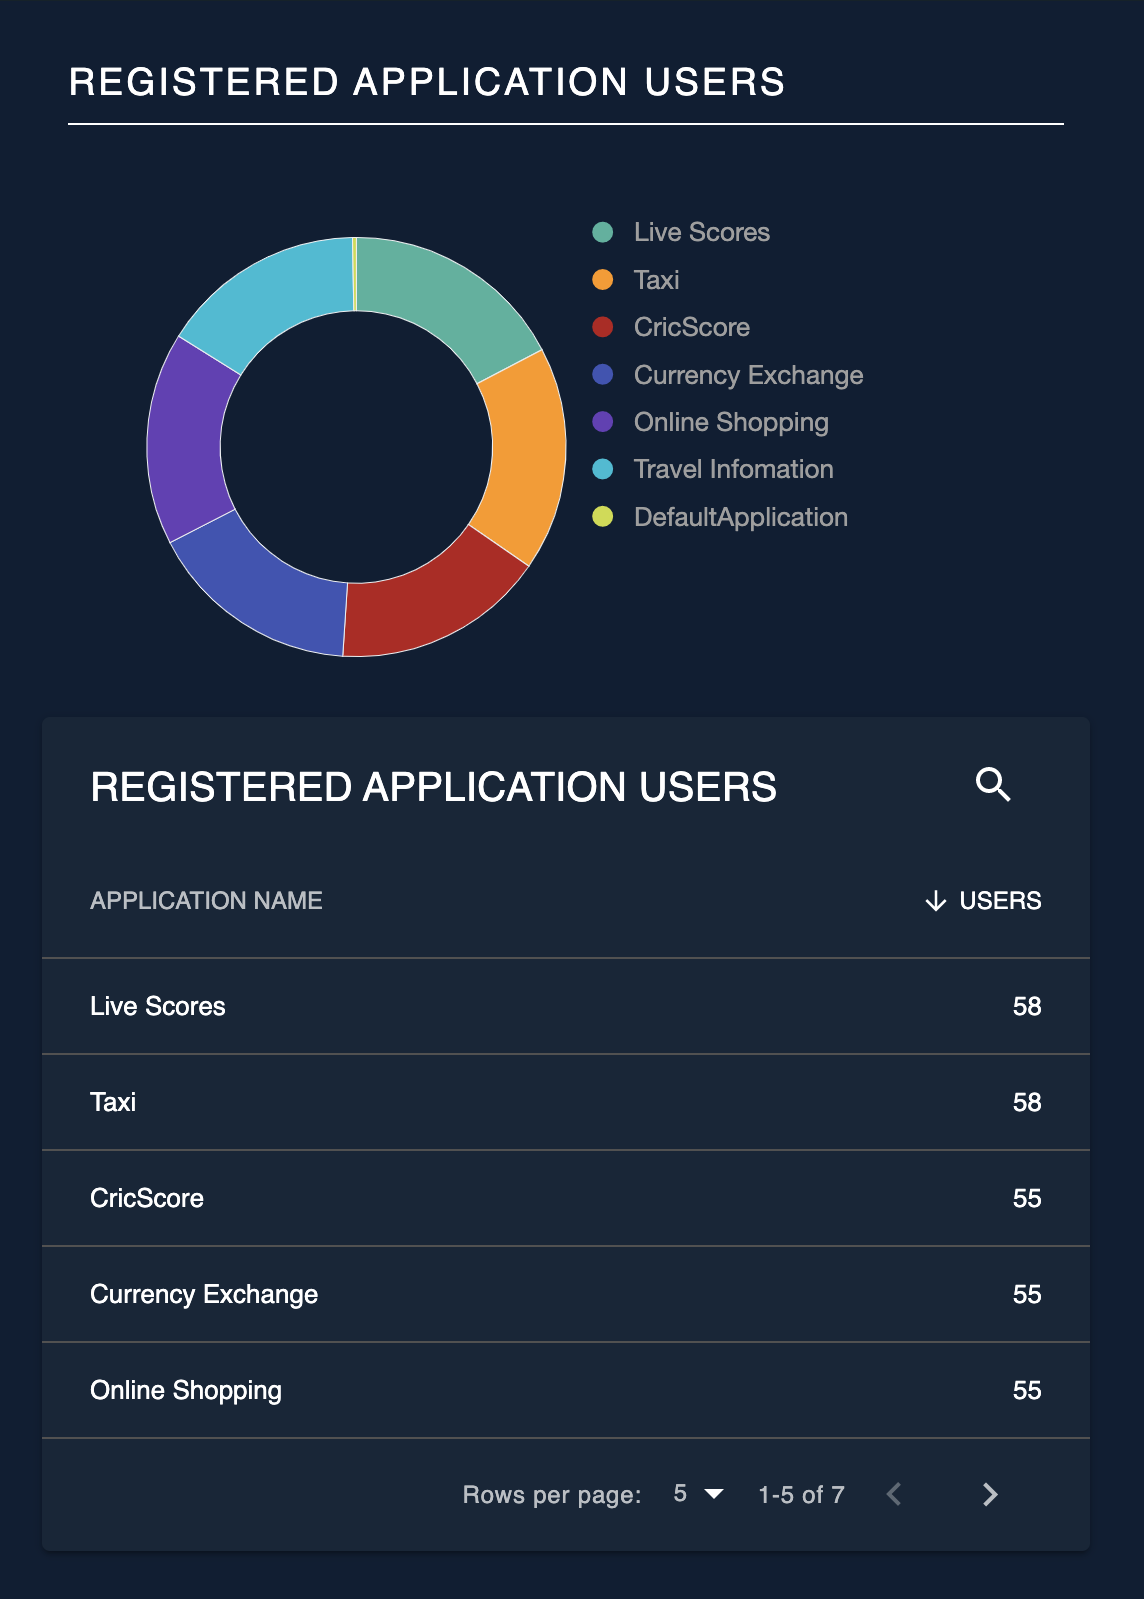
Registered Application Users
The statistics for this widget takes the number of users shared across each application in to consideration.
To enable application sharing among users within the same organization, see Sharing Applications.
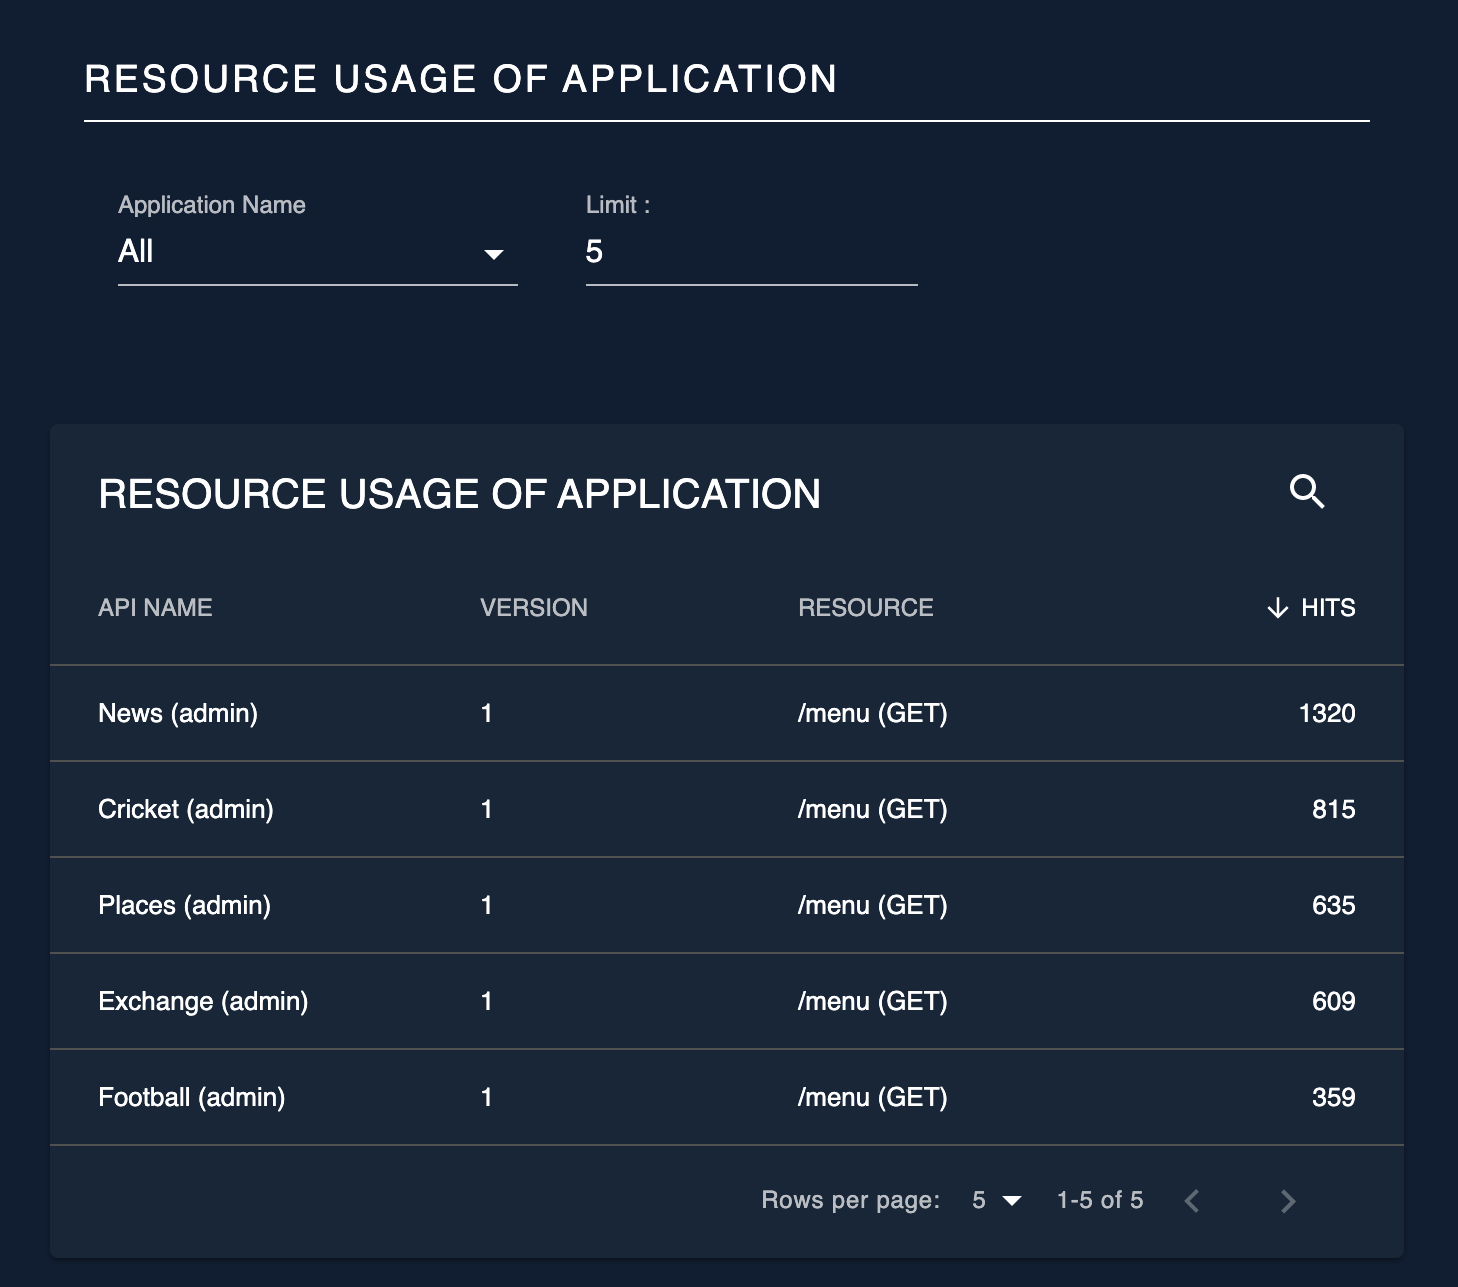
Resource Usage of Application
This widget displays the usage of resources of the APIs by each application.
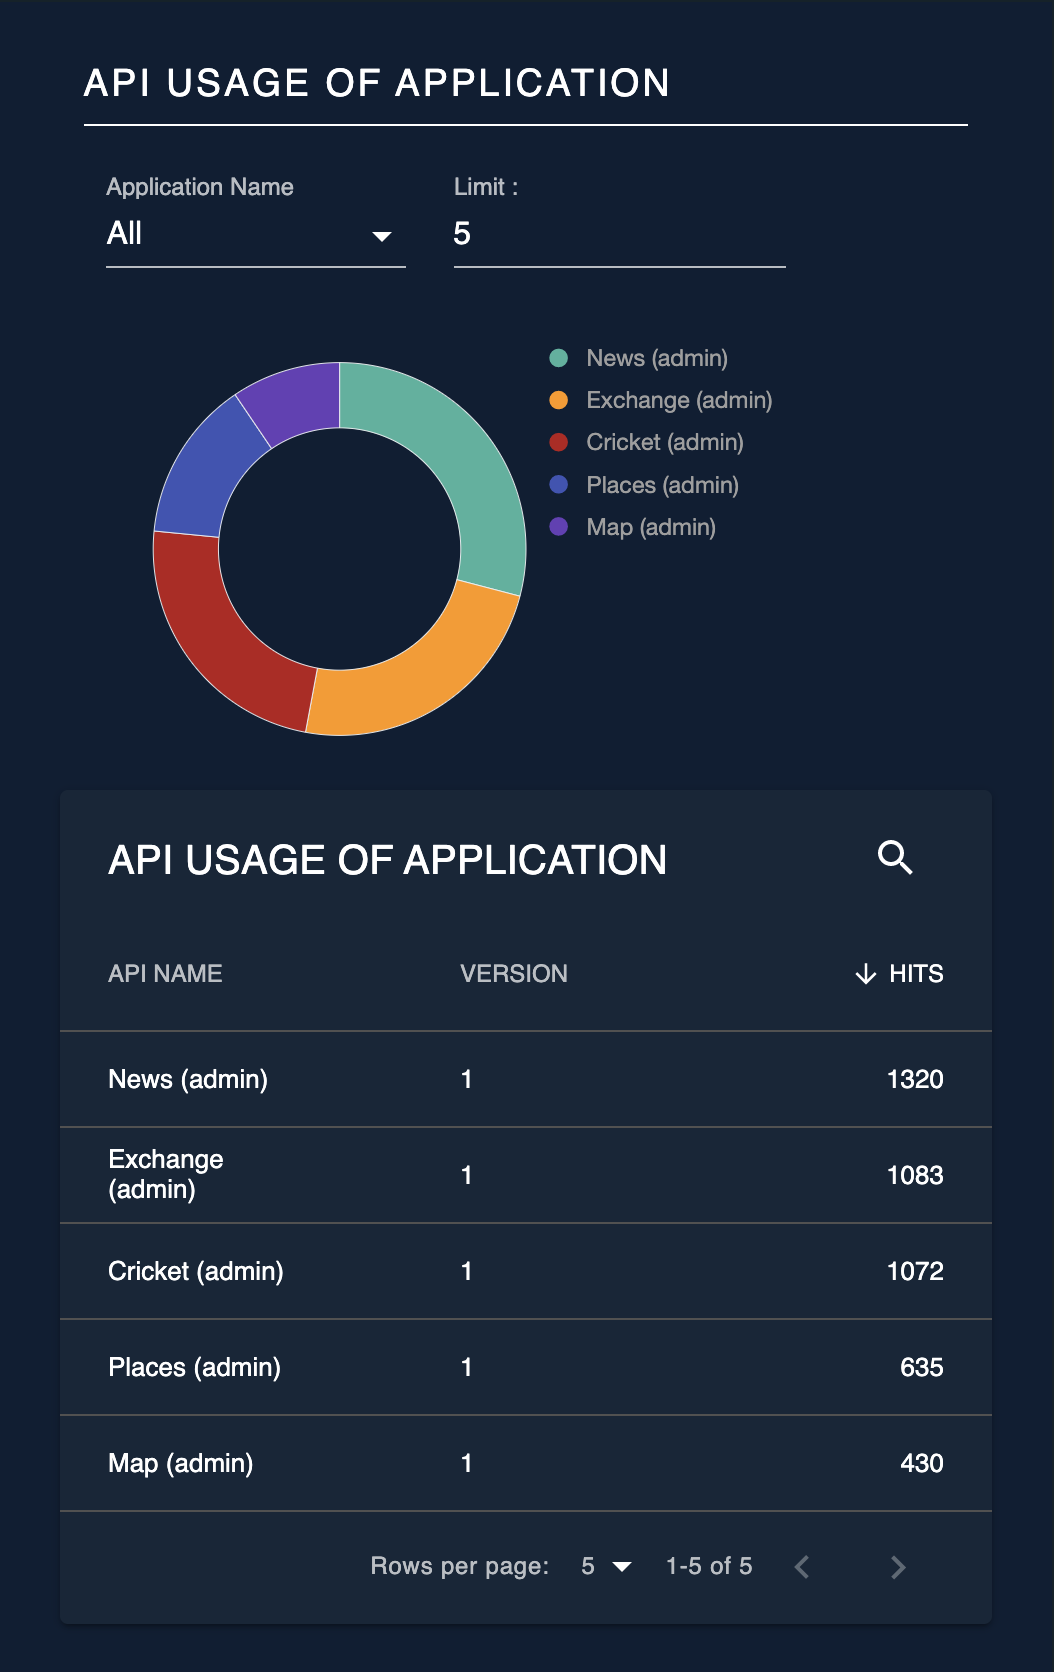
API Usage of Application
This widget displays the number of invocations made for each API by each application.
 Top
Top