API Analytics
The API Analytics Dashboard provides business insights on APIs enabling users to take proactive actions to improve profitability and the quality of the service provided. This dashboard focuses on API developers who wish to see the analytics related to their APIs. The API Analytics Dashboard will reveal the analytics data of APIs only if the user who has logged in has the required permission to view such data.
Note
During drill downs across dashboard pages, the date range selection will be preserved.
API usage analysis
The API usage related data is represented through the overall and overtime graphs in the API dashboard. Information related to the API usage can be found in the following 2 pages of the API Analytics Dashboard:
Usage summary
The usage summary page provides a summarized view of the usage of the selected API(s) for the specified time period.
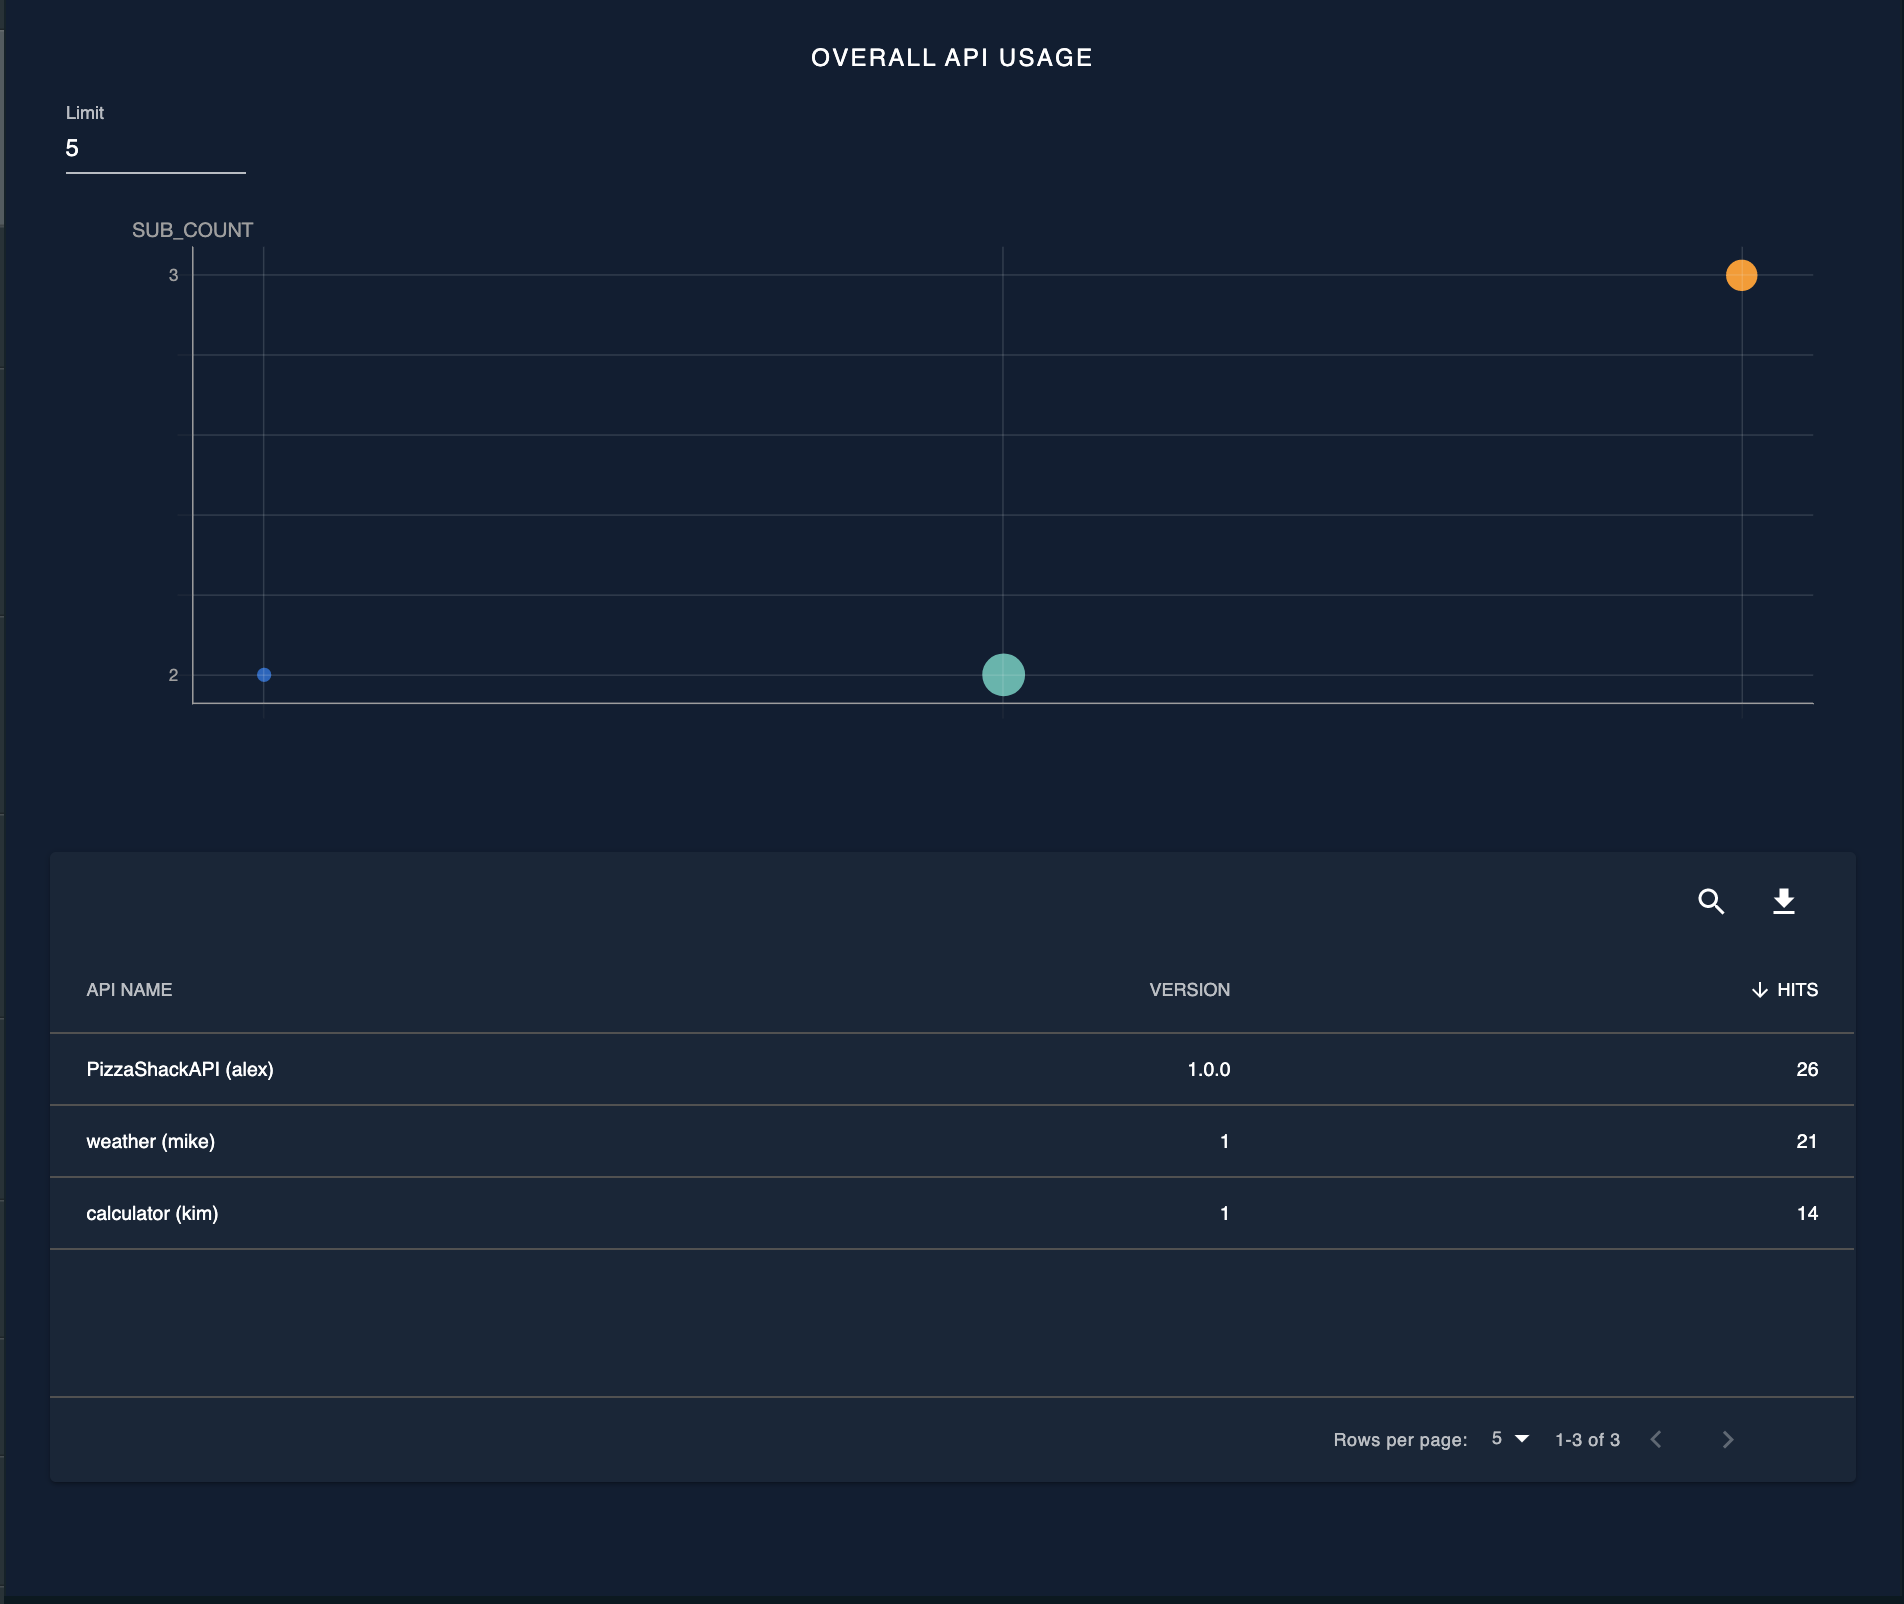
Overall API usage
This graph shows the usage count of the selected API(s) for the specified time period together with their subscription count. This widget contains two graphs.
- A 3D scatter plot matrix which shows the API, usage count, and the subscription count. The API name is taken as the X axis and the subscription count is shown in the Y axis, while the size of the data point indicates the usage count.
- A table which shows the usage count of each API.
The default view of these graphs is as follows:
- The scatter plot points will be ordered from left to right by the API name in ascending order.
- The table will be ordered based on the usage count in descending order.
When you click on a specific API entry in the table, it will be redirected to the API usage overtime page, which shows a breakdown of the usage count overtime.
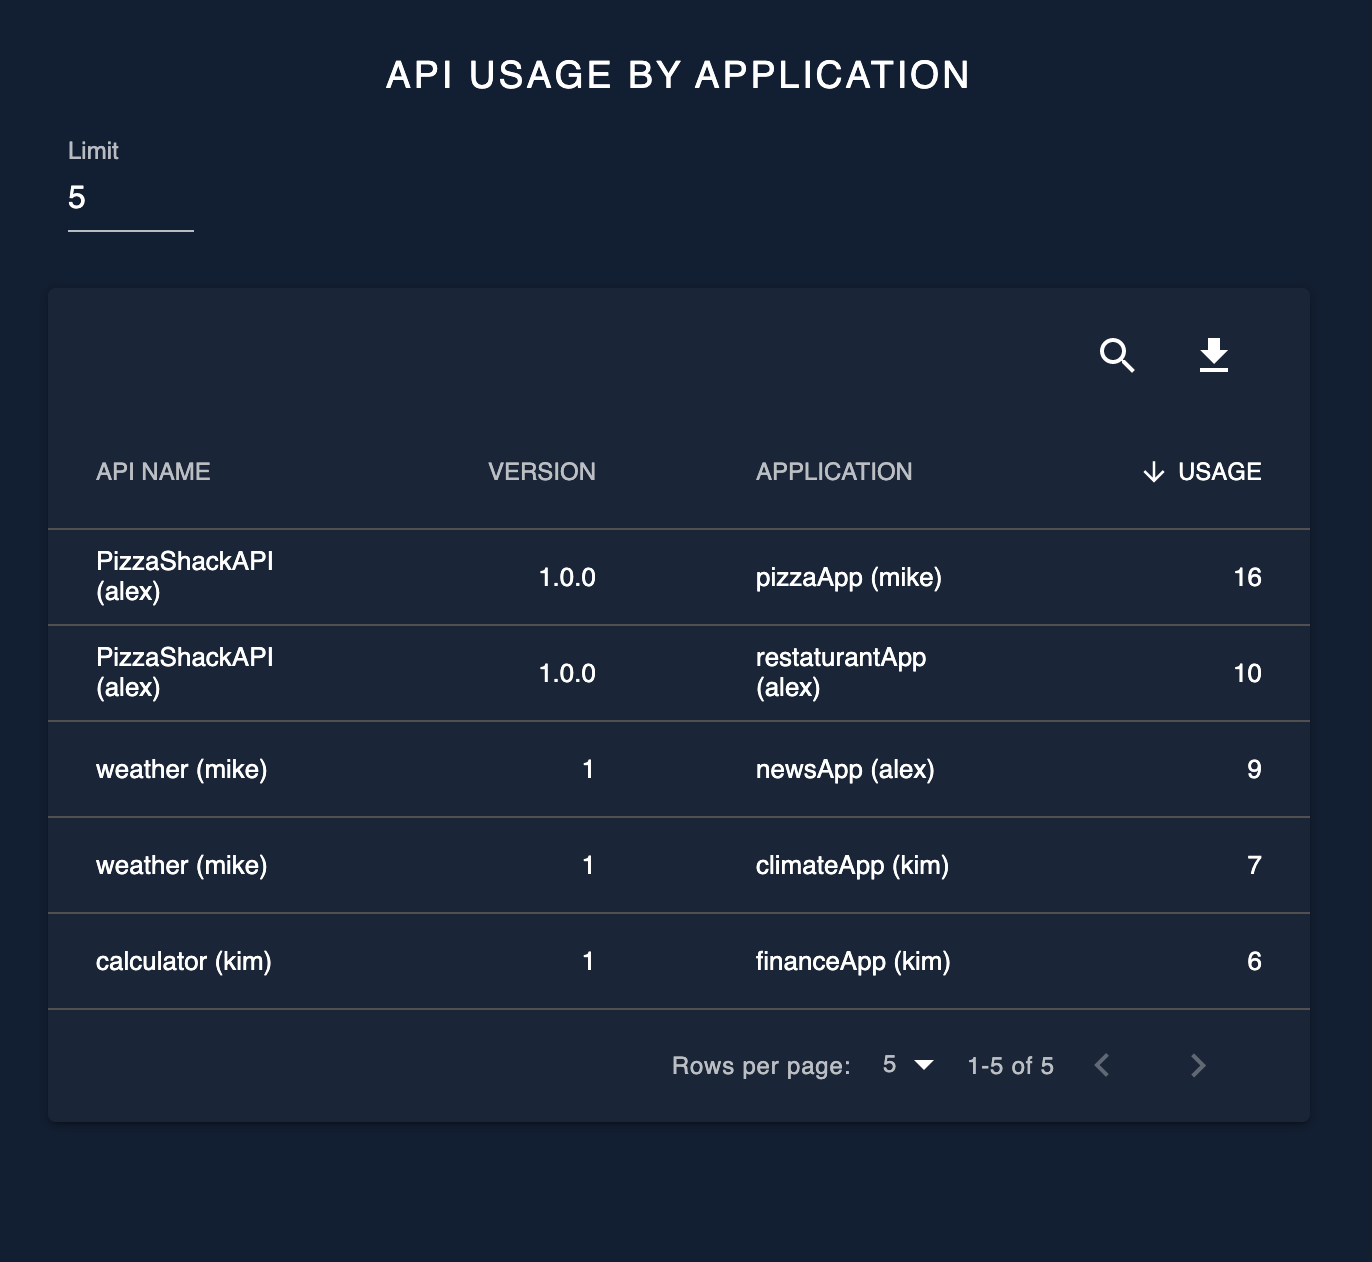
API usage by application
The API usage by application graph shows an application-wise breakdown of the usage count of the selected API(s) for the specified time period. The default view will be ordered based on the usage count in descending order. When you click on a specific entry in the table, it will be redirected to the API usage overtime page which shows a breakdown of the usage of the selected API overtime by the selected application.
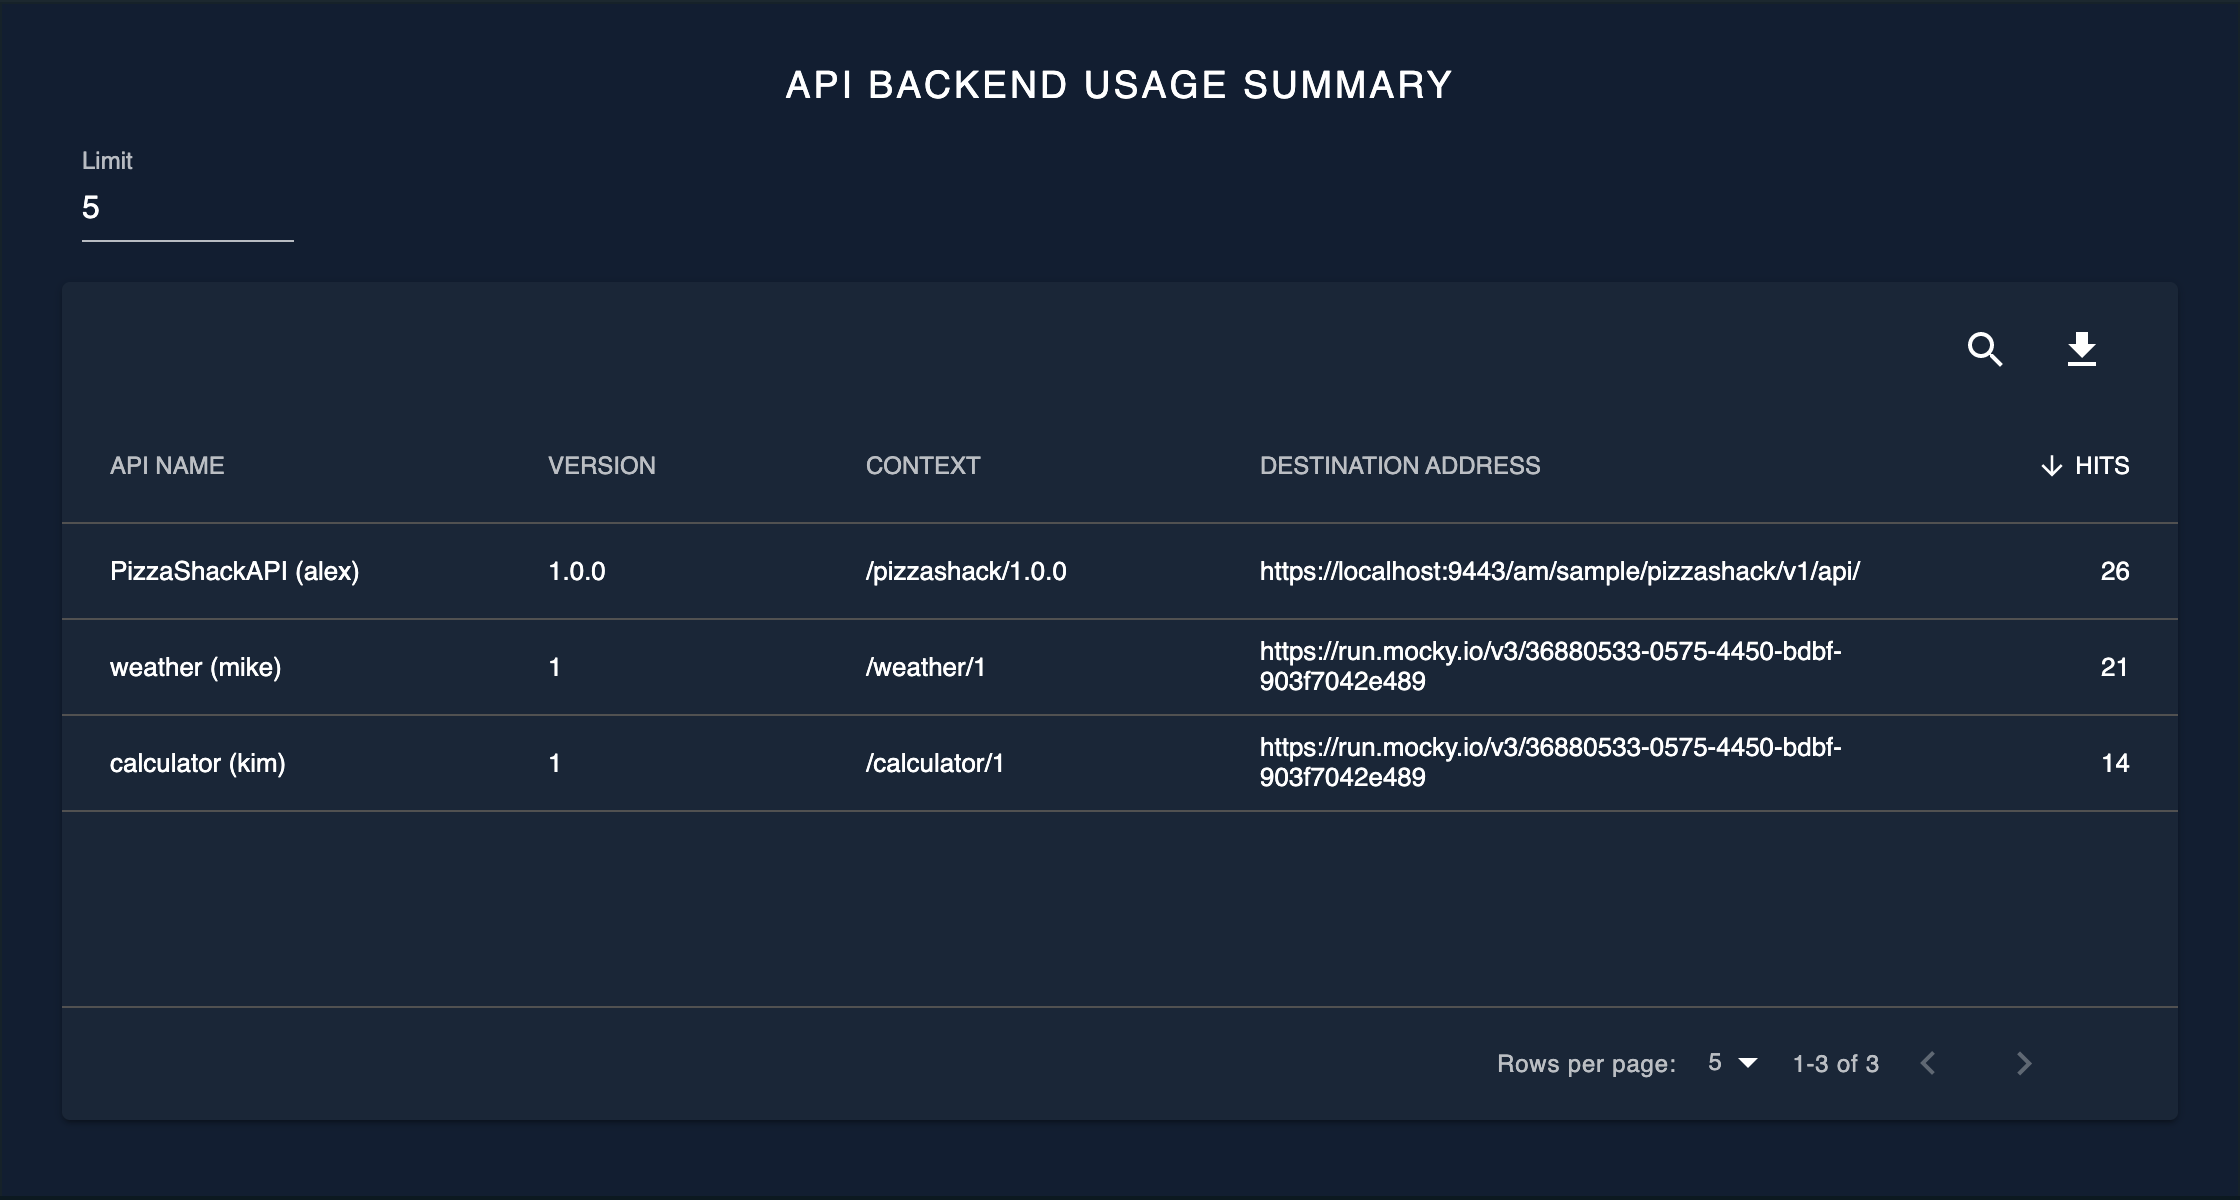
API backend usage summary
The API backend usage summary shows the usage count of the backends of the selected API(s) for the specified time period. The default view will be ordered based on the usage count in descending order.
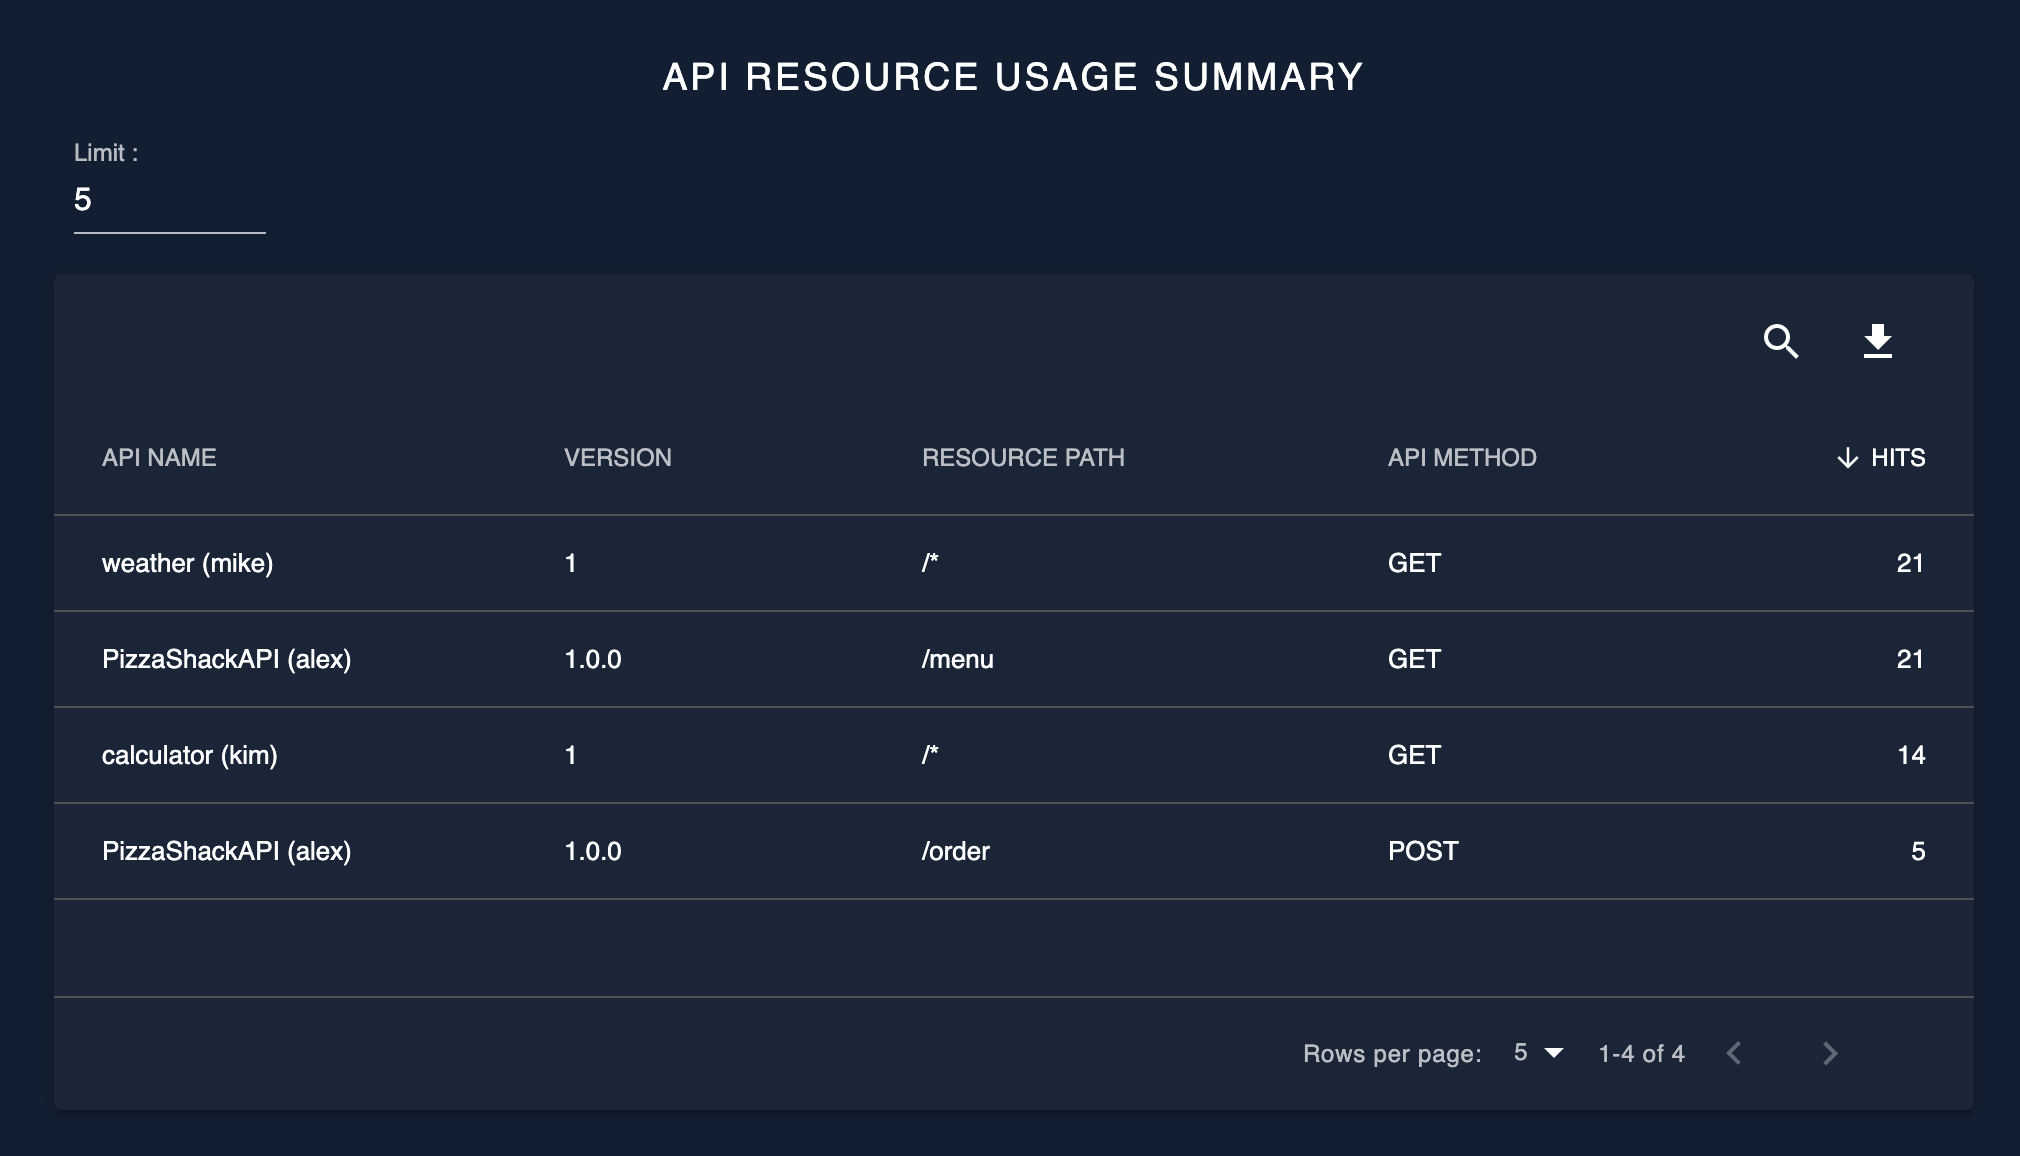
API resource usage summary
The API resource usage summary shows the usage count of the resources of the selected API(s) for the specified time period. The default view will be ordered based on the usage count in descending order.
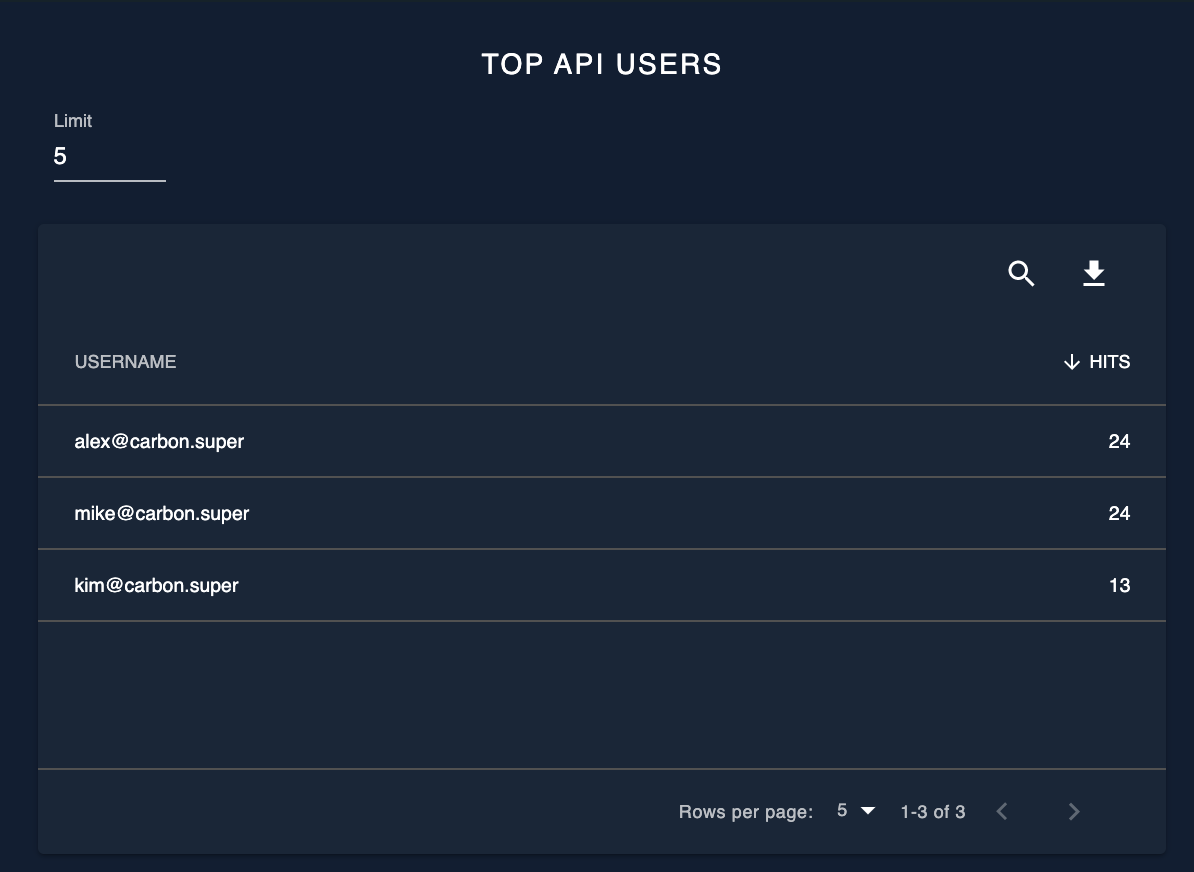
Top API users
The top API users widget will display the list of users who have carried out the most number of API invocations and it will be ordered in descending order based on the usage count.
API usage
The API usage page provides an overtime representation of the usage of the selected API(s) for the specified time range.
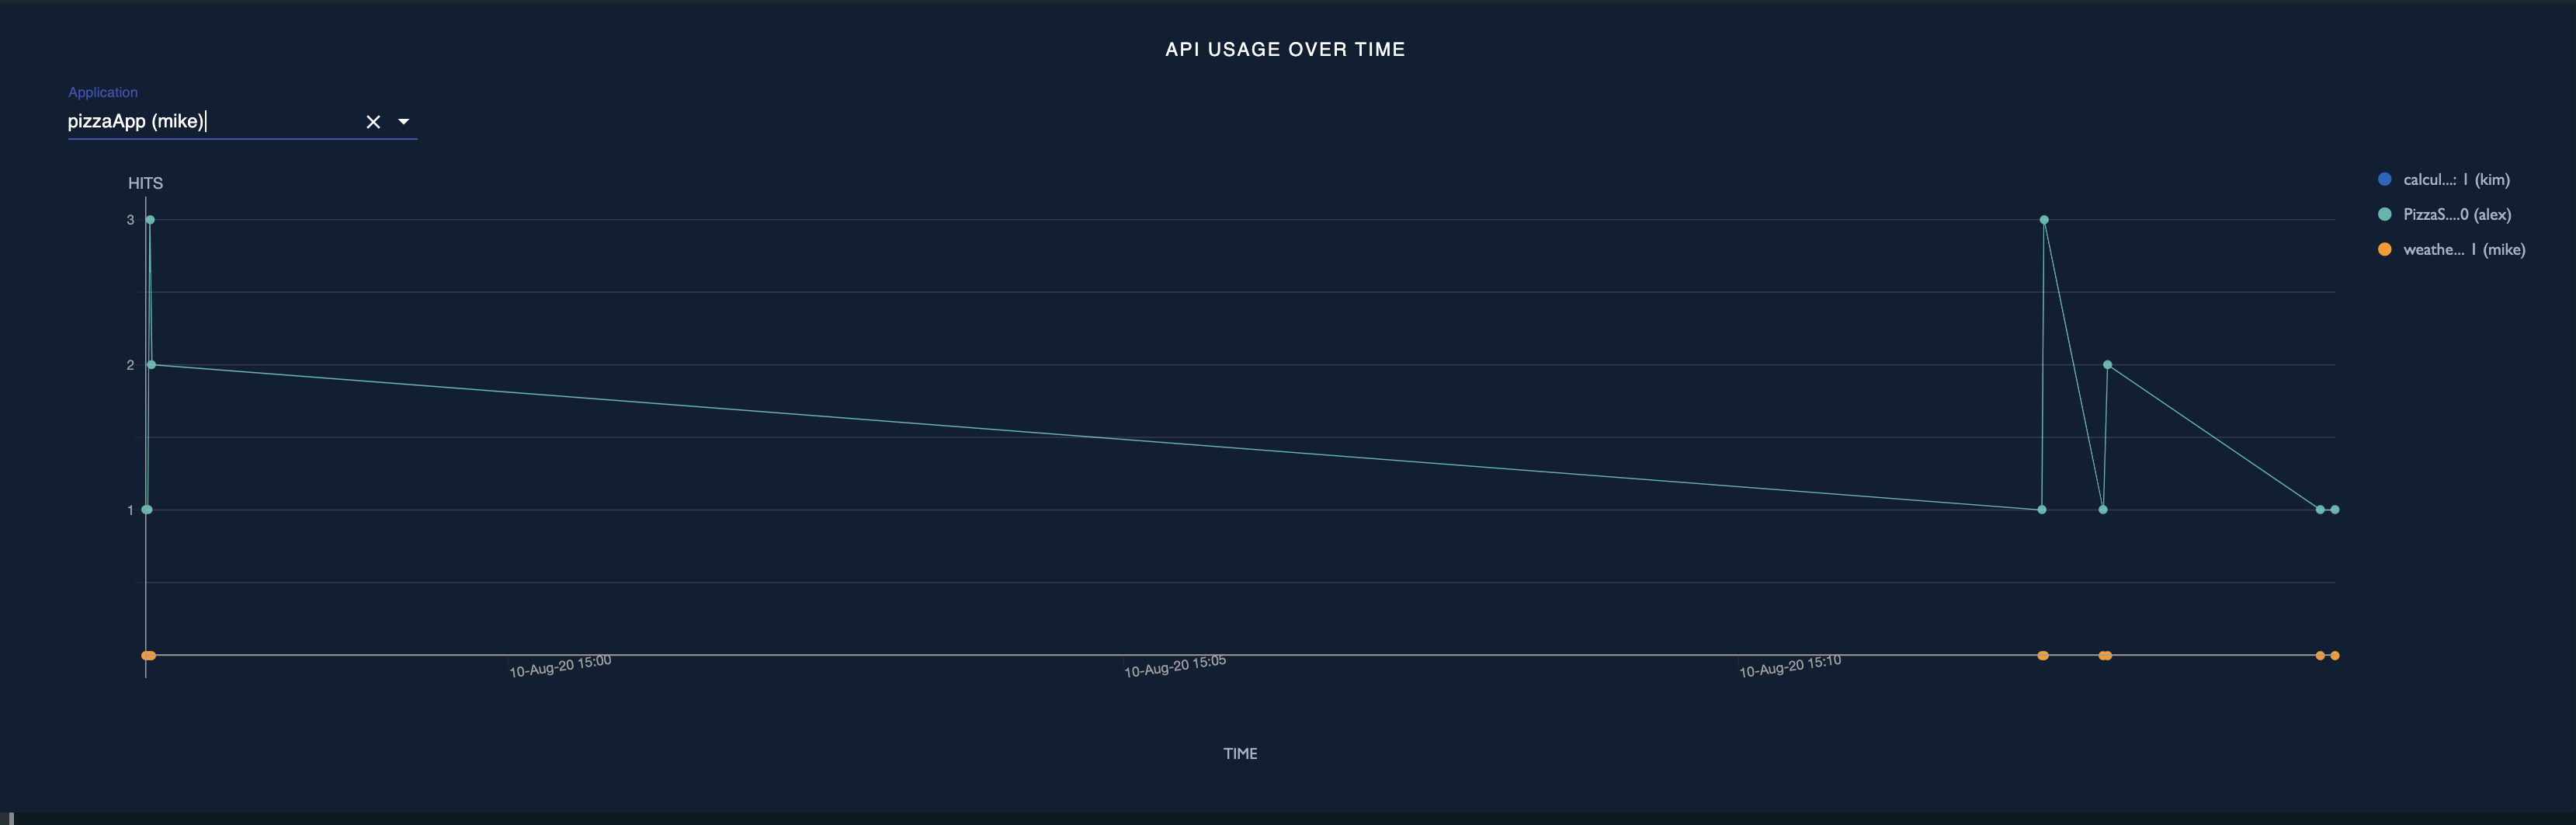
API usage overtime
The API usage overtime widget shows the usage of the selected API(s) for the specified time range. The usage patterns displayed in this graph will help to identify the trending APIs and to decide which API(s) to deprecate.
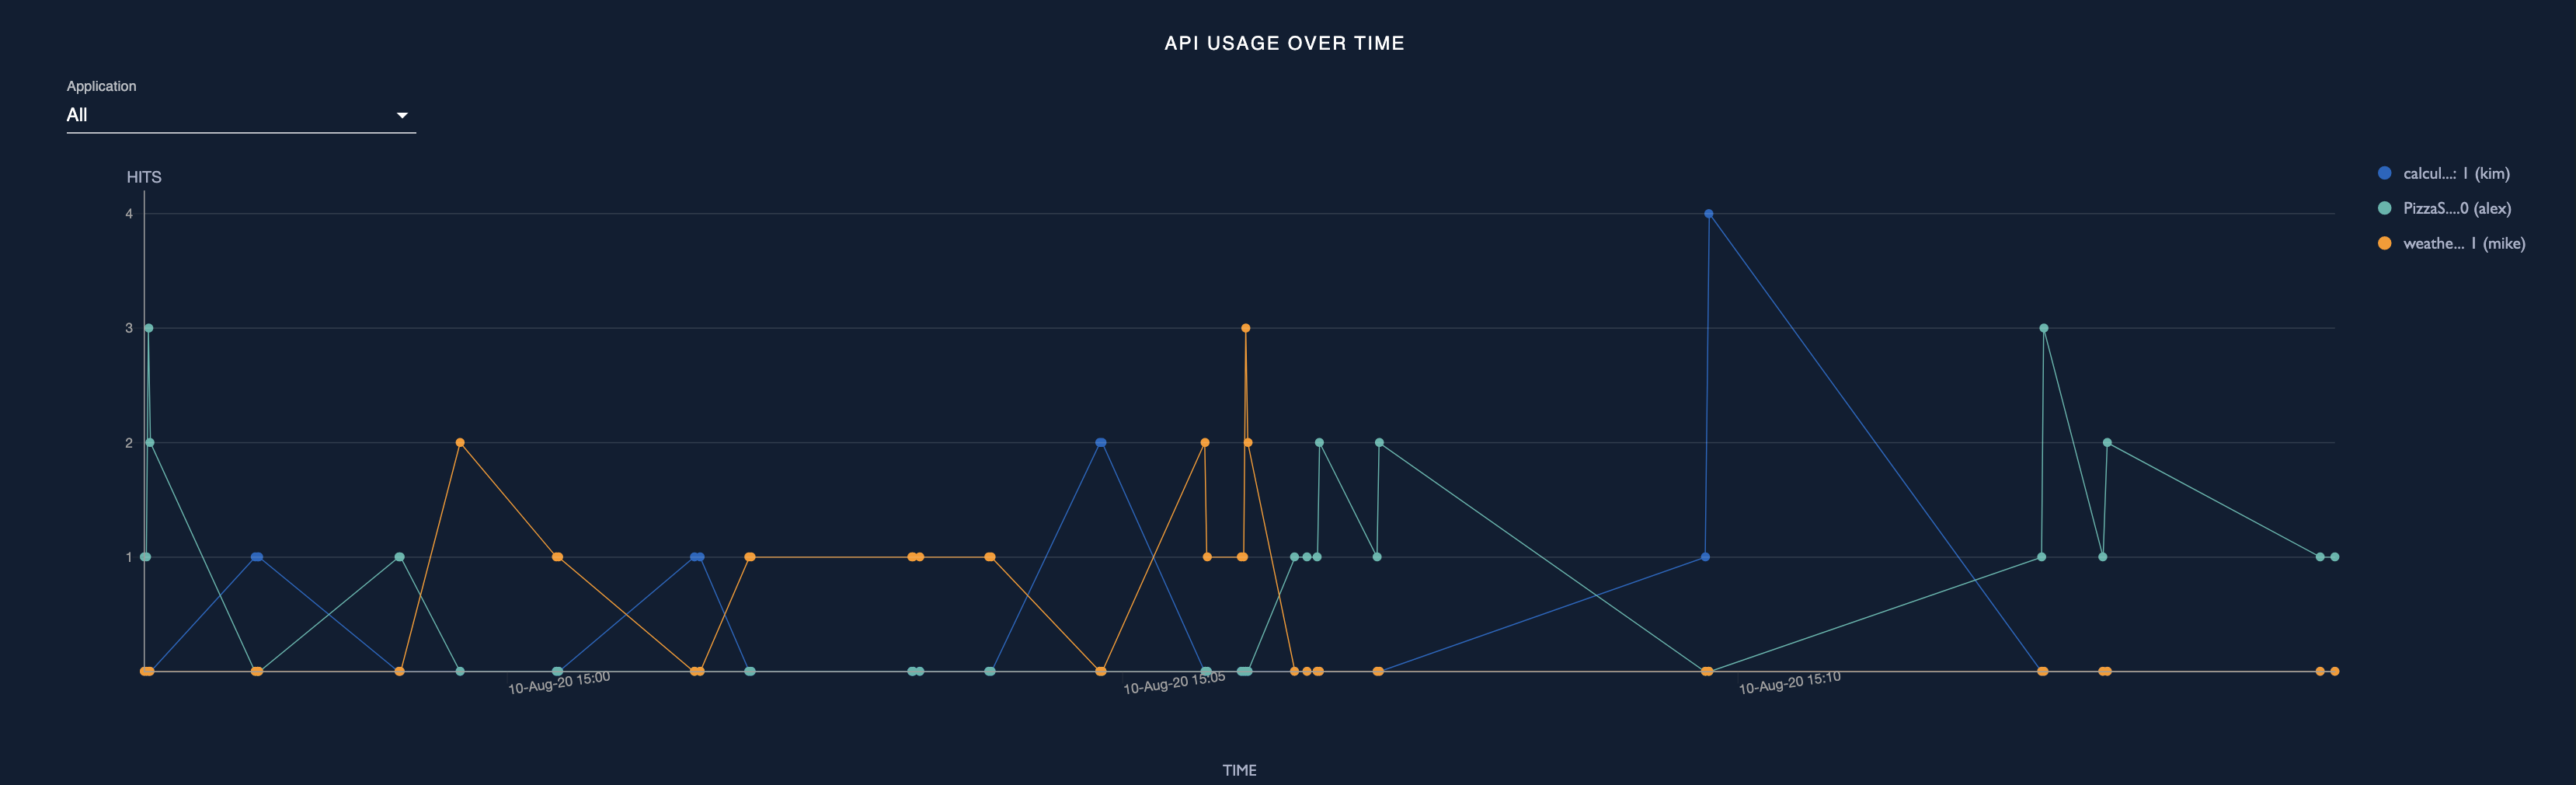
This graph can also be used to view the usage of the selected API(s) by a specific application overtime for the specified time period. The applications listed will be those with subscriptions to the selected API(s).
Viewing API performance
Analyzing the performance of APIs will help identify problematic APIs. Information related to API performance can be found in the following page of the API Analytics Dashboard:
API performance
API latency time
The API latency time graph shows the latency breakdown of the selected resource of the selected API for the specified time period. The latencies displayed in this widget are as follows:
-
Response time
Total time taken for request/response flow.
-
Security latency
Time taken for authentication.
-
Throttling latency
Time taken for throttling the request/response.
-
Request mediation latency
Time taken to mediate the request.
-
Response mediation latency
Time taken to mediate the response.
-
Backend latency
Time taken by the backend to return the response.
-
Other latency
Time taken to process tasks other than mentioned above.
Error analysis
The error analysis will help identify problematic APIs so that proactive measures could be taken to improve these APIs. API error-related data are displayed on the following page in the API analytics dashboard:
API faults
The API faults page provides information about the throttled out requests and faulty requests of a selected API. The API faults overtime widget provides an overtime representation of the faulty invocations of the selected API. The API throttled out requests overtime widget provides an overtime representation of the throttled out invocations of the selected API.
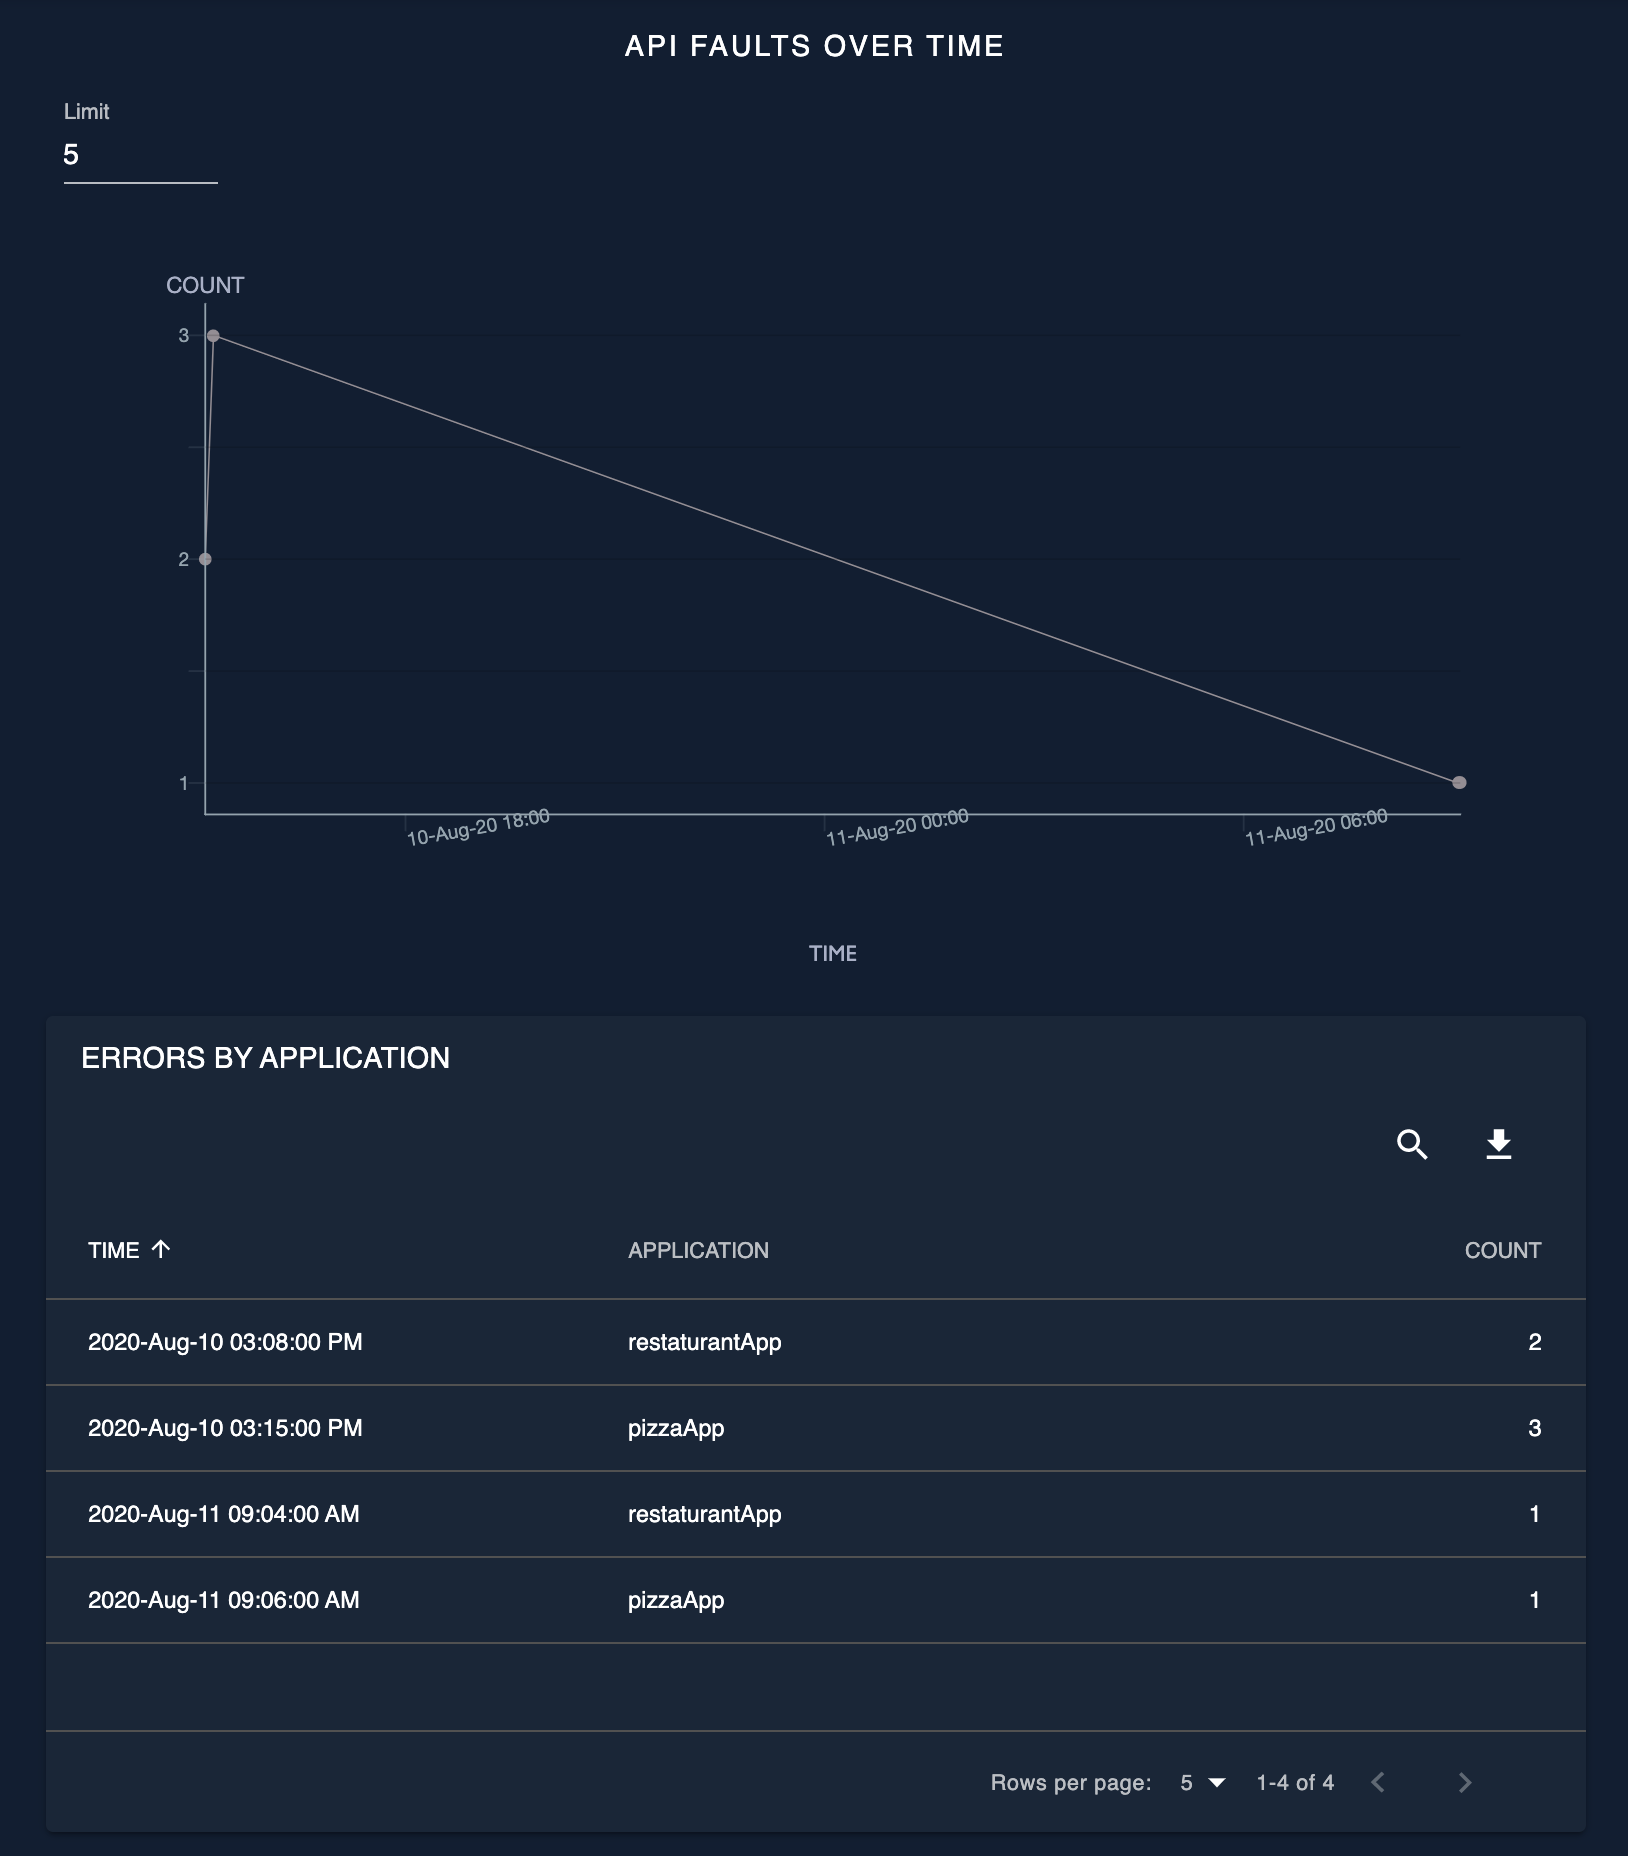
API faults overtime
The API faults overtime widget shows the faulty invocations of the selected API overtime for the specified time range. This widget contains the following two representations:
- A timeline graph which shows the faulty request count overtime
- A table which shows an application-wise breakdown of the faulty request count
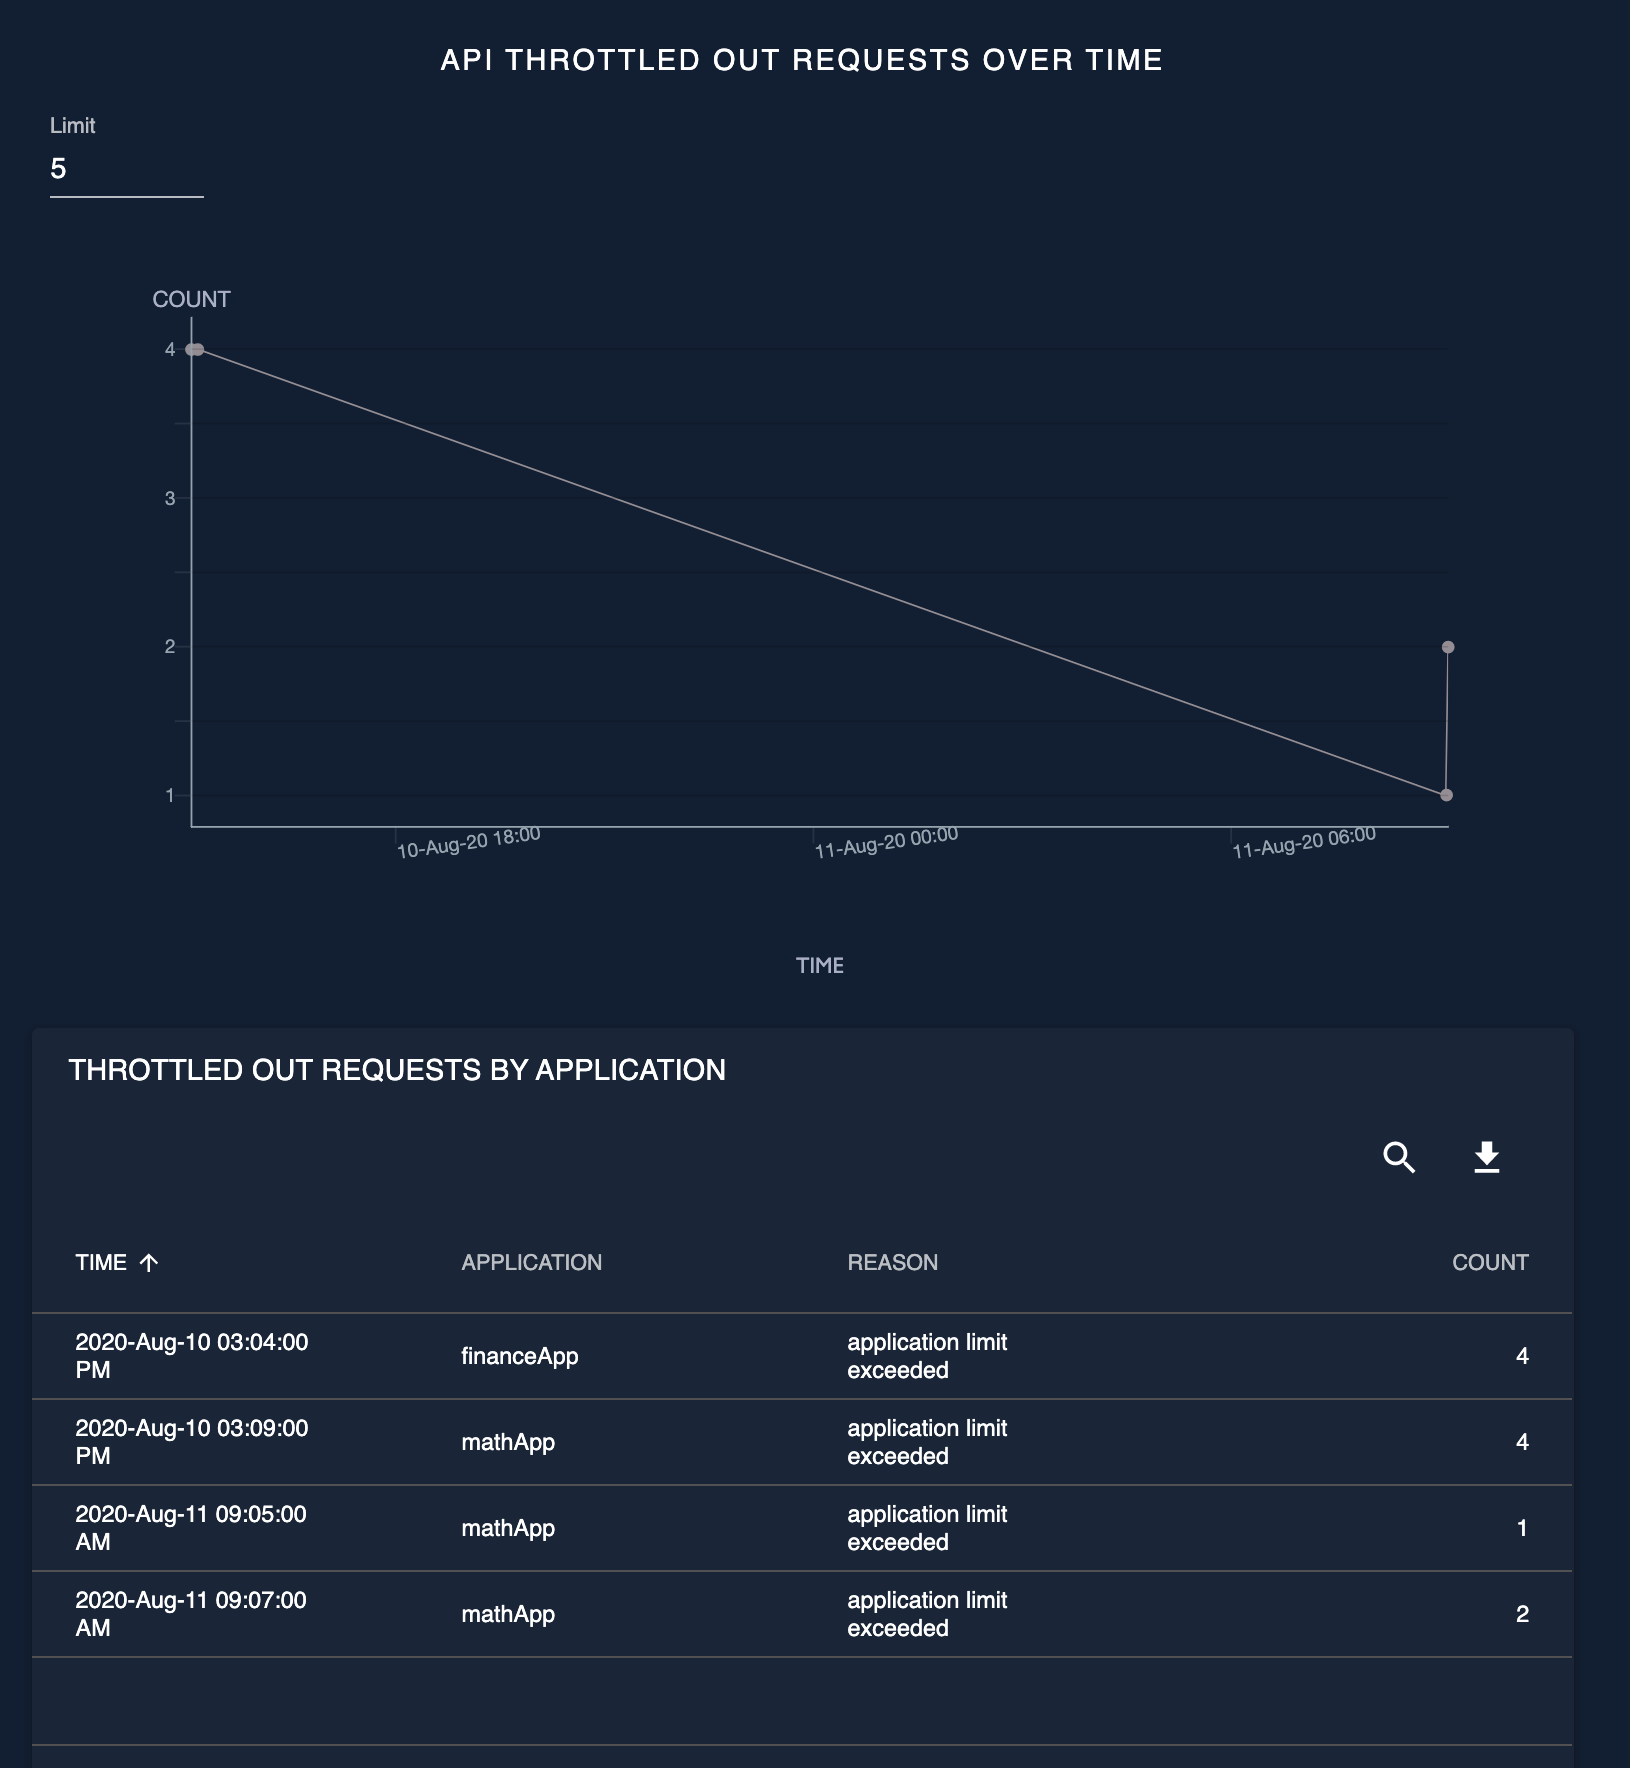
API throttled out requests overtime
The API throttled out requests overtime widget shows how the selected API was throttled out overtime for the specified time range. This widget contains the following two representations:
- A timeline graph which shows the throttled out request count overtime.
- A table that shows an application-wise breakdown of the throttle count and reason for throttling.