Configuring Analytics Workers as Active-Active
You can use the Active-Active deployment pattern to configure API-M Analytics as a scalable deployment. The following sub-sections contain an overview of the Active-Active deployment pattern and instructions to configure it.
Overview
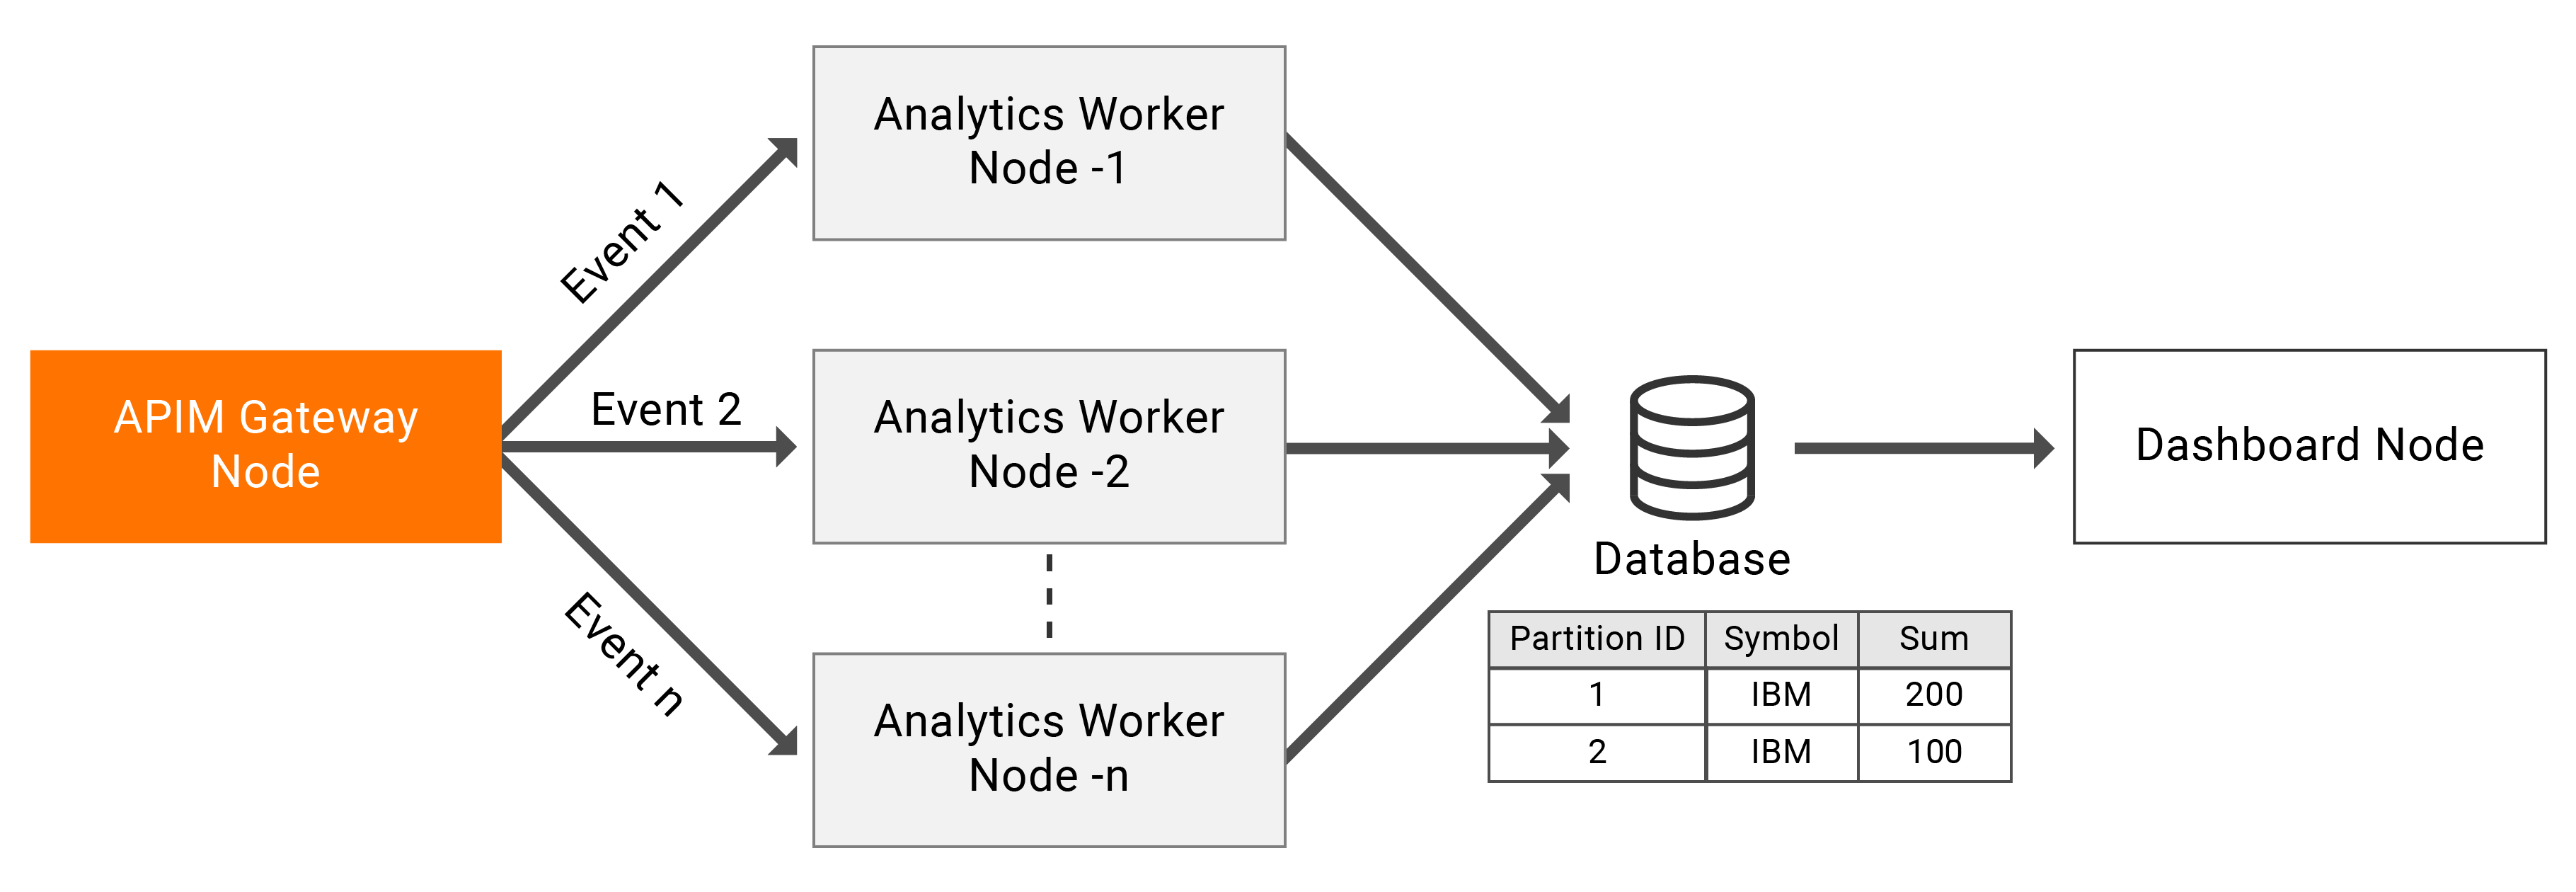
The above diagram represents a deployment where you are not limited to two nodes. You can scale the event processing horizontally by adding more API-M Analytics nodes to the deployment. In this deployment, it is recommended to configure the Gateway node to publish events to multiple API-M Analytics nodes in a Round-robin manner to ensure better fault tolerance. The publishing of events can be carried out by one or more of the API-M Gateway nodes.
This setup uses distributed aggregations to perform aggregations in a distributed manner and achieve scalability.
Distributed aggregations partially process aggregations in different nodes. Therefore, this allows you to assign one node to process only a part of an aggregation (regional scaling, etc.). Therefore, in order to support distributed aggregations, all the aggregations must have a physical database and must be linked to the same database.
Partitioning aggregations can be enabled at aggregation-level and also at a global level.
To enable partitioning aggregations at the global-level, add the following section with the PartitionById annotation set to true in the <APIM-ANALYTICS_WORKER_HOME>/conf/worker/deployment.yaml file.
siddhi:
 properties:
   partitionById: true
   shardId: wso2-dc
Configuring an active-active cluster
To configure the API-M Analytics nodes to deploy them as an active-active cluster, edit the <API-M_ANALYTICS_HOME>/conf/worker/deployment.yaml file as follows:
Note
Before you begin:
- Download two binary packs of WSO2 API-M Analytics.
- Set up a working RDBMS instance that will be used with the WSO2 API-M Analytics cluster.
-
For each node, enter a unique ID for the ID property under the
wso2.carbonsection.This is used to identify each node within a cluster. For example, you can add IDs as shown below.
- For node 1:
wso2.carbon: id: wso2-am-analytics-1- For node 2:
wso2.carbon: id: wso2-am-analytics-2 -
Enable partitioning aggregations for each node, and assign a unique shard ID for each node.
Set the
partitionByIdandshardIdparameters as Siddhi properties as shown below.Note
Assigning shard IDs to nodes allows the system to identify each unique node when assigning parts of the aggregation. If the shard IDs are not assigned, the system uses the unique node IDs (defined in step 1) for this purpose.
The maximum length of theshardIdproperty is limited to 20.- For node 1:
siddhi: properties: partitionById: true shardId: wso2-am-analytics-1 - For node 2:
siddhi:
  properties:
    partitionById: true
    shardId: wso2-am-analytics-2
Note
- To maintain data consistency, do not change the shard IDs after the first configuration.
- When you enable aggregation partitioning, a new column ID named
SHARD_IDis introduced to the aggregation tables. Therefore, you need to carry out one of the following options after enabling aggregation partitioning to avoid errors occurring due to the differences in the table schema.- Delete all the aggregation tables for SECONDS, MINUTES, HOURS, DAYS, MONTHS, YEARS.
- Edit the aggregation tables by adding a new column named
SHARD_ID, and specify it as a primary key.
- For node 1:
-
Configure a database and thereafter update the default configuration for the
APIM_ANALYTICS_DBdata source with parameter values suitable for your requirements in the<APIM_ANALYTICS_HOME>/conf/worker/deployment.yamlfile.- name: APIM_ANALYTICS_DB description: "The datasource used for APIM statistics aggregated data." jndiConfig: name: jdbc/APIM_ANALYTICS_DB definition: type: RDBMS configuration: jdbcUrl: "jdbc:mysql://localhost:3306/APIM_ANALYTICS_DB_1?useSSL=false" password: pass username: root driverClassName: com.mysql.jdbc.Driver minIdle: 5 maxPoolSize: 50 idleTimeout: 60000 connectionTestQuery: SELECT 1 validationTimeout: 30000 isAutoCommit: false- If you have configured Analytics for WSO2 API Microgateway, import the appropriate DB script from the
<APIM_ANALYTICS_HOME>/wso2/worker/dbscripts/apimgt/directory.
- If you have configured Analytics for WSO2 API Microgateway, import the appropriate DB script from the
Note
As explained above, the events are processed in multiple active nodes. Even though this is usually a stateful operation, you can overcome the node-dependent calculations via distributed aggregation. This allows WSO2 API-M to execute API-M Analytics scripts that depend on incremental distributed aggregation.
However, in an active-active deployment, all the processing is done locally. Therefore, all the alerts are generated based on the local counts. As a result, all the generated alerts are specific to a single Gateway. However, some alerts need the distributed Gateway count. As a result, the accuracy of some of the alerts get affected in an active-active deployment.
The following are the affected alert types in an active-active deployment.
- Abnormal Resource Access
- Unseen Source IP Access
- Tier Crossing